Downloaded 272 times


![ clc;
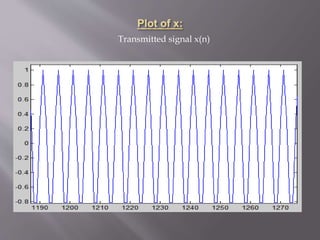
plot(x) %Plot of transmitted signal x(n)
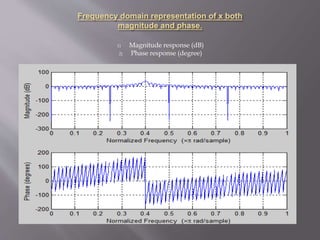
figure,freqz(x) %Frequency response of x(n)
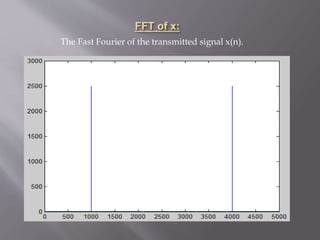
X=fft(x);
figure,plot(abs(X))
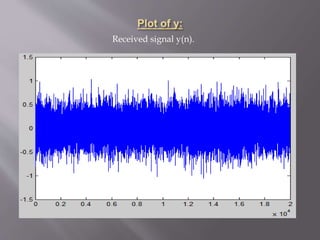
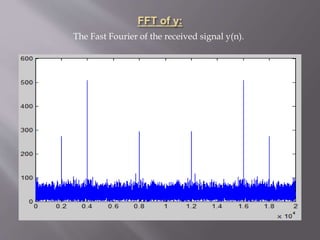
figure,plot(y) %Plot of received signal y(n)
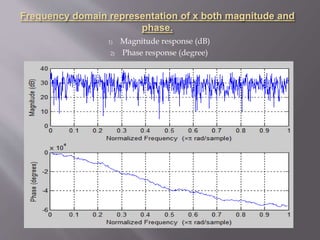
figure,freqz(y) %Frequency response of y(n)
Y=fft(y);
figure,plot(abs(Y))
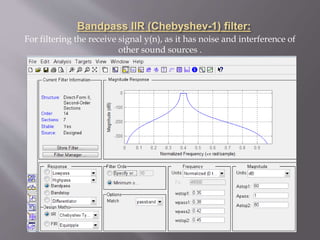
[b,a]=SOS2tf(SOS,G);
y2=filter(b,a,y); %filter calling.
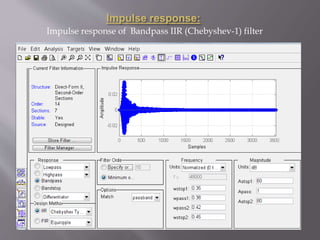
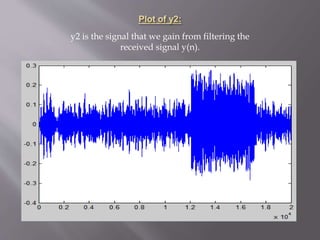
figure,plot(y2) % plot of filtered signal y2(n)
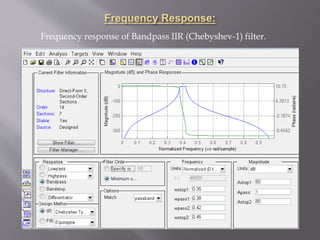
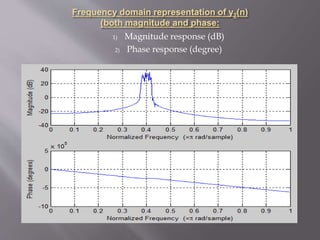
figure,freqz(y2) %Frequency response of y(n)
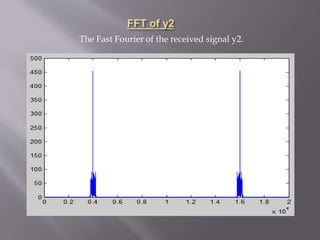
Y2=fft(y2);
figure,plot(abs(Y2))
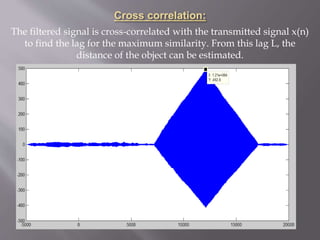
n0=1:length(x); % cross co-relation of transmitted
n2=1:length(y2); % signal x(n) and filtered signal y2(n)
[x1,n1]=sigfold(x,n0);
[z,n]=conv_m(x1,n1,y2,n2);
figure,plot(n,z)](https://image.slidesharecdn.com/ccc3ed93-f538-47a8-b94c-a4eab070e7af-160319063234/85/Sonar-application-DSP-20-320.jpg)


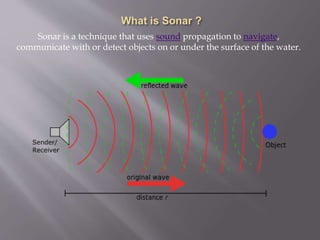
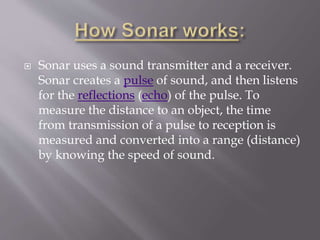
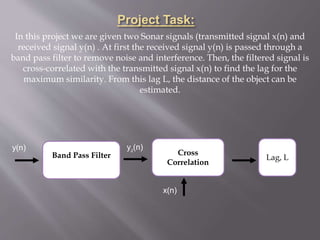
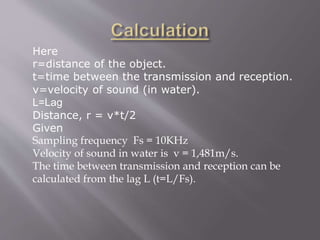
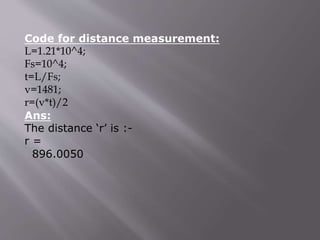
This project involves using sonar signals to estimate the distance of an object. The received sonar signal y(n) is passed through a bandpass filter to remove noise, producing the filtered signal y2(n). y2(n) is then cross-correlated with the transmitted signal x(n) to determine the lag L. Using the lag L, sampling frequency, and speed of sound in water, the distance to the object is estimated as 896.0050 meters.


![Basic of 3 g technologies (digi lab_project).pptx [repaired]](https://cdn.slidesharecdn.com/ss_thumbnails/basicof3gtechnologiesdigilabproject-161116053851-thumbnail.jpg?width=640&height=640&fit=bounds)


