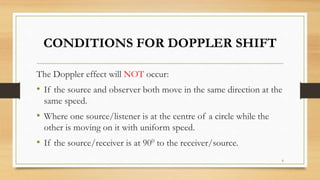
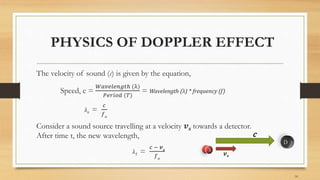
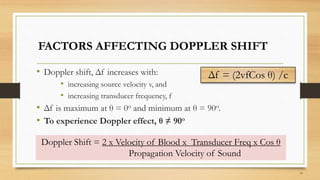
This document provides an overview of Doppler ultrasound, including:
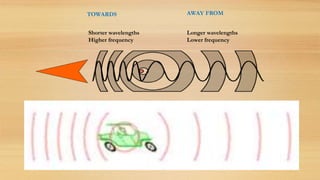
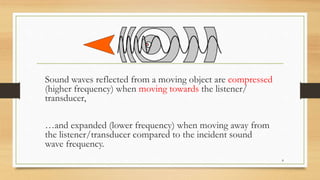
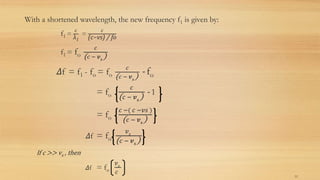
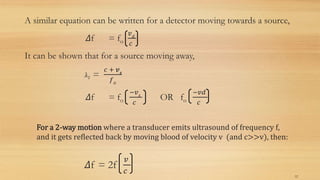
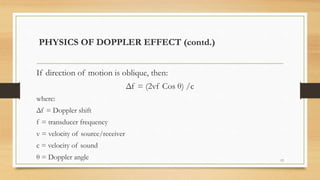
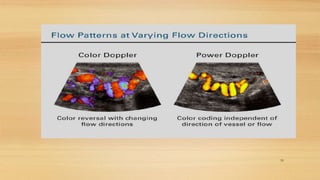
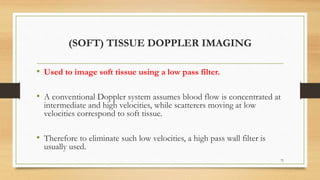
- The physics of the Doppler effect as it relates to ultrasound imaging. Changes in frequency due to relative motion between a sound source and receiver.
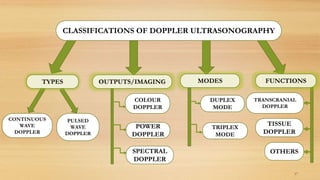
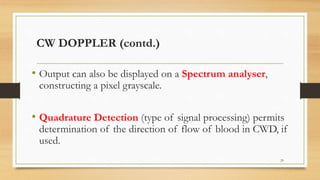
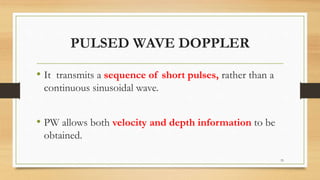
- Two main types of Doppler imaging - pulsed wave Doppler which allows measurement of velocity and depth, and continuous wave Doppler which is better for measuring fast flow.
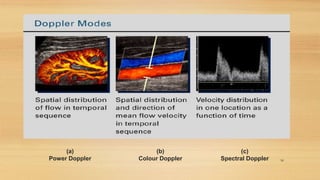
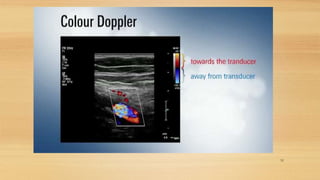
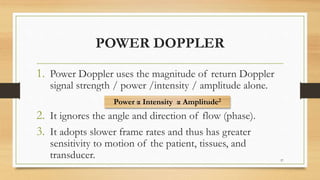
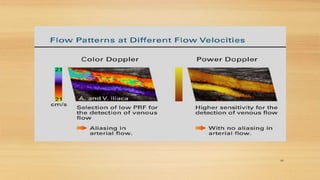
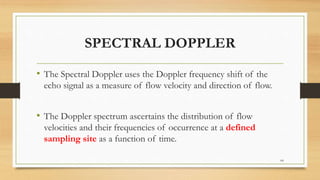
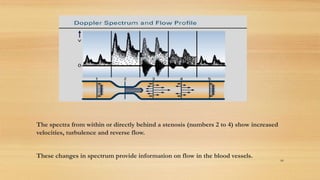
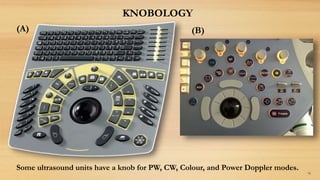
- Additional Doppler modes like color Doppler, power Doppler, and spectral Doppler which display Doppler information in different ways.
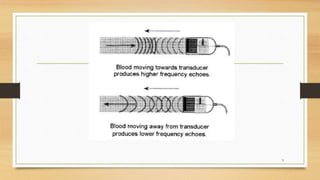
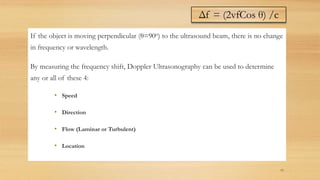
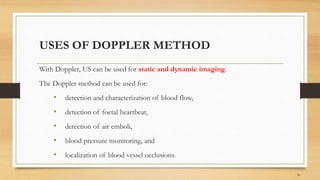
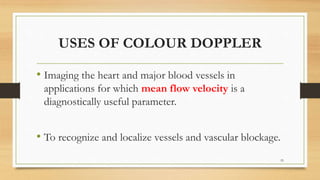
- Applications of Doppler ultrasound include evaluating blood flow, detecting fetal heartbeats, and more.

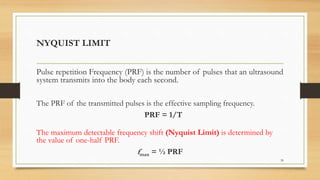
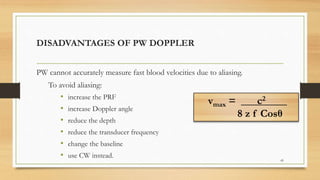
![22
Transmitter and Receiver are angled
against each other.
The Transmitter produces sinuosoidal US
waves of the form Cos 2πfot.
The received signal is of form:
Cos [ 2π (fo + fD) t ]
The Doppler signal is thus of form:
Cos 2πfDt , and can be recovered via
frequency demodulation of the
received signal.
Fig: CW Doppler Scan Geometry (angled Tx and Rx)](https://image.slidesharecdn.com/dopplereffect-170520070305/85/Doppler-Effect-Ultrasound-22-320.jpg)


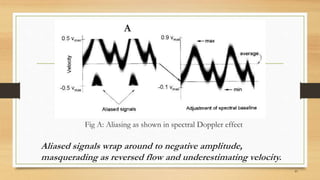


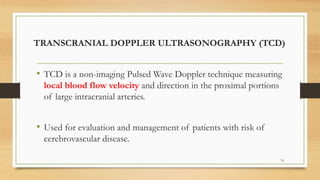


![If the velocity in an artery exceeds 250cm/s, that area is at a higher risk of stroke
[Adams]. 77
Fig: Transcranial Doppler Ultrasound of blood vessels in the Circle of Willis of the brain](https://image.slidesharecdn.com/dopplereffect-170520070305/85/Doppler-Effect-Ultrasound-77-320.jpg)


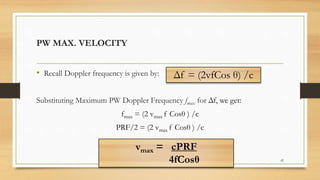
![CTA vs MRA
• Aorto-iliac Arterial Disease: CTA shows higher sensitivity
(98.7%) than CCD (96.2%) in the assessment of aorto-iliac
arterial disease [A. Osama et al, 2012 ].
• Agreement between DSA and CCD was 96.1%
91](https://image.slidesharecdn.com/dopplereffect-170520070305/85/Doppler-Effect-Ultrasound-91-320.jpg)


![Doppler principles [1]](https://cdn.slidesharecdn.com/ss_thumbnails/dopplerprinciples1-210517111539-thumbnail.jpg?width=640&height=640&fit=bounds)


