Downloaded 184 times
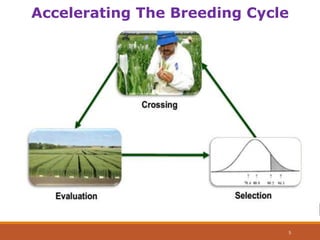
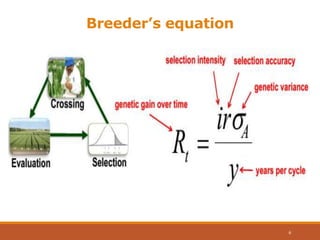


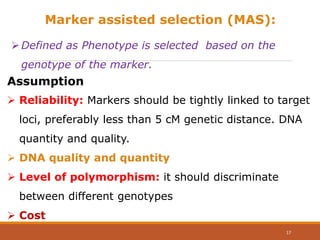
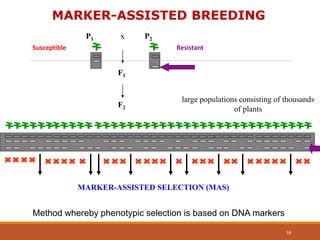
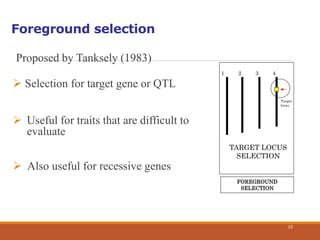
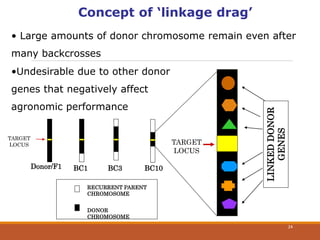
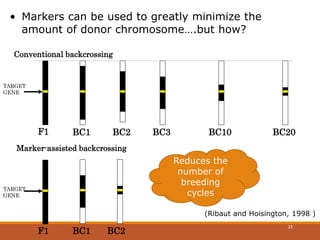
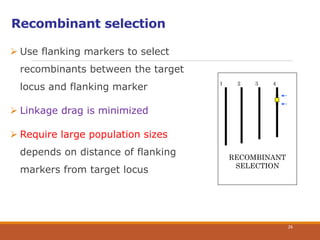
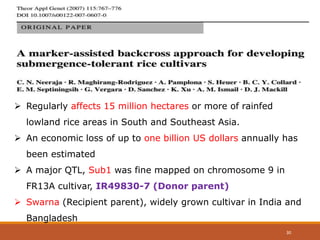
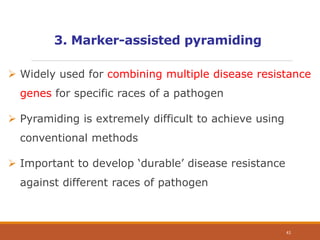
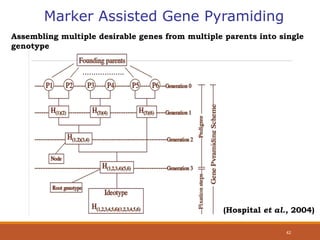

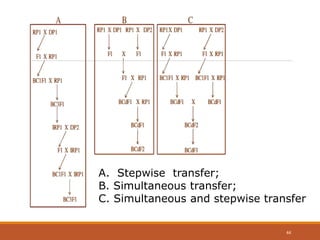
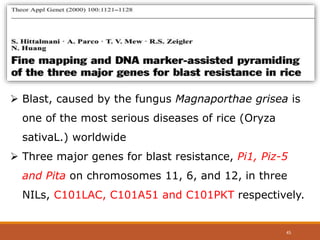
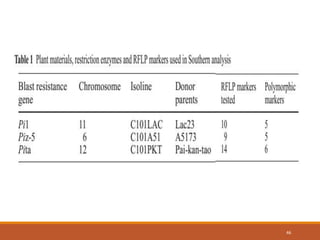
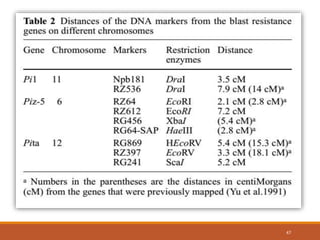
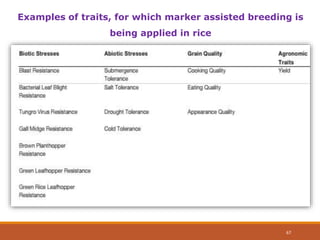


This document discusses the use of marker-assisted selection (MAS) in plant breeding. It begins by outlining some key challenges in plant breeding, then describes how MAS can accelerate the breeding cycle by allowing selection at early generations. It provides details on different types of MAS, including marker-assisted backcrossing, pyramiding of multiple genes, and early generation selection. Examples are given of MAS being used to introgress submergence tolerance and salinity tolerance genes into rice varieties. The document also discusses some reasons for the low impact of MAS to date, such as insufficient linkage between markers and traits.


