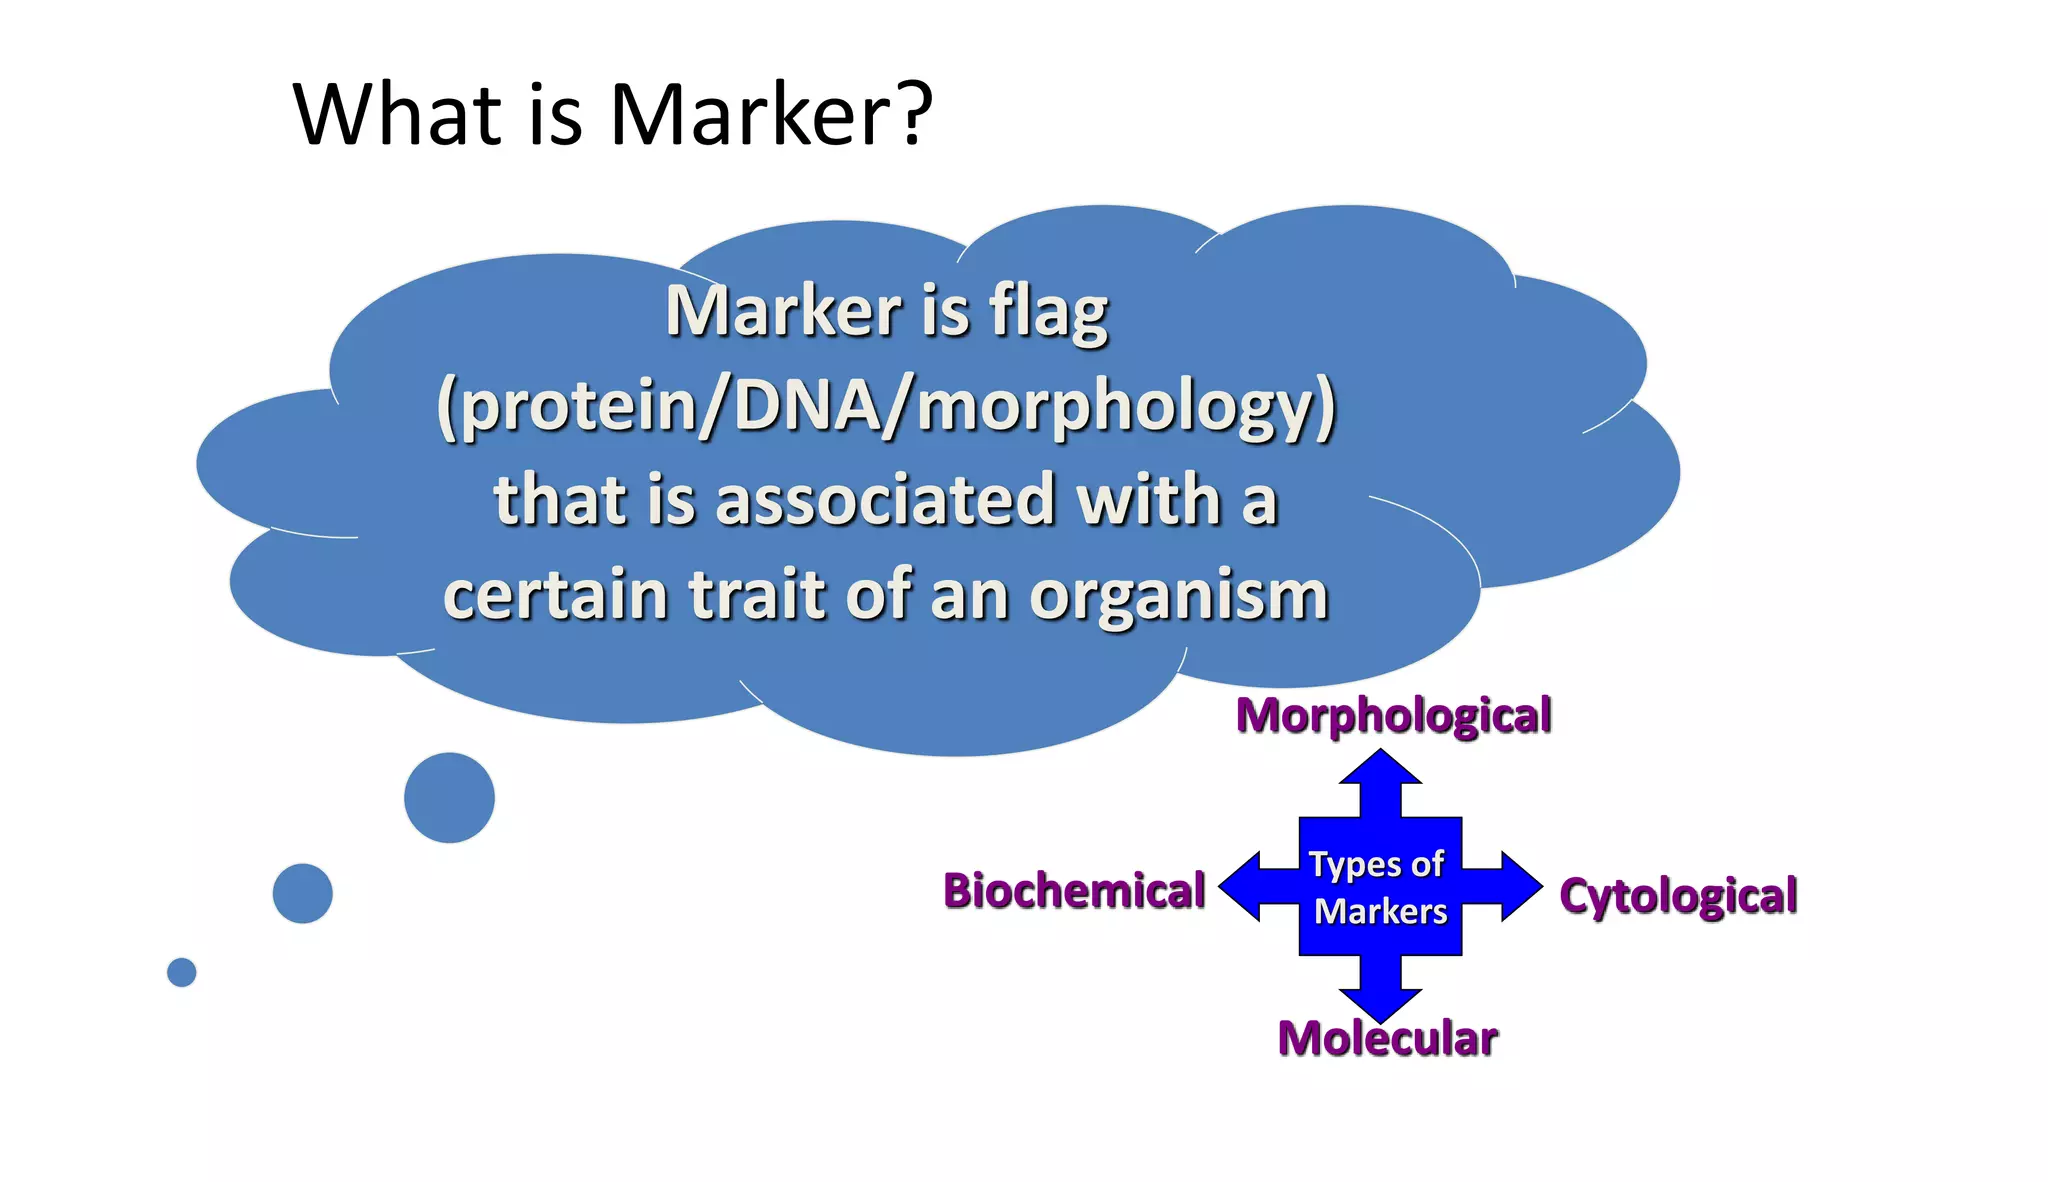
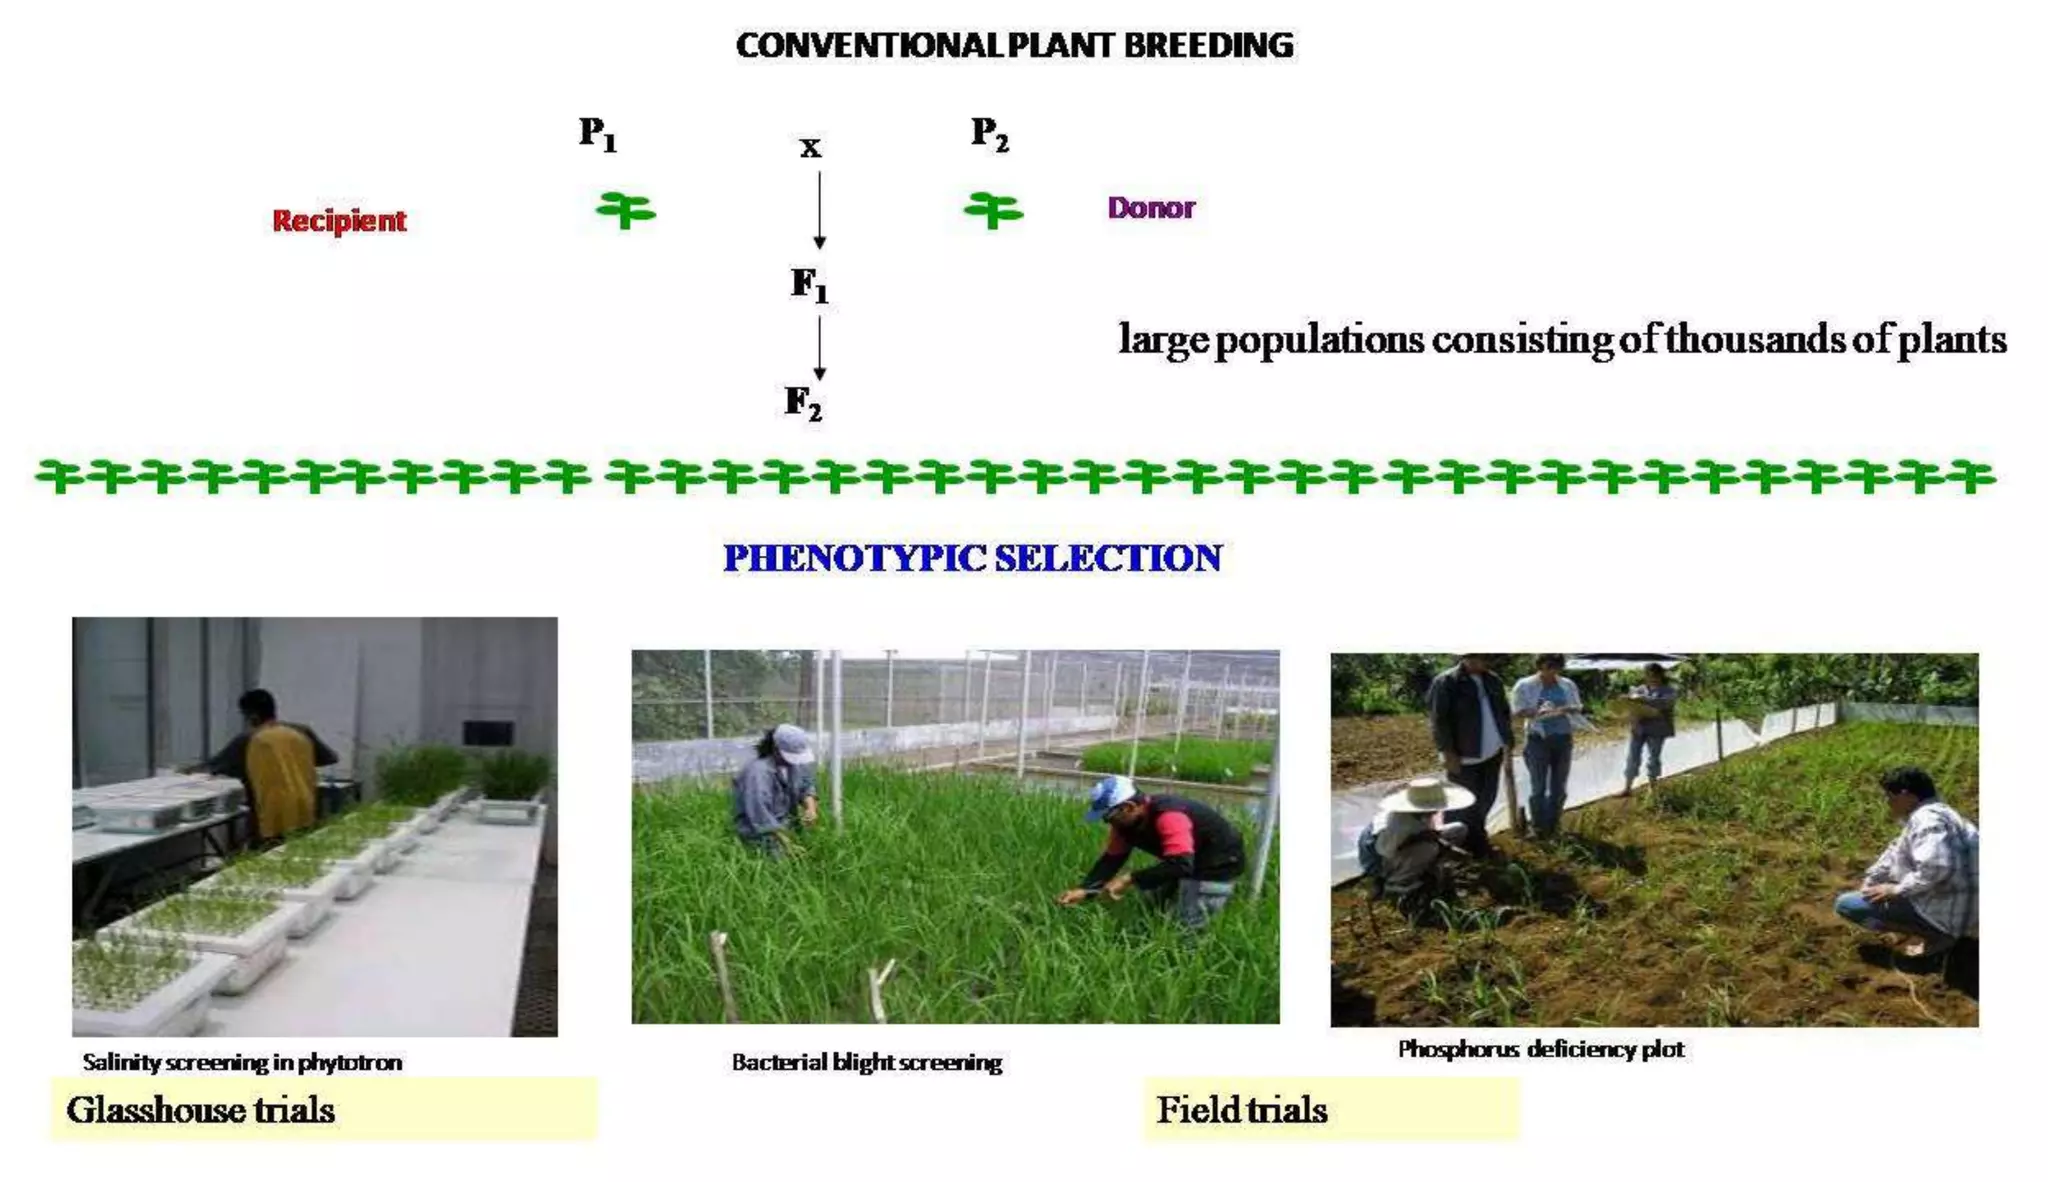
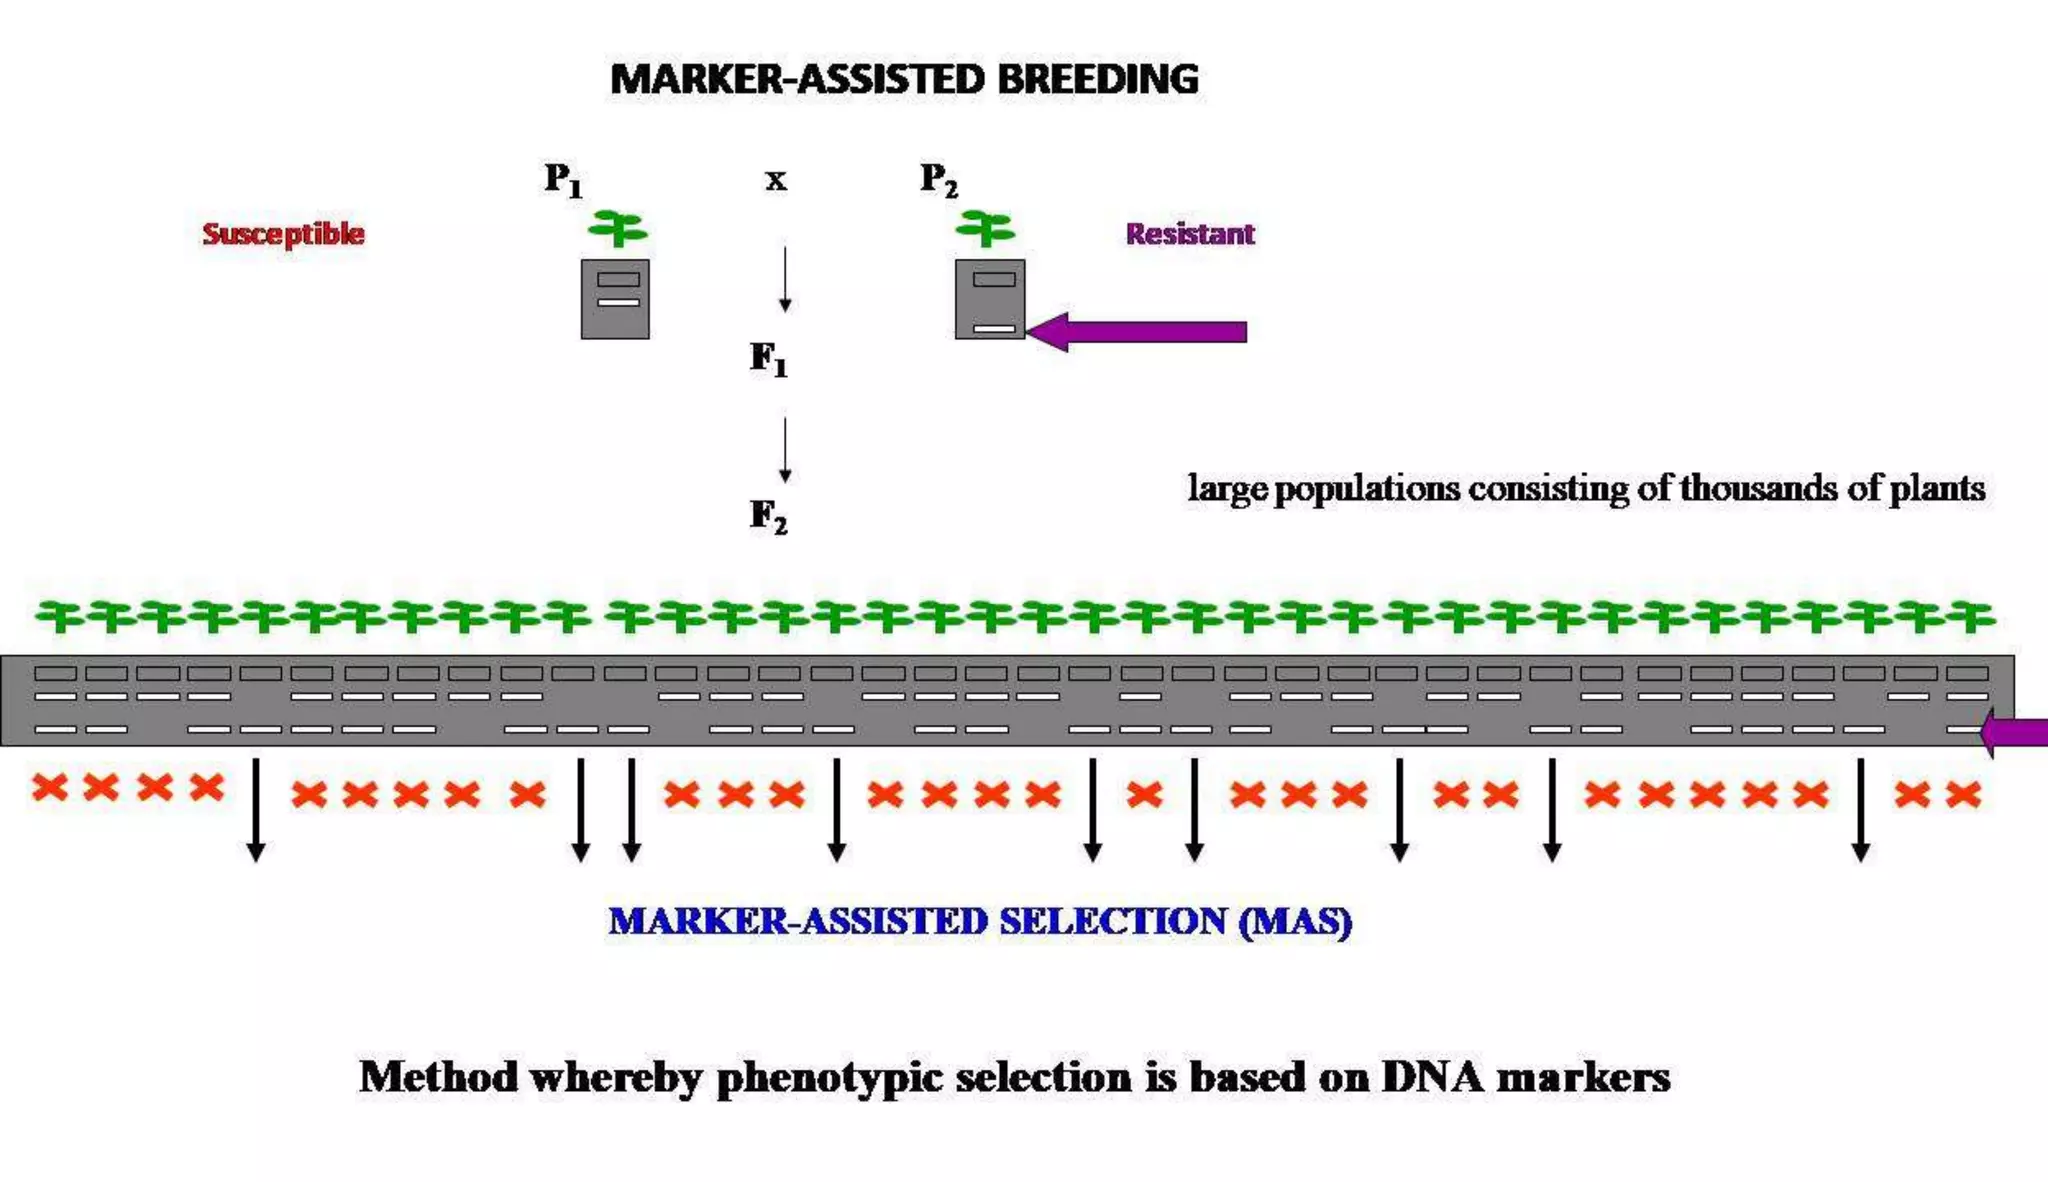
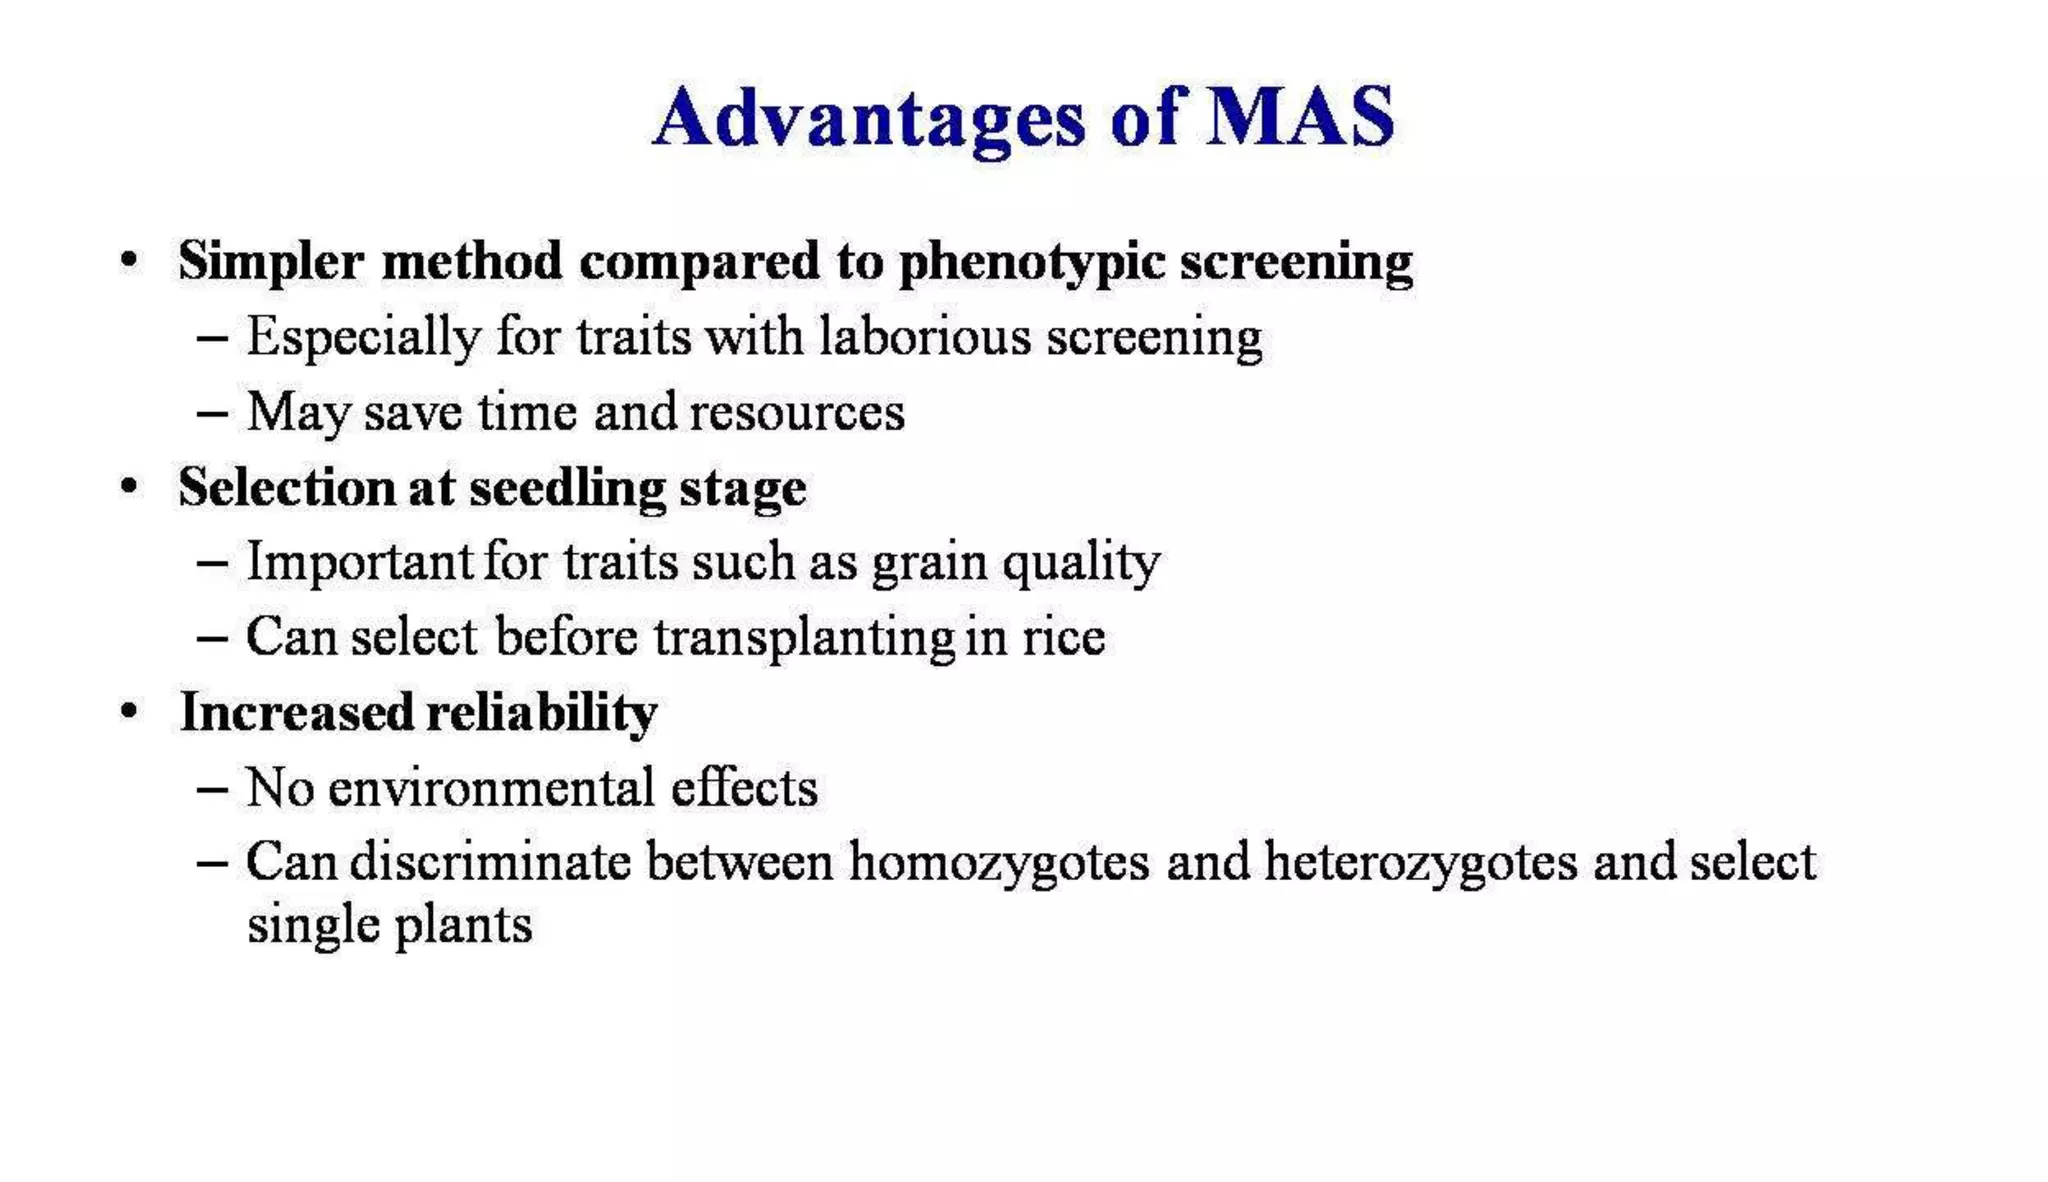
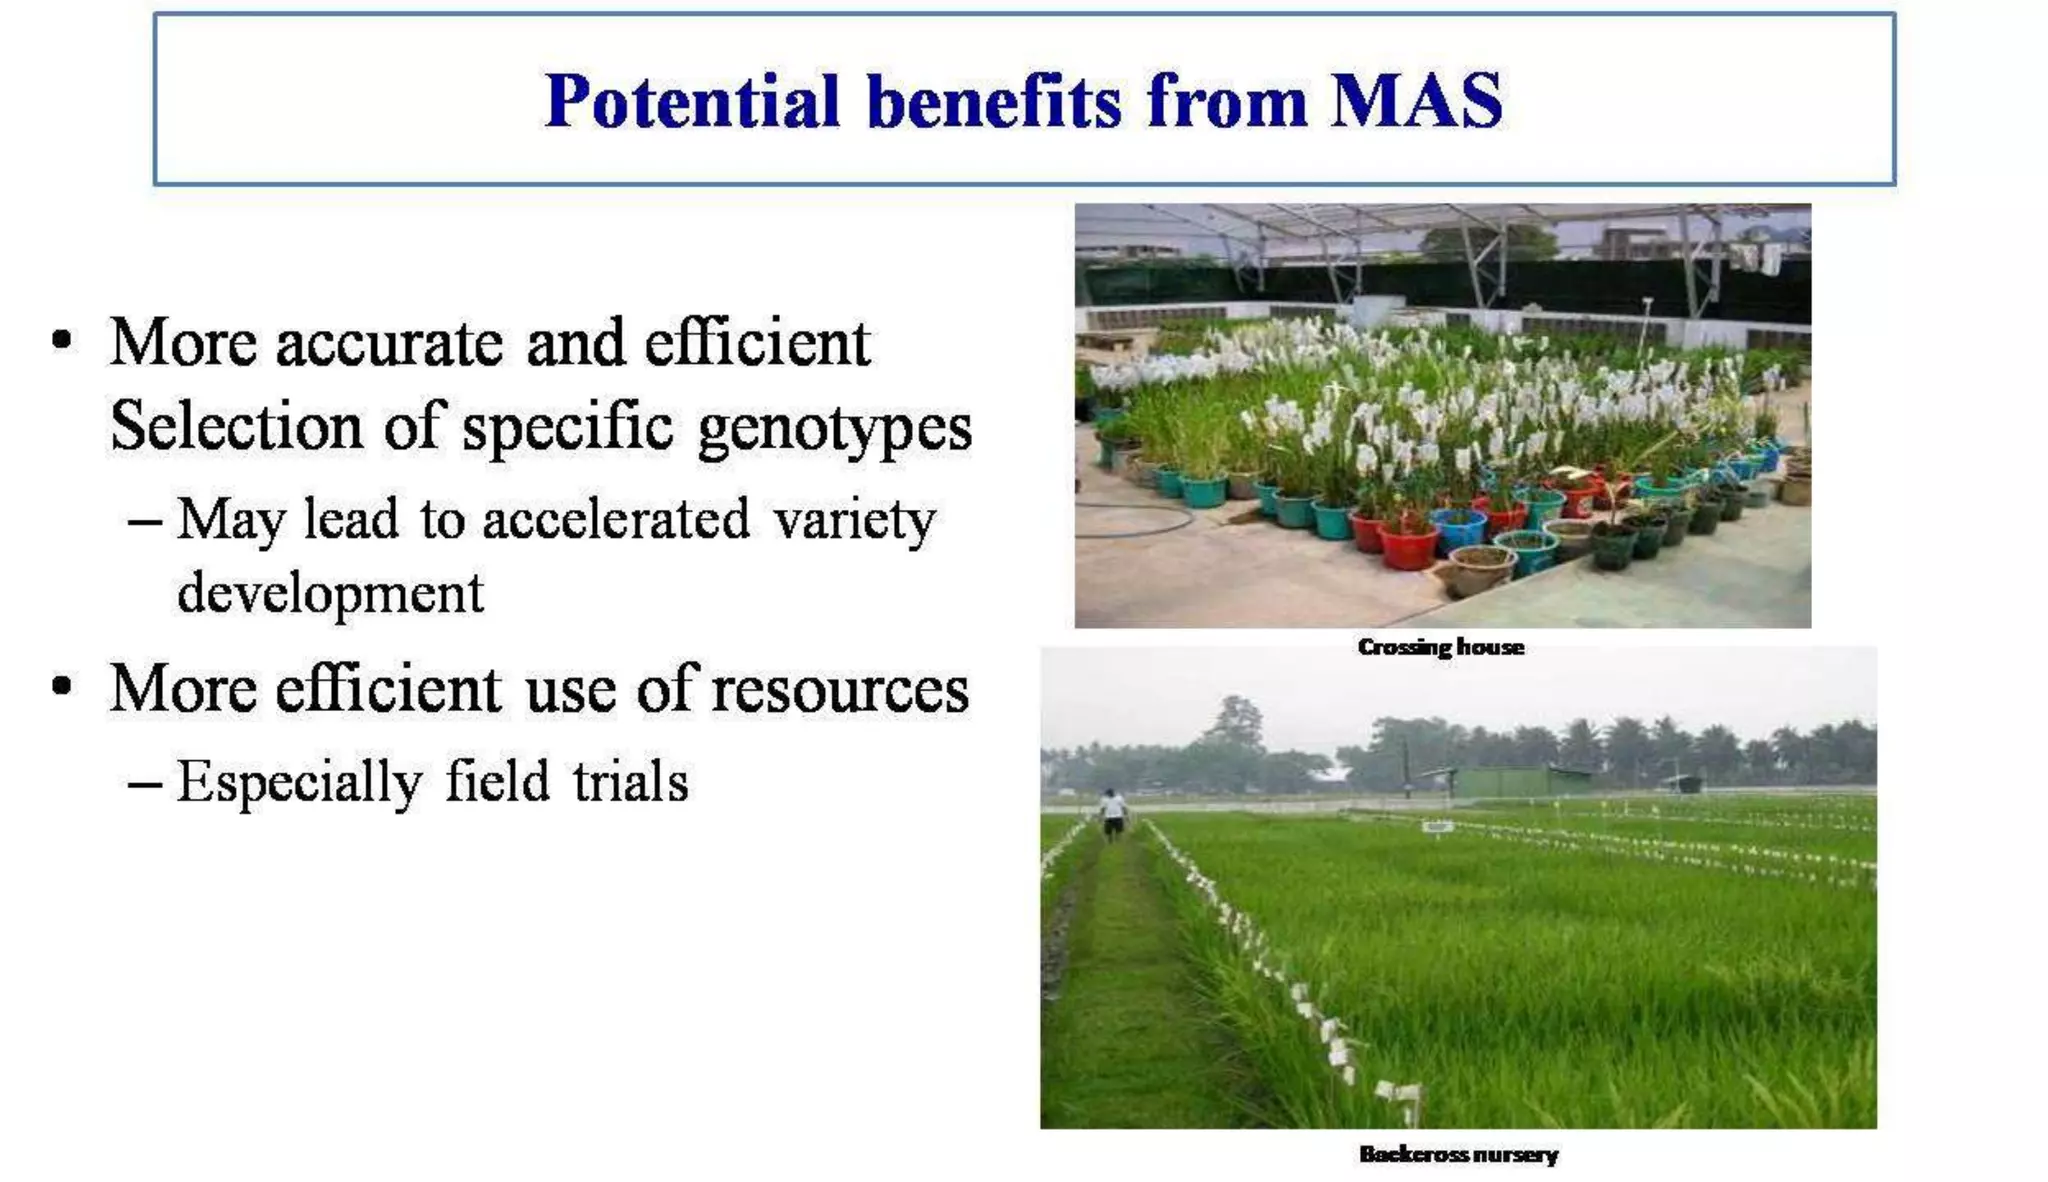
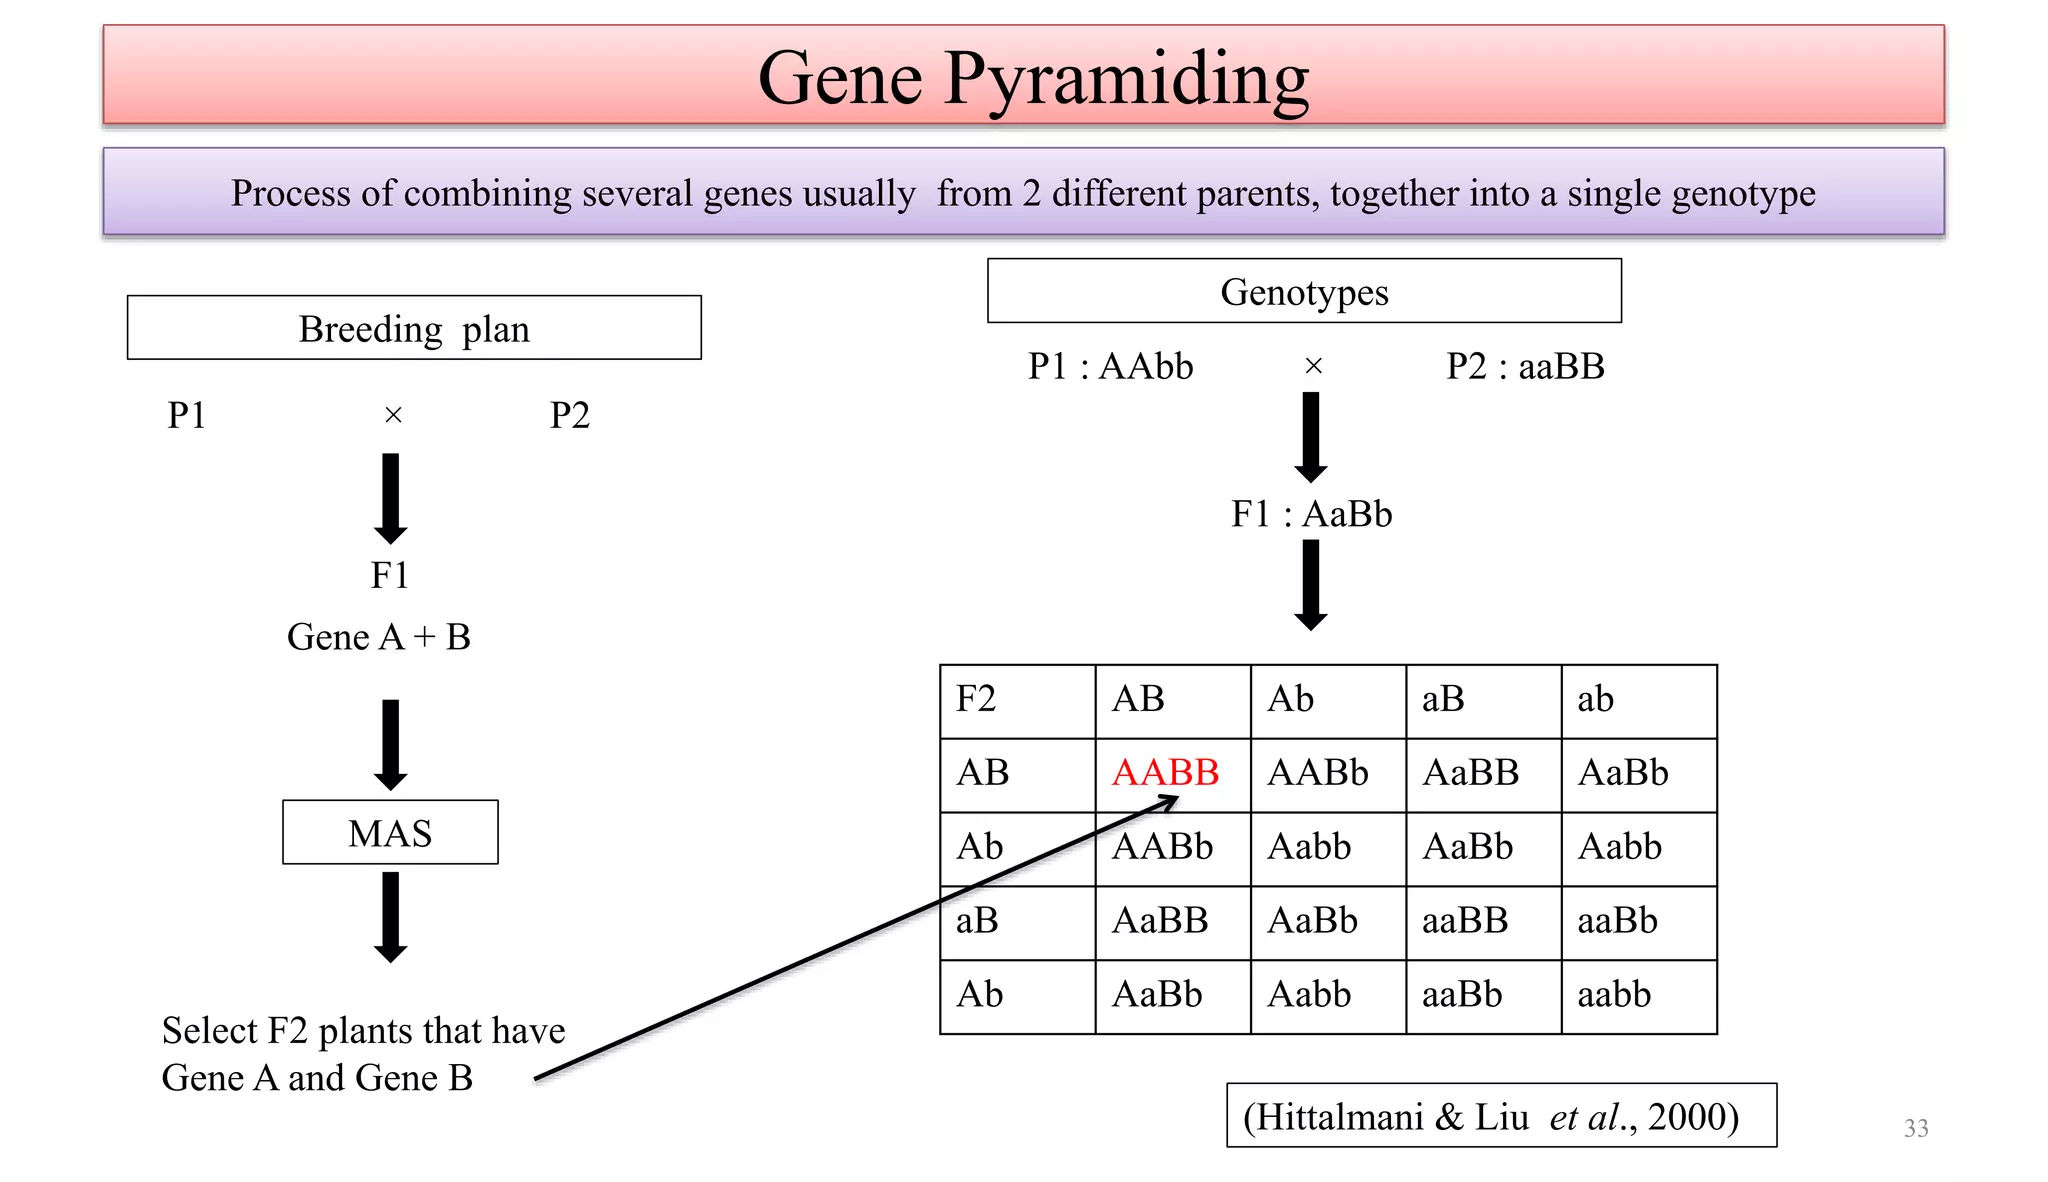
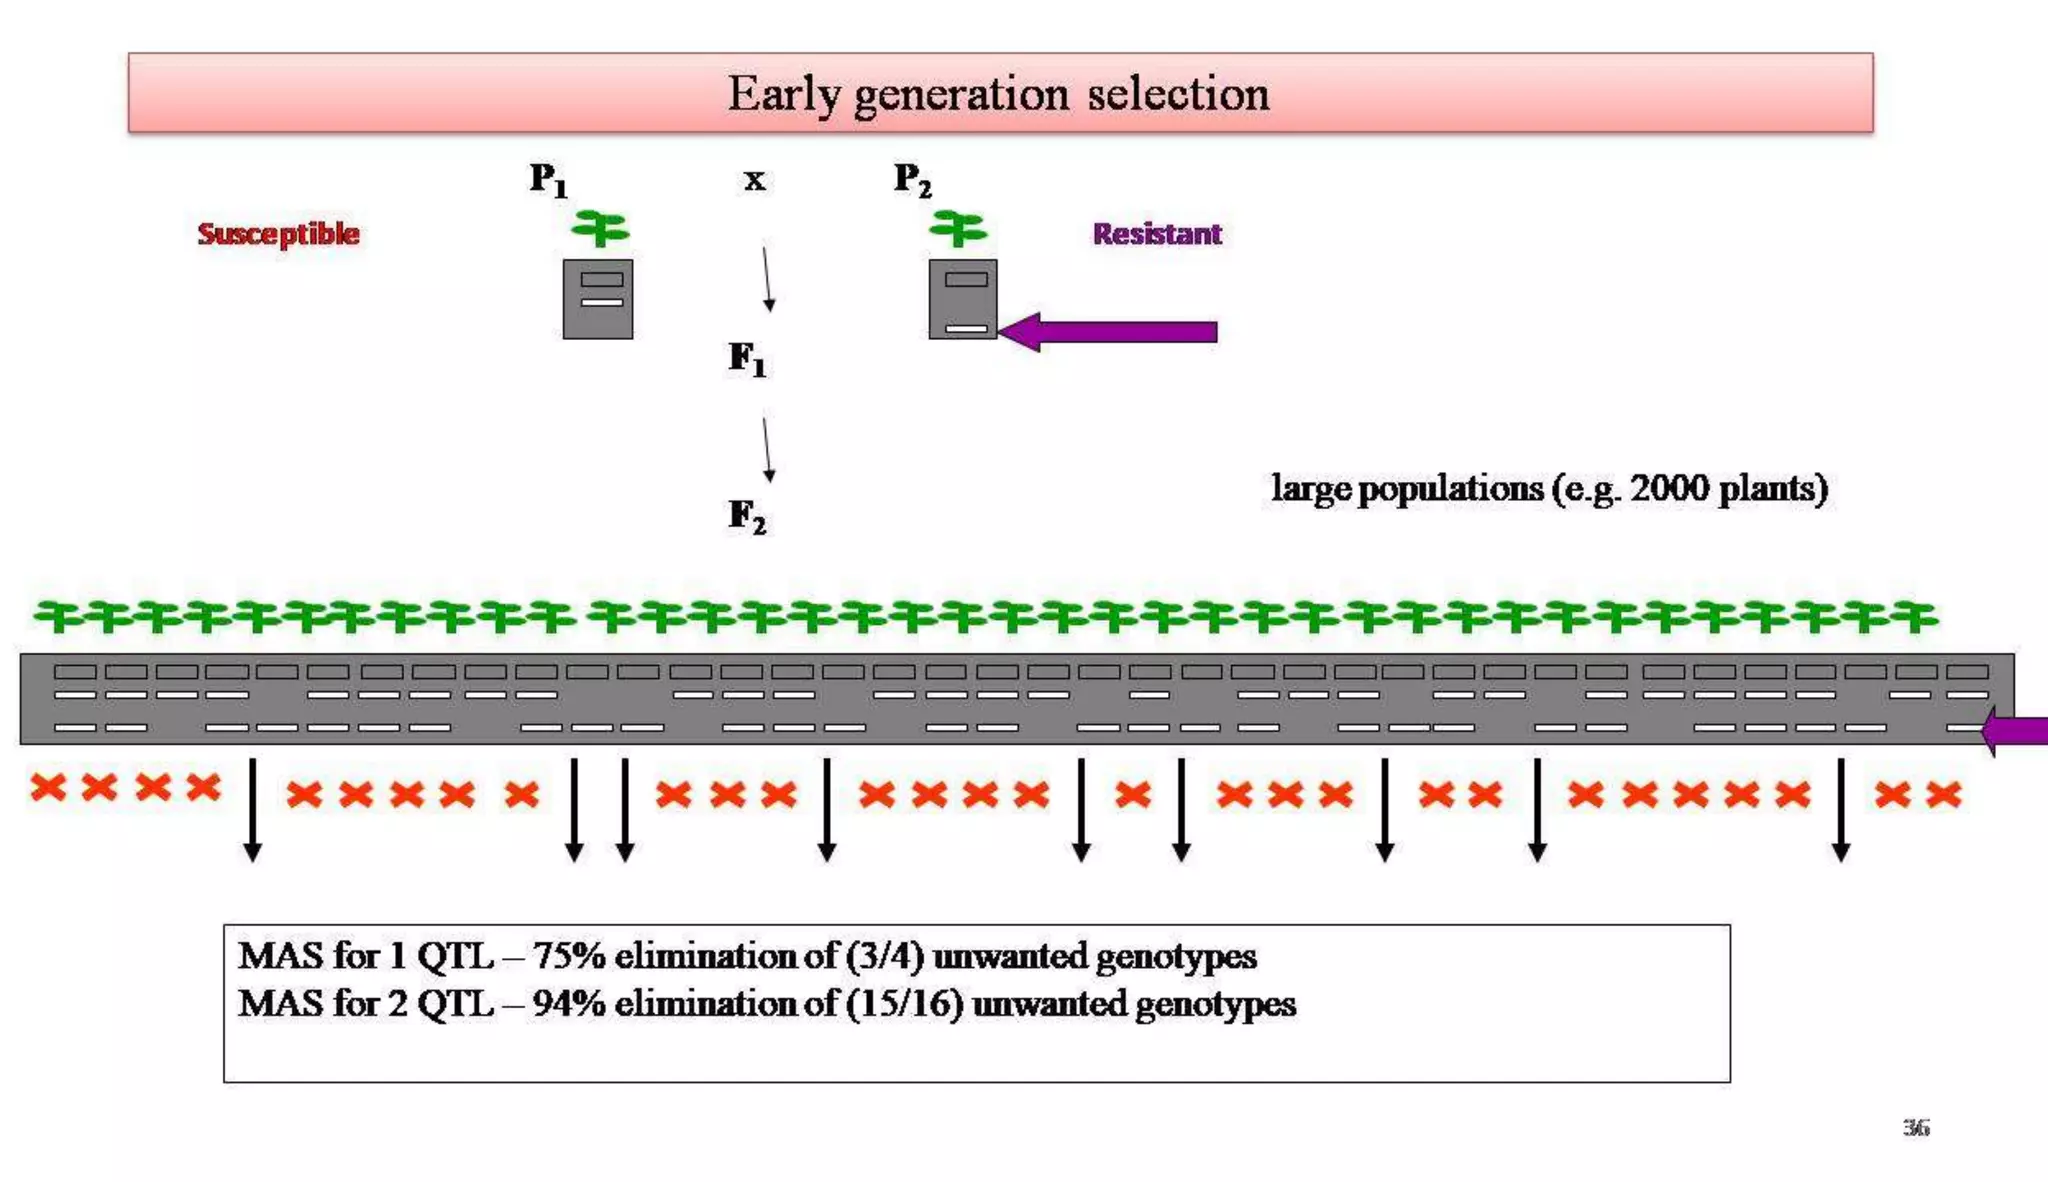
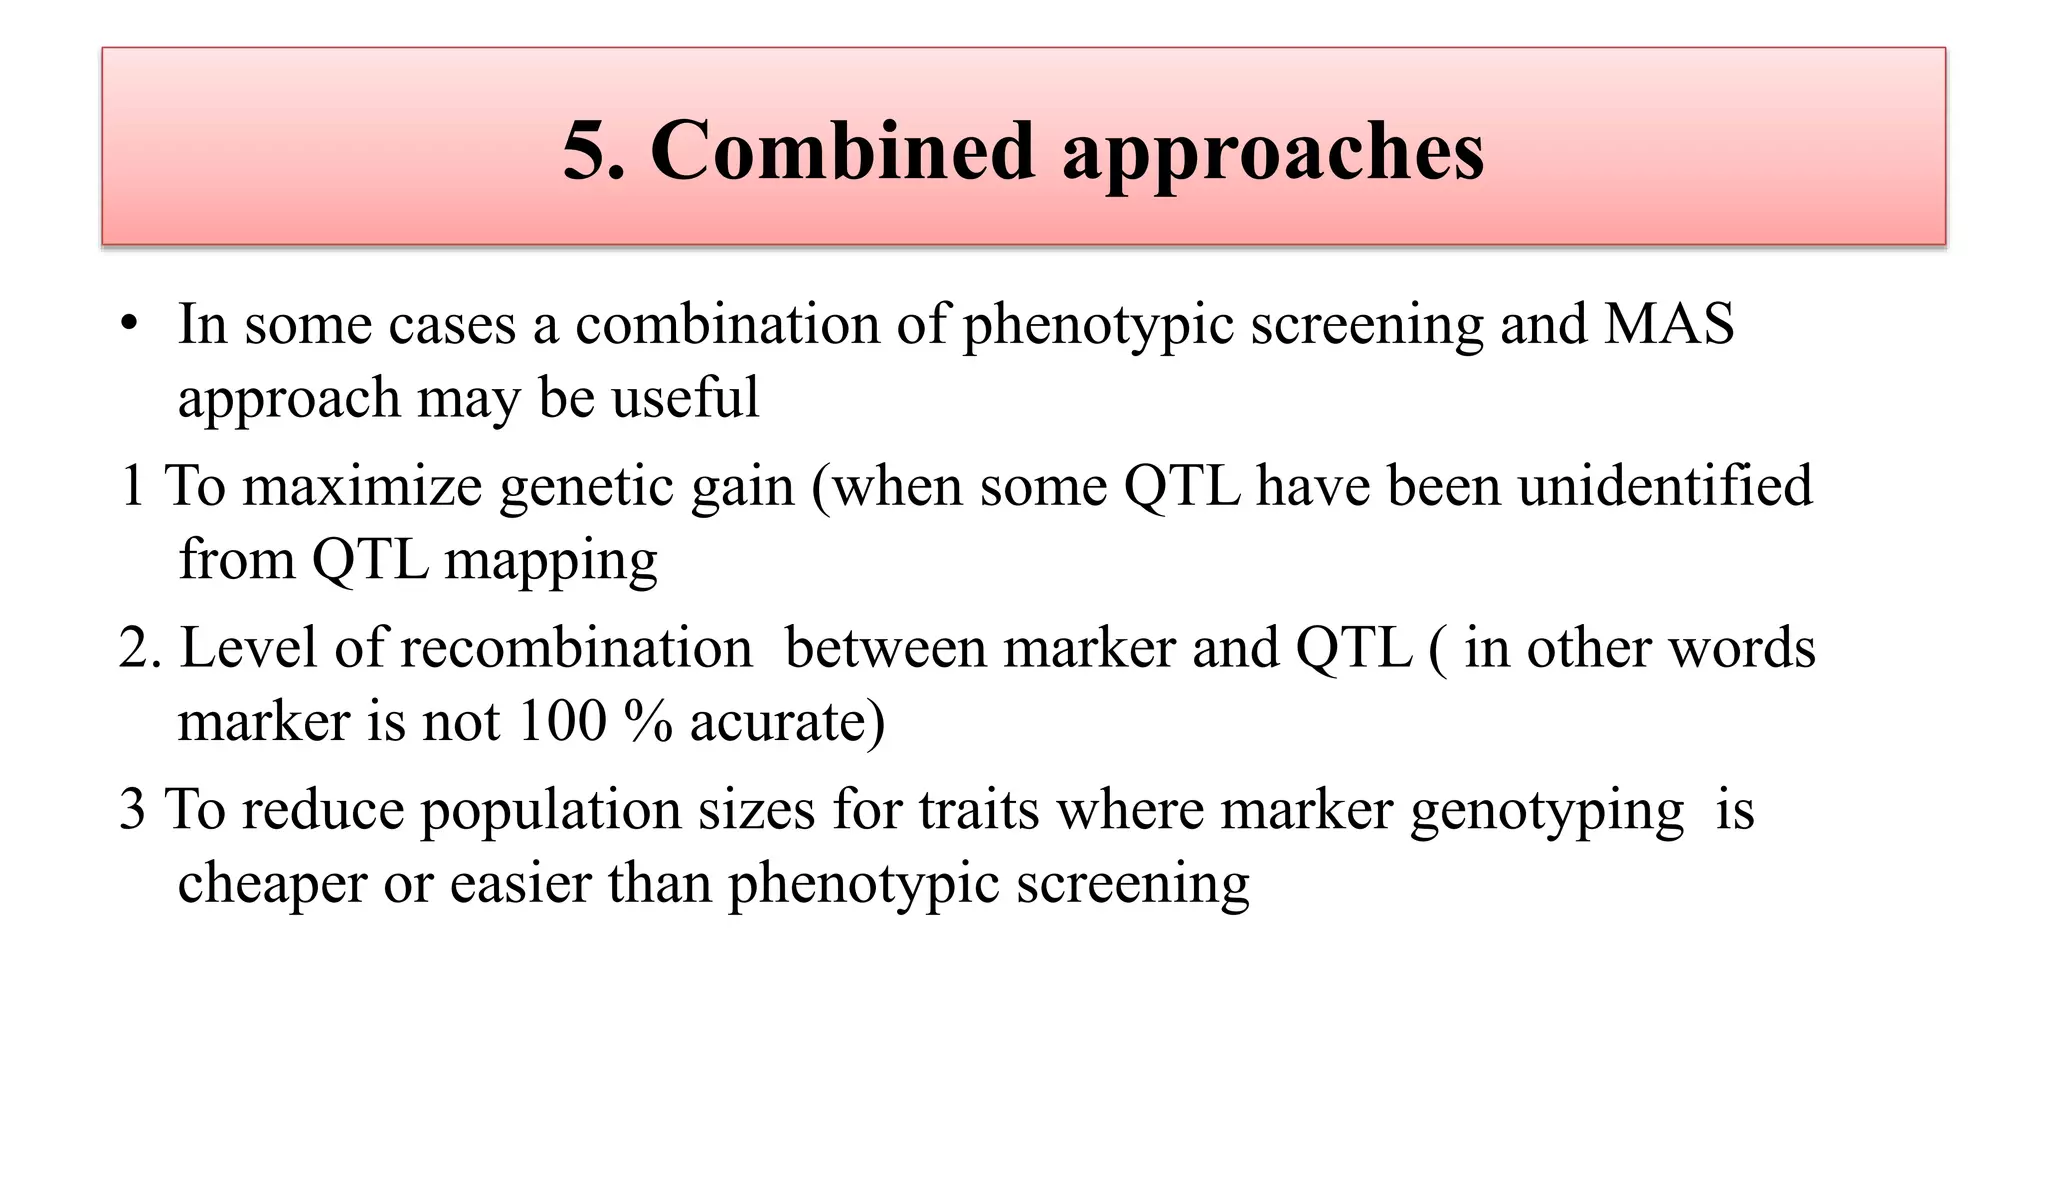
Marker Types,Prerequisites for efficient marker-assisted breeding programmes,Advantages of MAS,Limitations of MAS ,Marker Assisted Breeding Schemes,• 1. Marker- assisted backcrossing,2. Marker- Assisted evaluation of breeding material,3 Gene pyramiding,4. Early generation selection ,Combined approaches,MAB: I level of Selection – FOREGROUND SELECTION,Second level of selection: Recombinant Selection,MAB: III Level of Selection BACKGROUND SELECTION,
Marker Assisted Selection in Crop BreedingPawan Chauhan
Marker Assisted Selection is a value addition to conventional methods of Crop Breeding. It has been gaining importance in plant breeding with new generation of plant breeders and to get accurate and fast desired result from plant breeding.
Marker Assisted Selection in Crop BreedingPawan Chauhan
Marker Assisted Selection is a value addition to conventional methods of Crop Breeding. It has been gaining importance in plant breeding with new generation of plant breeders and to get accurate and fast desired result from plant breeding.
Biotechnology for Crop Improvement.
Molecular Plant Breeding-Marker Assisted Breeding/Selection.
Comparison between three main and commonly discussed marker systems- RFLP, RAPD and AFLP.
Basic Understanding for Simple Sequence Repeats, SCAR and CAPS.
Strategies to overcome food shortages using molecular plant breeding approaches, Application of various molecular marker systems and examples.
Reference List.
Presenter: Brenda Chong
Marker assisted selection is the breeding strategy in which selection for a gene is based on molecular markers closely linked to the gene of interest rather than the gene itself, and the markers are used to monitor the incorporation of the desirable allele from the donor source. Selection of a genotype carrying desirable gene via linked marker (s) is called Marker Assisted Selection. MAS can be applied to possible to use this kind of information.
The prerequisites for the classical procedure of MAS are the tight linkage between molecular marker and gene of interest and high heritability of the gene of interest. It is noteworthy that the “quality” and the number of markers have a major impact on the success of MAS. The quality of markers relates to their characteristics and to the cost and the efficiency of the genotyping process. The number of markers affects the reliability of the linkage between them and the gene(s). In other words, screening a large number of markers has the potential to identify close and reliable linkage between the marker and the gene of interest. MAS has greater potential for efficient gene pyramiding combining several important genes in one cultivar. MAS is gaining considerable importance as it can improve the efficiency of plant breeding through precise transfer of genomic regions of interest and acceleration of the recovery of the recurrent parent genome. Marker-assisted selection is gaining considerable importance as it would improve the efficiency of plant breeding through precise transfer of genomic regions of interest (foreground selection) and accelerating the recovery of the recurrent parent genome (background selection). The use of MAS in crop improvement will not only reduce the cost of developing new varieties but will also increase the precision and efficiency of selection in the breeding program as well as lessen the number of years required to come up with a new crop variety.
Molecular Breeding in Plants is an introduction to the fundamental techniques...UNIVERSITI MALAYSIA SABAH
This slide describe the process of molecular breeding in plants which involves the application of molecular markers for Marker Assisted Selection and Marker Assisted Breeding.
Marker Assisted Gene Pyramiding for Disease Resistance in RiceIndrapratap1
Why marker assisted gene pyramiding?
For traits that are simply inherited, but that are difficult or expensive to measure phenotypically, and/or that do not have a consistent phenotypic expression under specific selection conditions, marker-based selection is more effective than phenotypic selection.
Traits which are traditionally regarded as quantitative and not targeted by gene pyramiding program can be improved using gene pyramiding if major genes affecting the traits are identified.
Genes with very similar phenotypic effects, which are impossible or difficult to combine in single genotype using phenotypic selection, can be pyramided through marker assisted selection.
Markers provides a more effective option to control linkage drag and make the use of genes contained in unadapted resources easier.
Pyramiding is possible through conventional breeding but is extremely difficult or impossible at early generations..
DNA markers may facilitate selection because DNA marker assays are non destructive and markers for multiple specific genes/QTLs can be tested using a single DNA sample without phenotyping.
CONCLUSION:
• Molecular marker offer great scope for improving the efficiency of conventional plant breeding.
• Gene pyramiding may not be the most suitable strategy when many QTL with small effects control the trait and other methods such as marker-assisted recurrent selection should be considered.
• With MAS based gene pyramiding, it is now possible for breeder to conduct many rounds of selections in a year.
• Gene pyramiding with marker technology can integrate into existing plant breeding program all over the world to allow researchers to access, transfer and combine genes at a rate and with precision not previously possible.
• This will help breeders get around problems related to larger breeding populations, replications in diverse environments, and speed up the development of advance lines.
For further queries please contact at isag2010@gmail.com
Introduction:
Proposed by Meuwissen et al. (2001)
GS is a specialized form of MAS, in which information from genotype data on marker alleles covering the entire genome forms the basis of selection.
The effects associated with all the marker loci, irrespective of whether the effects are significant or not, covering the entire genome are estimated.
The marker effect estimates are used to calculate the genomic estimated breeding values (GEBVs) of different individuals/lines, which form the basis of selection.
Why to go for genomic selection:
Marker-assisted selection (MAS) is well-suited for handling oligogenes and quantitative trait loci (QTLs) with large effects but not for minor QTLs.
MARS attempts to take into account small effect QTLs by combining trait phenotype data with marker genotype data into a combined selection index.
Based on markers showing significant association with the trait(s) and for this reason has been criticized as inefficient
The genomic selection (GS) scheme was to rectify the deficiency of MAS and MARS schemes. The GS scheme utilizes information from genome-wide marker data whether or not their associations with the concerned trait(s) are significant.
GEBV: GenomicEstimated Breeding Values-
The sum total of effects associated with all the marker alleles present in the individual and included in the GS model applied to the population under selection
Calculated on a single individual basis
Gene-assisted genomic selection:
A GS model that uses information about prior known QTLs, the targeted QTLs were accumulated in much higher frequencies than when the standard ridge regression was used
The sum total of effects associated with all the marker alleles present in the individual and included in the GS model applied to the population under selection
Calculated on a single individual basis
Population used:
Training population: used for training of the GS model and for obtaining estimates of the marker-associated effects needed for estimation of GEBVs of individuals/lines in the breeding population.
Breeding population: the population subjected to GS for achieving the desired improvement and isolation of superior lines for use as new varieties/parents of new improved hybrids.
Training population-
large enough: must be representative of the breeding population: max. trait variance with marker : by cluster analysis
should have either equal or comparable LD, LD decay rates with breeding populations
Updated by including individuals/lines from the breeding population
Training more than one generation
Low colinearity between markers is needed since high colinearity tends to reduce prediction accuracy of certain GS models. (colinearity disturbed by recombination)
The term balanced tertiary trisomic has three words of which (1) “trisomic” indicates the presence of extra chromosome, (2) “tertiary” indicates that the extra chromosome is a trans-located chromosome, and (3) “balanced” refers to the breeding behaviour of the trisomic.
Ramage defined the BTT as a tertiary trisomic constructed in such a way that the dominant allele of a marker gene, closely linked with the translocation breakpoint of the extra chromosome is carried on the extra chromosome, and the recessive allele is carried on the two normal chromosomes that constitute the diploid complement. The dominant marker gene may be located on the centromere segment or the trans-located segment of the extra chromosome.
Stability analysis and G*E interactions in plantsRachana Bagudam
Gene–environment interaction is when two different genotypes respond to environmental variation in different ways. Stability refers to the performance with respective to environmental factors overtime within given location. Selection for stability is not possible until a biometrical model with suitable parameters is available to provide criteria necessary to rank varieties / breeds for stability. Different models of stability are discussed.
Quantitative trait loci (QTL) analysis and its applications in plant breedingPGS
Abstract
Many agriculturally important traits such as grain yield, protein content and relative disease resistance are controlled by many genes and are known as quantitative traits (also polygenic or complex traits). A quantitative trait depends on the cumulative actions of many genes and the environment. The genomic regions that contain genes associated with a quantitative trait are known as quantitative trait loci (QTLs). Thus, a QTL could be defined as a genomic region responsible for a part of the observed phenotypic variation for a quantitative trait. A QTL can be a single gene or a cluster of linked genes that affect the trait. The effects of individual QTLs may differ from each other and change from environment to environment. The genetics of a quantitative trait can often be deduced from the statistical analysis of several segregating populations. Recently, by using molecular markers, it is feasible to analyze quantitative traits and identify individual QTLs or genes controlling the traits of interest in breeding programs.
QTL is a gene or the chromosomal region that affects a quantitative trait, which should be polymorphic (have allelic variation) to have an effect in a population, must be linked to a polymorphic marker allele to be detected. The QTL mapping consists of 4 steps, like the development of mapping population, generation of polymorphic marker data set among the parents, construction of linkage map, and finally the QTL analysis
All the above steps are described in these slides very briefly along with two case studies.
Introduction
Backcross breeding & its types
Marker assisted breeding
Marker assisted backcross breeding (MABC)
Main strategies
Advantages over conventional breeding
Case studies
Future outlook
Conclusion
Process whereby a marker is used for indirect selection of a genetic determinant or determinants of a trait of interest (i.e. productivity, disease resistance, abiotic stress tolerance, and/or quality).
Trait of interest is selected not based on the trait itself but on a marker linked to it.
The assumption is that linked allele associates with the gene and/or quantitative trait locus (QTL) of interest. MAS can be useful for traits that are difficult to measure, exhibit low heritability, and/or are expressed late in development.
Pre-Requisites: Two pre-requisites for marker assisted selection are: (i) a tight linkage between molecular marker and gene of interest, and (ii) high heritability of the gene of interest.
Markers Used: The most commonly used molecular markers include amplified fragment length polymorphisms (AFLP), restriction fragment length polymorphisms (RFLP), random amplified polymorphic DNA (RAPD), simple sequence repeats (SSR) or micro satellites, single nucleotide polymorphisms (SNP), etc. The use of molecular markers differs from species to species also.
THE IMPORTANCE OF MARTIAN ATMOSPHERE SAMPLE RETURN.Sérgio Sacani
The return of a sample of near-surface atmosphere from Mars would facilitate answers to several first-order science questions surrounding the formation and evolution of the planet. One of the important aspects of terrestrial planet formation in general is the role that primary atmospheres played in influencing the chemistry and structure of the planets and their antecedents. Studies of the martian atmosphere can be used to investigate the role of a primary atmosphere in its history. Atmosphere samples would also inform our understanding of the near-surface chemistry of the planet, and ultimately the prospects for life. High-precision isotopic analyses of constituent gases are needed to address these questions, requiring that the analyses are made on returned samples rather than in situ.
Multi-source connectivity as the driver of solar wind variability in the heli...Sérgio Sacani
The ambient solar wind that flls the heliosphere originates from multiple
sources in the solar corona and is highly structured. It is often described
as high-speed, relatively homogeneous, plasma streams from coronal
holes and slow-speed, highly variable, streams whose source regions are
under debate. A key goal of ESA/NASA’s Solar Orbiter mission is to identify
solar wind sources and understand what drives the complexity seen in the
heliosphere. By combining magnetic feld modelling and spectroscopic
techniques with high-resolution observations and measurements, we show
that the solar wind variability detected in situ by Solar Orbiter in March
2022 is driven by spatio-temporal changes in the magnetic connectivity to
multiple sources in the solar atmosphere. The magnetic feld footpoints
connected to the spacecraft moved from the boundaries of a coronal hole
to one active region (12961) and then across to another region (12957). This
is refected in the in situ measurements, which show the transition from fast
to highly Alfvénic then to slow solar wind that is disrupted by the arrival of
a coronal mass ejection. Our results describe solar wind variability at 0.5 au
but are applicable to near-Earth observatories.
Professional air quality monitoring systems provide immediate, on-site data for analysis, compliance, and decision-making.
Monitor common gases, weather parameters, particulates.
This presentation explores a brief idea about the structural and functional attributes of nucleotides, the structure and function of genetic materials along with the impact of UV rays and pH upon them.
Earliest Galaxies in the JADES Origins Field: Luminosity Function and Cosmic ...Sérgio Sacani
We characterize the earliest galaxy population in the JADES Origins Field (JOF), the deepest
imaging field observed with JWST. We make use of the ancillary Hubble optical images (5 filters
spanning 0.4−0.9µm) and novel JWST images with 14 filters spanning 0.8−5µm, including 7 mediumband filters, and reaching total exposure times of up to 46 hours per filter. We combine all our data
at > 2.3µm to construct an ultradeep image, reaching as deep as ≈ 31.4 AB mag in the stack and
30.3-31.0 AB mag (5σ, r = 0.1” circular aperture) in individual filters. We measure photometric
redshifts and use robust selection criteria to identify a sample of eight galaxy candidates at redshifts
z = 11.5 − 15. These objects show compact half-light radii of R1/2 ∼ 50 − 200pc, stellar masses of
M⋆ ∼ 107−108M⊙, and star-formation rates of SFR ∼ 0.1−1 M⊙ yr−1
. Our search finds no candidates
at 15 < z < 20, placing upper limits at these redshifts. We develop a forward modeling approach to
infer the properties of the evolving luminosity function without binning in redshift or luminosity that
marginalizes over the photometric redshift uncertainty of our candidate galaxies and incorporates the
impact of non-detections. We find a z = 12 luminosity function in good agreement with prior results,
and that the luminosity function normalization and UV luminosity density decline by a factor of ∼ 2.5
from z = 12 to z = 14. We discuss the possible implications of our results in the context of theoretical
models for evolution of the dark matter halo mass function.
What is greenhouse gasses and how many gasses are there to affect the Earth.moosaasad1975
What are greenhouse gasses how they affect the earth and its environment what is the future of the environment and earth how the weather and the climate effects.
Introduction:
RNA interference (RNAi) or Post-Transcriptional Gene Silencing (PTGS) is an important biological process for modulating eukaryotic gene expression.
It is highly conserved process of posttranscriptional gene silencing by which double stranded RNA (dsRNA) causes sequence-specific degradation of mRNA sequences.
dsRNA-induced gene silencing (RNAi) is reported in a wide range of eukaryotes ranging from worms, insects, mammals and plants.
This process mediates resistance to both endogenous parasitic and exogenous pathogenic nucleic acids, and regulates the expression of protein-coding genes.
What are small ncRNAs?
micro RNA (miRNA)
short interfering RNA (siRNA)
Properties of small non-coding RNA:
Involved in silencing mRNA transcripts.
Called “small” because they are usually only about 21-24 nucleotides long.
Synthesized by first cutting up longer precursor sequences (like the 61nt one that Lee discovered).
Silence an mRNA by base pairing with some sequence on the mRNA.
Discovery of siRNA?
The first small RNA:
In 1993 Rosalind Lee (Victor Ambros lab) was studying a non- coding gene in C. elegans, lin-4, that was involved in silencing of another gene, lin-14, at the appropriate time in the
development of the worm C. elegans.
Two small transcripts of lin-4 (22nt and 61nt) were found to be complementary to a sequence in the 3' UTR of lin-14.
Because lin-4 encoded no protein, she deduced that it must be these transcripts that are causing the silencing by RNA-RNA interactions.
Types of RNAi ( non coding RNA)
MiRNA
Length (23-25 nt)
Trans acting
Binds with target MRNA in mismatch
Translation inhibition
Si RNA
Length 21 nt.
Cis acting
Bind with target Mrna in perfect complementary sequence
Piwi-RNA
Length ; 25 to 36 nt.
Expressed in Germ Cells
Regulates trnasposomes activity
MECHANISM OF RNAI:
First the double-stranded RNA teams up with a protein complex named Dicer, which cuts the long RNA into short pieces.
Then another protein complex called RISC (RNA-induced silencing complex) discards one of the two RNA strands.
The RISC-docked, single-stranded RNA then pairs with the homologous mRNA and destroys it.
THE RISC COMPLEX:
RISC is large(>500kD) RNA multi- protein Binding complex which triggers MRNA degradation in response to MRNA
Unwinding of double stranded Si RNA by ATP independent Helicase
Active component of RISC is Ago proteins( ENDONUCLEASE) which cleave target MRNA.
DICER: endonuclease (RNase Family III)
Argonaute: Central Component of the RNA-Induced Silencing Complex (RISC)
One strand of the dsRNA produced by Dicer is retained in the RISC complex in association with Argonaute
ARGONAUTE PROTEIN :
1.PAZ(PIWI/Argonaute/ Zwille)- Recognition of target MRNA
2.PIWI (p-element induced wimpy Testis)- breaks Phosphodiester bond of mRNA.)RNAse H activity.
MiRNA:
The Double-stranded RNAs are naturally produced in eukaryotic cells during development, and they have a key role in regulating gene expression .
Cancer cell metabolism: special Reference to Lactate PathwayAADYARAJPANDEY1
Normal Cell Metabolism:
Cellular respiration describes the series of steps that cells use to break down sugar and other chemicals to get the energy we need to function.
Energy is stored in the bonds of glucose and when glucose is broken down, much of that energy is released.
Cell utilize energy in the form of ATP.
The first step of respiration is called glycolysis. In a series of steps, glycolysis breaks glucose into two smaller molecules - a chemical called pyruvate. A small amount of ATP is formed during this process.
Most healthy cells continue the breakdown in a second process, called the Kreb's cycle. The Kreb's cycle allows cells to “burn” the pyruvates made in glycolysis to get more ATP.
The last step in the breakdown of glucose is called oxidative phosphorylation (Ox-Phos).
It takes place in specialized cell structures called mitochondria. This process produces a large amount of ATP. Importantly, cells need oxygen to complete oxidative phosphorylation.
If a cell completes only glycolysis, only 2 molecules of ATP are made per glucose. However, if the cell completes the entire respiration process (glycolysis - Kreb's - oxidative phosphorylation), about 36 molecules of ATP are created, giving it much more energy to use.
IN CANCER CELL:
Unlike healthy cells that "burn" the entire molecule of sugar to capture a large amount of energy as ATP, cancer cells are wasteful.
Cancer cells only partially break down sugar molecules. They overuse the first step of respiration, glycolysis. They frequently do not complete the second step, oxidative phosphorylation.
This results in only 2 molecules of ATP per each glucose molecule instead of the 36 or so ATPs healthy cells gain. As a result, cancer cells need to use a lot more sugar molecules to get enough energy to survive.
introduction to WARBERG PHENOMENA:
WARBURG EFFECT Usually, cancer cells are highly glycolytic (glucose addiction) and take up more glucose than do normal cells from outside.
Otto Heinrich Warburg (; 8 October 1883 – 1 August 1970) In 1931 was awarded the Nobel Prize in Physiology for his "discovery of the nature and mode of action of the respiratory enzyme.
WARNBURG EFFECT : cancer cells under aerobic (well-oxygenated) conditions to metabolize glucose to lactate (aerobic glycolysis) is known as the Warburg effect. Warburg made the observation that tumor slices consume glucose and secrete lactate at a higher rate than normal tissues.
(May 29th, 2024) Advancements in Intravital Microscopy- Insights for Preclini...Scintica Instrumentation
Intravital microscopy (IVM) is a powerful tool utilized to study cellular behavior over time and space in vivo. Much of our understanding of cell biology has been accomplished using various in vitro and ex vivo methods; however, these studies do not necessarily reflect the natural dynamics of biological processes. Unlike traditional cell culture or fixed tissue imaging, IVM allows for the ultra-fast high-resolution imaging of cellular processes over time and space and were studied in its natural environment. Real-time visualization of biological processes in the context of an intact organism helps maintain physiological relevance and provide insights into the progression of disease, response to treatments or developmental processes.
In this webinar we give an overview of advanced applications of the IVM system in preclinical research. IVIM technology is a provider of all-in-one intravital microscopy systems and solutions optimized for in vivo imaging of live animal models at sub-micron resolution. The system’s unique features and user-friendly software enables researchers to probe fast dynamic biological processes such as immune cell tracking, cell-cell interaction as well as vascularization and tumor metastasis with exceptional detail. This webinar will also give an overview of IVM being utilized in drug development, offering a view into the intricate interaction between drugs/nanoparticles and tissues in vivo and allows for the evaluation of therapeutic intervention in a variety of tissues and organs. This interdisciplinary collaboration continues to drive the advancements of novel therapeutic strategies.
(May 29th, 2024) Advancements in Intravital Microscopy- Insights for Preclini...
Marker assisted selection( mas) and its application in plant breeding
1. Marker Assisted Selection and its application in
Plant breeding
Submitted to-
Dr. P.T.Patel/Mr. Kiran Kugashiya
Asso. Professor/Asstt. Professor
Seed Technology unit, SDAU.
Submitted by-
Hemantkumar S. Sonawane
Reg. No. 04-AGRPH-01857-2018 Ph. D.II yr
Department of Genetics and Plant Breeding
C. P. College of Agriculture, SDAU.
Course Name: GP 602:Advanced Biometrical and Quantitative Techniques
2. Marker Assisted Selection (MAS)
• Marker assisted selection (MAS) is indirect selection for a
gene /QTL based on molecular markers closely linked to the
gene /QTL
• A tool that can help plant breeders to select more efficiently
for desirable crop traits
• Molecular markers can also be used for negative selection
for elimination of undesirable genes, from segregating
population
3. Marker Assisted Selection
• Breeding for specific trait in plants is expensive & time consuming
• The first goal of MAS is to reduce the time needed to determine if
the progeny have the trait.
• The second goal is to reduce cost associated with screening for
traits
• If we can detect the distinguishing trait at the DNA level we can
identify positive selection very early.
4. What is Marker?
Marker is flag
(protein/DNA/morphology)
that is associated with a
certain trait of an organism
Morphological
Biochemical
Molecular
Cytological
Types of
Markers
5. Marker types
• Morphological markers : markers are often detected by eye , by
simple visual inspection. Example Leaf sheath coloration , height,
grain color, aroma of rice etc.
• Biochemical markers : A protein that can be extracted and observed .
eg. Isozymes & storage protein
• Cytological markers : The chromosomal banding produced by
different stains, for example G banding
• DNA based or Molecular markers : A unique gene( DNA),
occurring in proximity to the gene or locus of interest, can be identified
by a range of molecular techniques such as RFLP, RAPD, SCAR,
microsatellite or SNP detection
6. TYPES OF MOLECULER MARKERS
1. Morphological
2. Biochemical
Classic Marker DNA Marker
6
DNA Marker
A. CODOMINANT MARKERS
e.g. SSR , RFLP , Allozymes
B. DOMINANT MARKERS
e.g. RAPD , AFLP , SCAR
RFLP - Restriction Fragment Length Polymorphism
RAPD - Randomly Amplified Polymorphic DNA
AFLP - Amplification Fragment Length
Polymorphism
VNTR – Variable Number Tandem Repeat
SSR - Simple Sequence Repeats (microsatellites)
SNP - Single Nucleotide Polymorphism
SCAR - Sequence Characterized Amplified Regions
OP - Oligonucleotide Polymorphism
ASAP – Allele Specific Associated Primers
ISTR – Inverse Sequence-tagged Repeats
IRAP – Inter-retrotransposon Amplified
Polymorphism
TWO TYPES OF
MARKER
1. Non PCR
based
2. PCR based
7.
8. Prerequisites for efficient marker-assisted breeding
programmes
• Appropriate marker system and reliable marker: For a plant species or crop,
a suitable marker system and reliable markers available are critically important to
initiate a marker- assisted breeding program. Suitable marker should have
following attributes :
• Ease and low –cost of use and analysis
• Small amount of DNA required
• Co-Dominance
• Repeatability/reproducibility of results
• High level of polymorphism
• Occurrence and even distribution genome wide
9.
10.
11.
12.
13. 13
Limitations of MAS
MAS is a costly method
It requires well equipped laboratory
MAS requires well trained manpower for handling of sophisticated
equipments
The detection of various linked DNA markers (AFLP, RFLP, RAPD,
SSR, SNP etc.) is a difficult, laborious and time consuming task.
health hazards
14. (1) LEAF TISSUE SAMPLING
(2) DNA EXTRACTION
(3) PCR
(4) GEL ELECTROPHORESIS
(5) MARKER ANALYSIS
Overview of ‘marker
genotyping’
17. 1. Marker Assisted Backcrossing ( MAB)
• MAB is the simplest
form of MAS, in which
the goal is to incorporate
a major gene from an
agronomically inferior
source (the donor
parent) into an elite
cultivar or breeding line
(the recurrent parent).
18. (Marker Assisted Backcrossing)
NIL
P1 (RP) × P2 ( DP)
F1 P1×
BC1F1 P1×
BC2F1
BC2F2 BC3F1
Foreground selection for
Homozygous target gene and
Background selection for
Recurrent parent
Foreground selection for
target gene and
Background selection
for Recurrent parent
BC2F3
P1
19. • MAB has several advantages over conventional breeding.
Effective selection for target loci
Minimizes linkage drag
Accelerate recovery of recurrent parents
1. Marker Assisted Backcrossing ( MAB)
20. • In this level,markers can be used in combination
with target gene or QTL. This is referred as
‘foreground selection’ .
• This may be particularly useful for traits that have
laborious or time-consuming phenotypic screening
procedures.
• It can also be used to select for reproductive-stage
traits in the seedling stage, allowing the best plants
to be identified for backcrossing.
• Furthermore, recessive alleles can be selected,
which is difficult to do using conventional methods.
MAB: I level of Selection – FOREGROUND SELECTION
21.
22. • Many undesirable genes that negatively affect crop performance may be
linked to the target gene from the donor parent—this is referred to as
‘linkage drag’.
23.
24. • The second level involves selecting BC
progeny with the target gene and
recombination events between the target
locus and linked flanking markers termed as
‘recombinant selection’.
• The purpose of recombinant selection is to
reduce the size of the donor chromosome
segment containing the target locus
MAB:lI nd Level of selection
RECOMBINANT SELECTION
25. • Using conventional breeding methods, the donor segment can
remain very large even with many BC generations i.e. more
than 10.
• By using markers that flank a target gene (e.g. less than 5 cM
on either side), linkage drag can be minimized.
• Since double recombination events occurring on both sides of
a target locus are extremely rare recombinant selection is
usually performed using at least two BC generations
26. • The third level of MAB involves selecting BC
progeny with the greatest proportion of
recurrent parent (RP) genome, using markers
that are unlinked to the target locus we refer to
this as ‘background selection’.
• Background selection refers to the use of tightly
linked flanking markers for recombinant
selection and unlinked markers to select for the
RP.
MAB: III Level of Selection
BACKGROUND SELECTION
27. • With conventional backcrossing, it takes a minimum of 6 BC
generations to recover the RP and there may still be several
donor chromosome fragments unlinked to the target gene.
• The use of background selection during MAB to accelerate the
development of an RP with an additional (or a few) genes has
been referred to as ‘complete line conversion’
31. 2. Marker Assisted Evaluation of Breeding material
• Assessment of purity
• Assessment of genetic diversity and parental selection
• Study of heterosis e.g. Maize & sorghum
• Identification of genomic region under selection for QTL mapping &
development of variety through MAS
32. 3. Gene Pyramiding
• Gene Pyramiding is the process of combining several genes together
into a single genotype
• Widely used for combining multiple disease resistance genes for
specific races of a pathogen.
• Pyramiding is extremely difficult to achieve using conventional
methods.
• Consider phenotyping a single plant for multiple forms of seedling
resistance-almost impossible
Important to develop durable disease resistance against different races
33. 33
Gene Pyramiding
Process of combining several genes usually from 2 different parents, together into a single genotype
Breeding plan
×
F1
Gene A + B
MAS
Select F2 plants that have
Gene A and Gene B
Genotypes
P1 : AAbb × P2 : aaBB
P2P1
F1 : AaBb
F2 AB Ab aB ab
AB AABB AABb AaBB AaBb
Ab AABb Aabb AaBb Aabb
aB AaBB AaBb aaBB aaBb
Ab AaBb Aabb aaBb aabb
(Hittalmani & Liu et al., 2000)
35. 4. Early generation MAS
• MAS conducted in F2 or F3 stage
• Plants with desirable genes /QTLs are selected and alleles can be fixed
in the homozygous state
plants with undesirable gene combinations can be discarded
Advantage for later stages of breeding program because resources can
be used to focus on fewer lines
36.
37. 5. Combined approaches
• In some cases a combination of phenotypic screening and MAS
approach may be useful
1 To maximize genetic gain (when some QTL have been unidentified
from QTL mapping
2. Level of recombination between marker and QTL ( in other words
marker is not 100 % acurate)
3 To reduce population sizes for traits where marker genotyping is
cheaper or easier than phenotypic screening
38. References
• Collard B.C.Y. and Mackill D.J.2007 Marker assisted selection: An
approach for precision plant breeding in the twenty first century, Phil.
Trans. R. Soc. B , 363, 557–572
• Hittalmani, et al.,2000 Fine mapping and DNA marker-assisted
pyramiding of the three major genes for blast resistance in rice, Theor
Appl Genet ,100:1121–1128
• Liu et al 2000, Molecular marker facilitated pyramiding of different genes
for powdery mildew resistance in wheat, Plant Breeding 119,21-24
• Ribaut J.M and Hoisington D,1998 Markrt assisted selection: New tools
and stategies, Trends plant science 3, 336-339
• Singh B.D.2018 Plant breeding :principles and methods, Kalyani
publication, New Delhi :748-758
PCR: Amplification/Multiplication of DNAs
GEL: DNAs run on the gel, Seperation of the dna on the basis of charge and molecular wt. On the basis of banding pattern we can select plants for disease resistance.