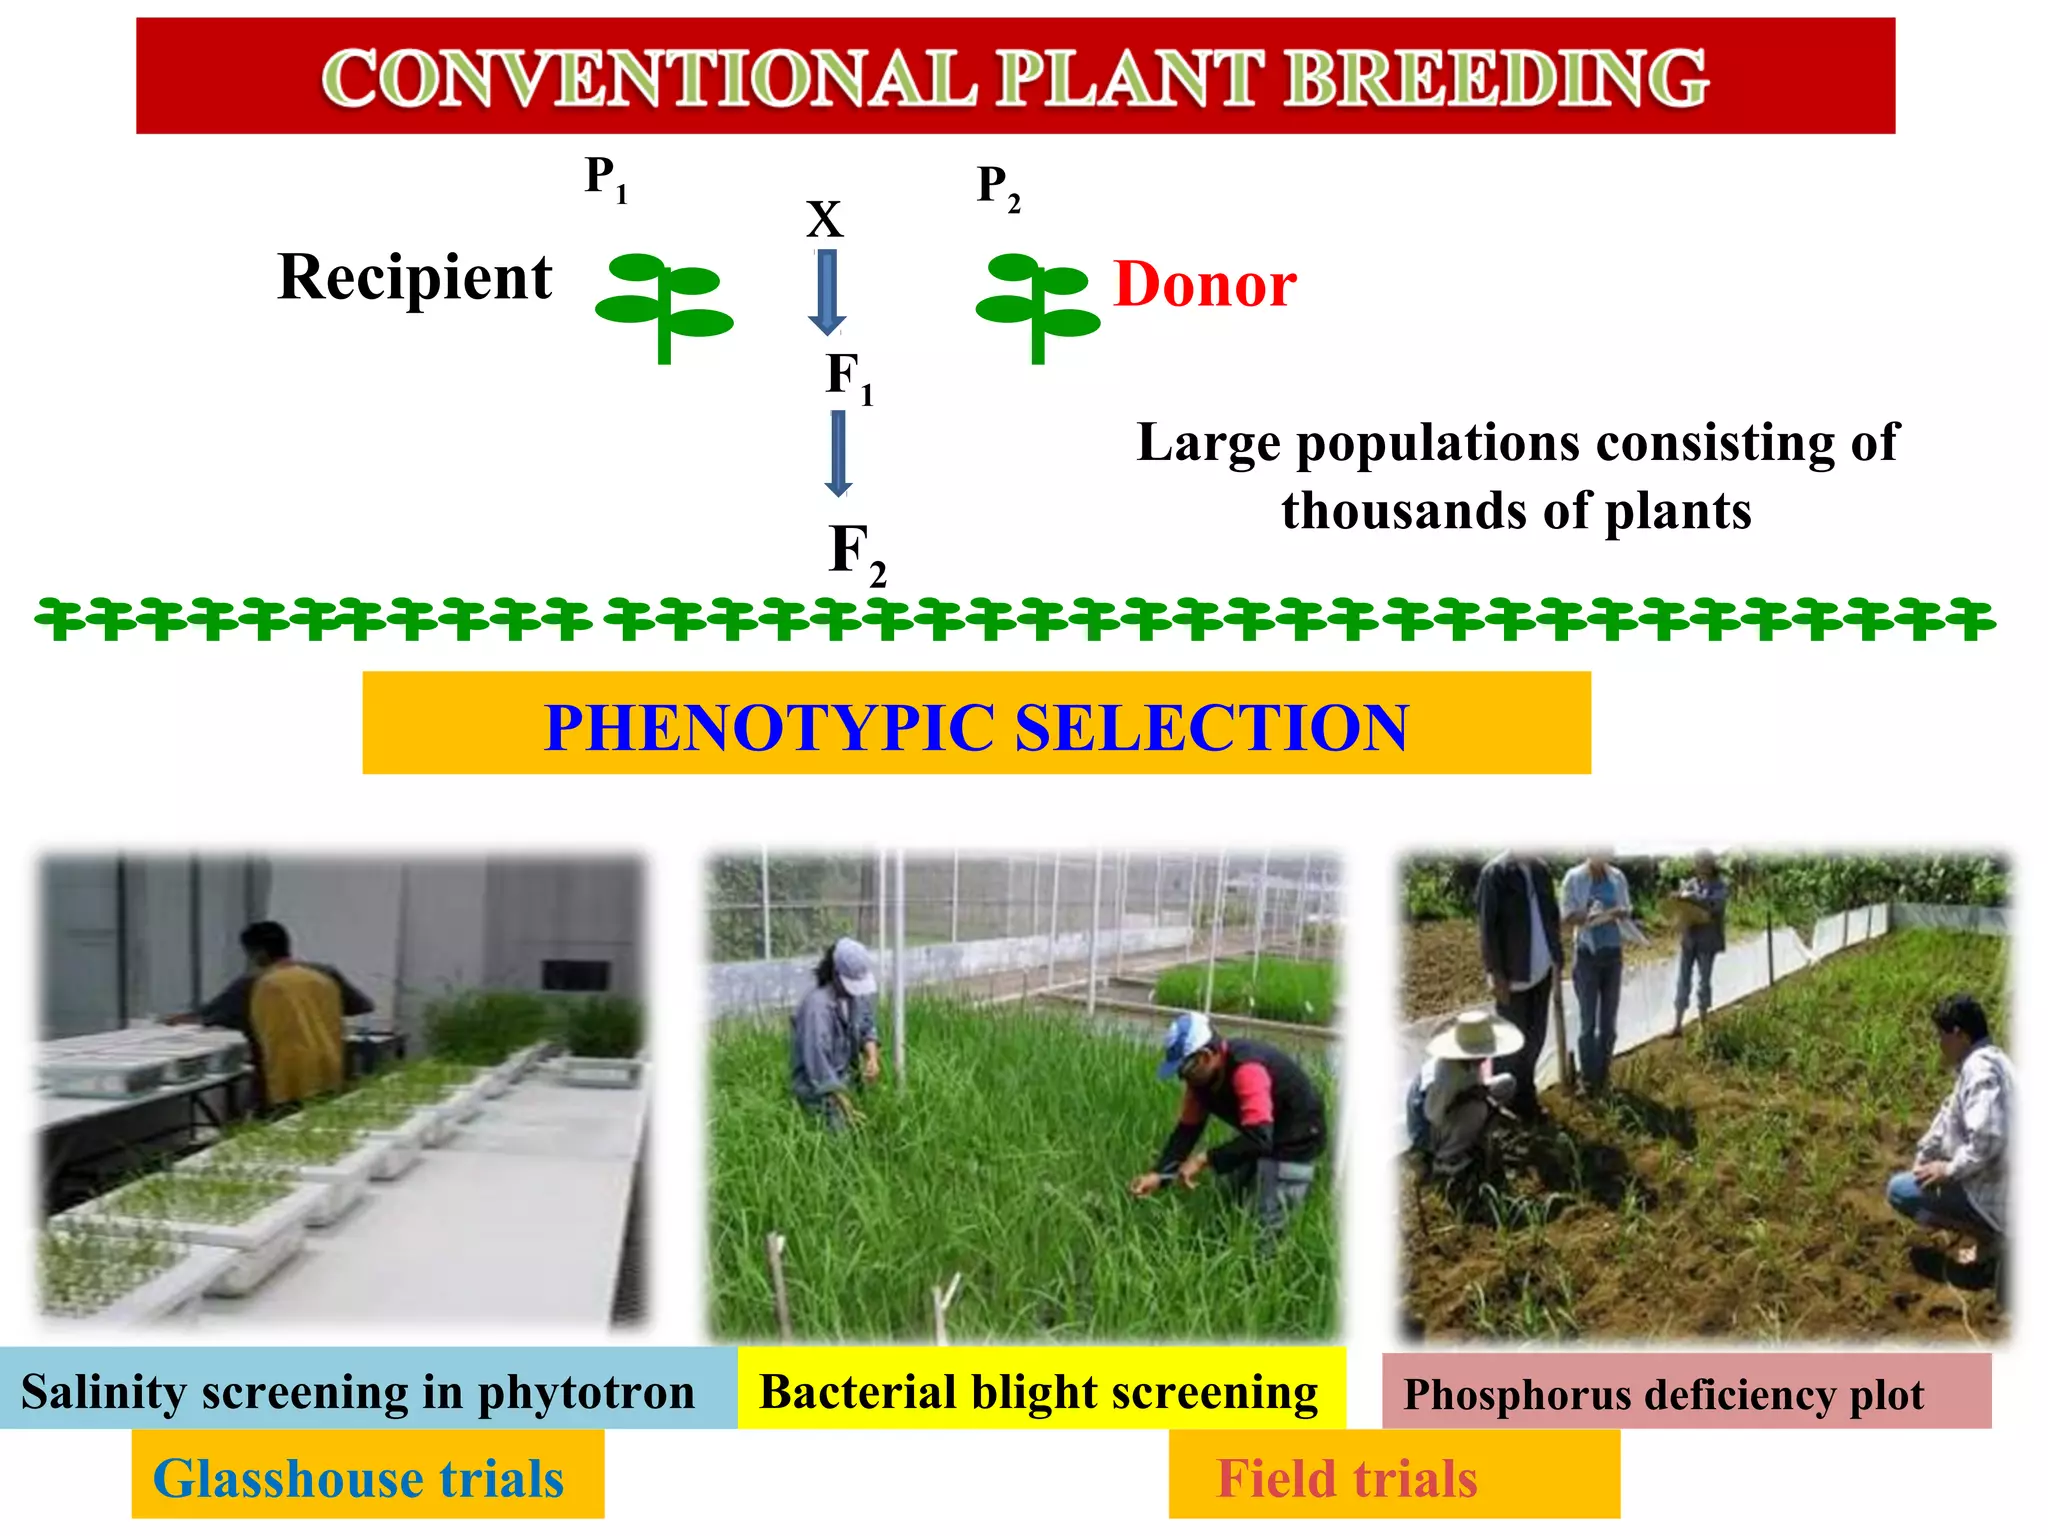
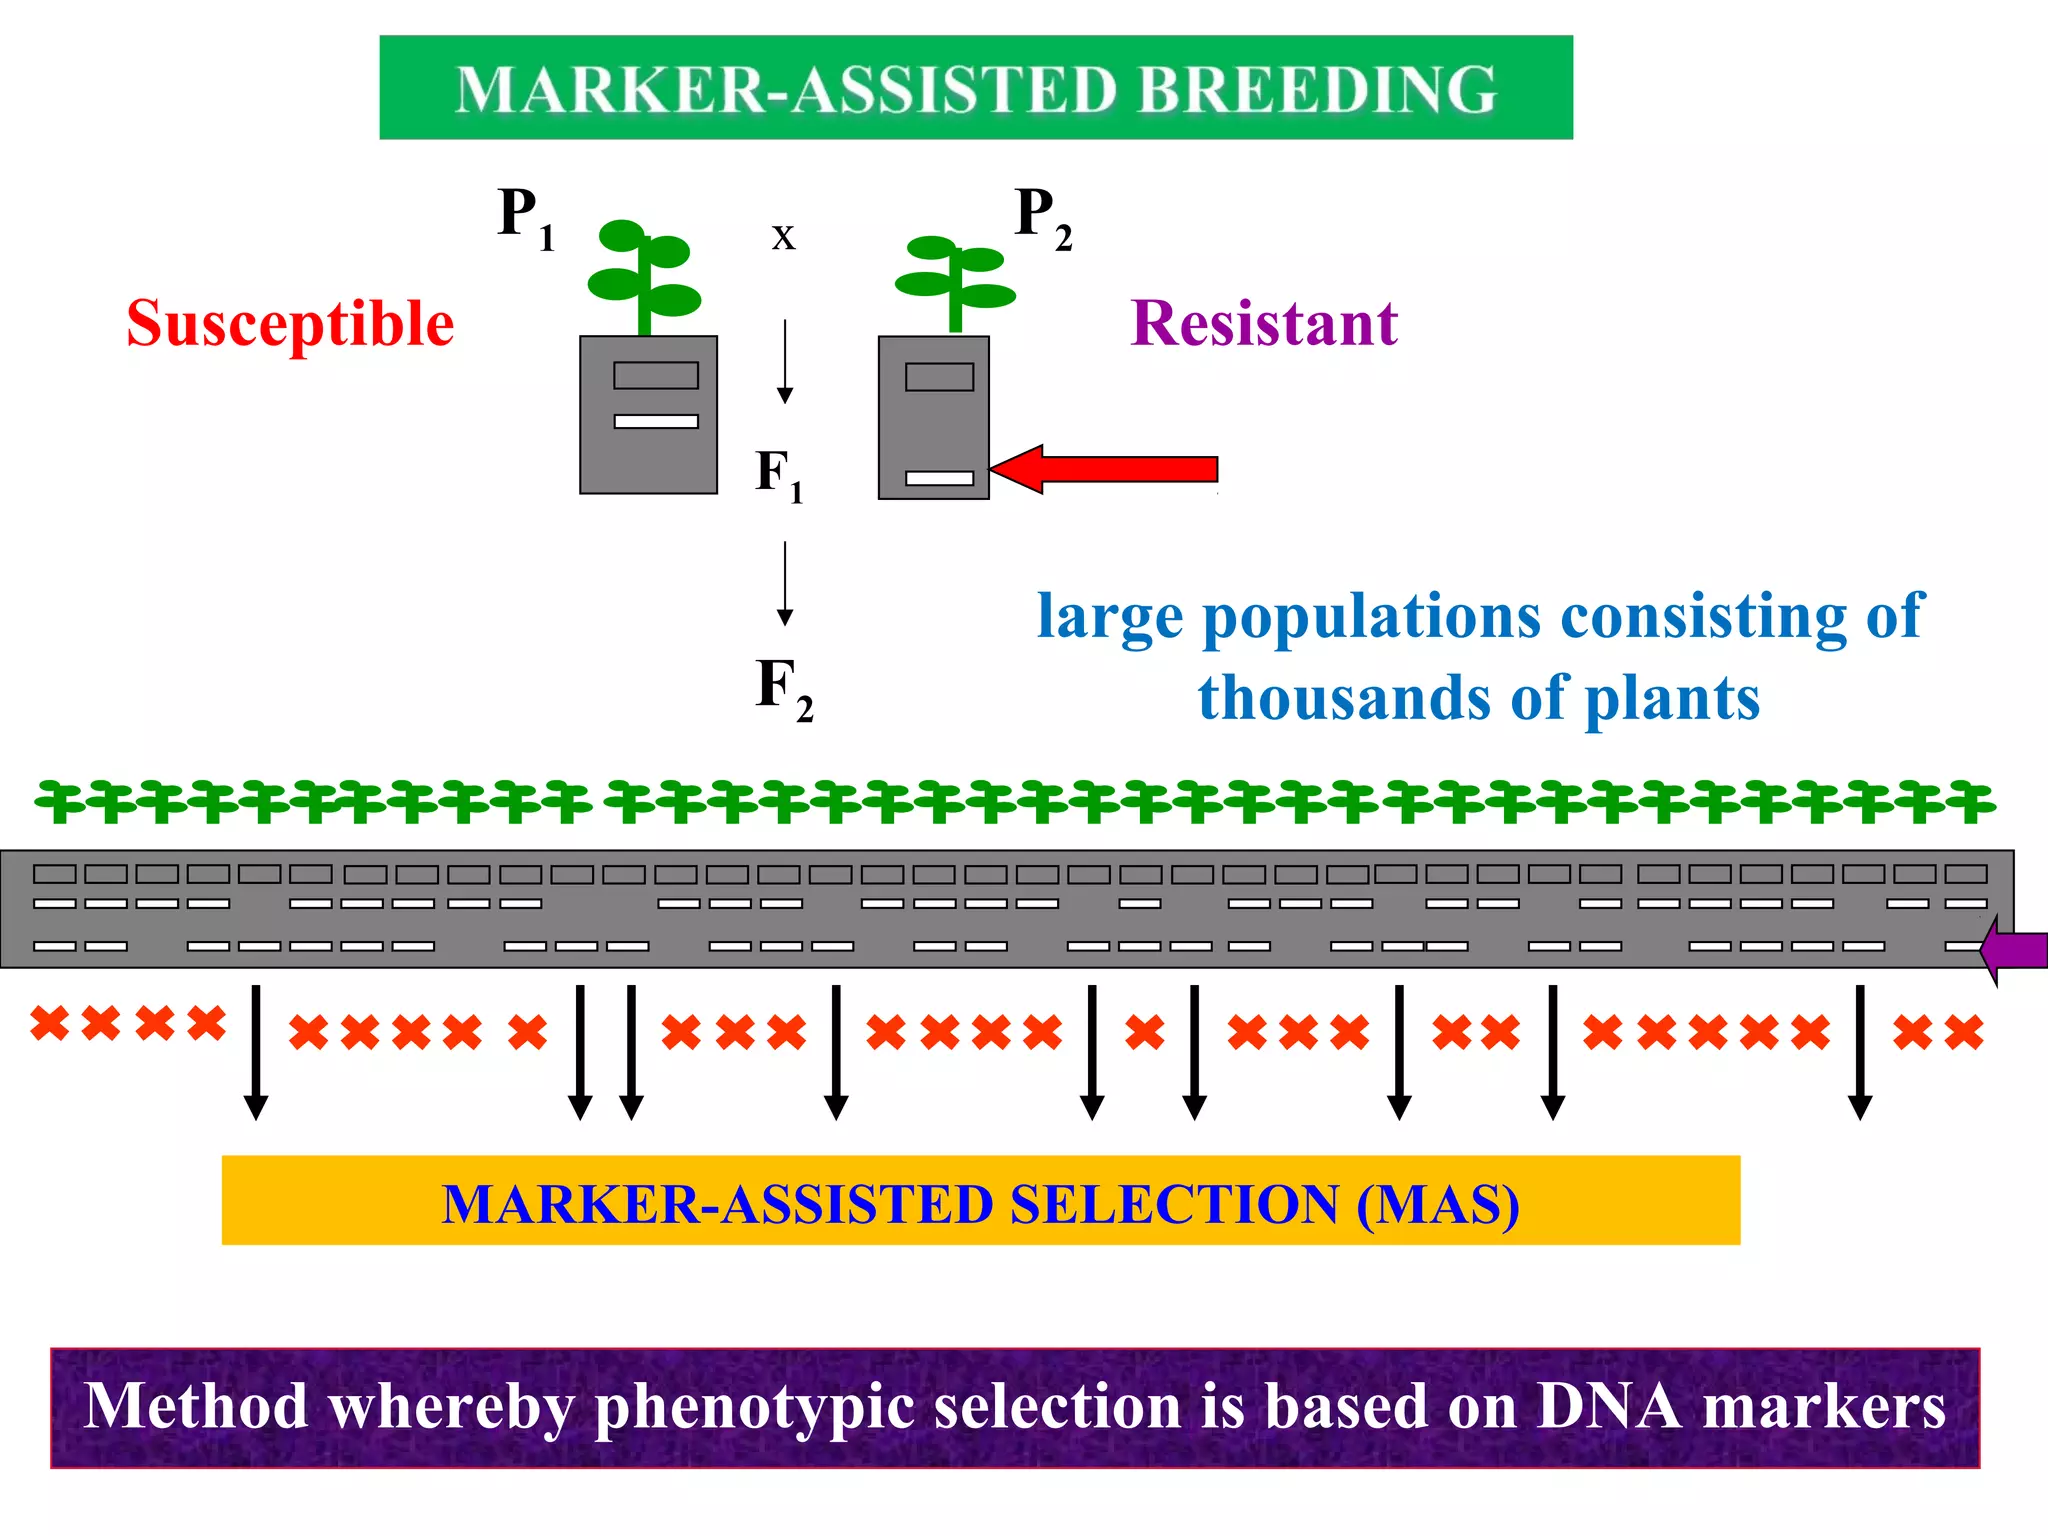
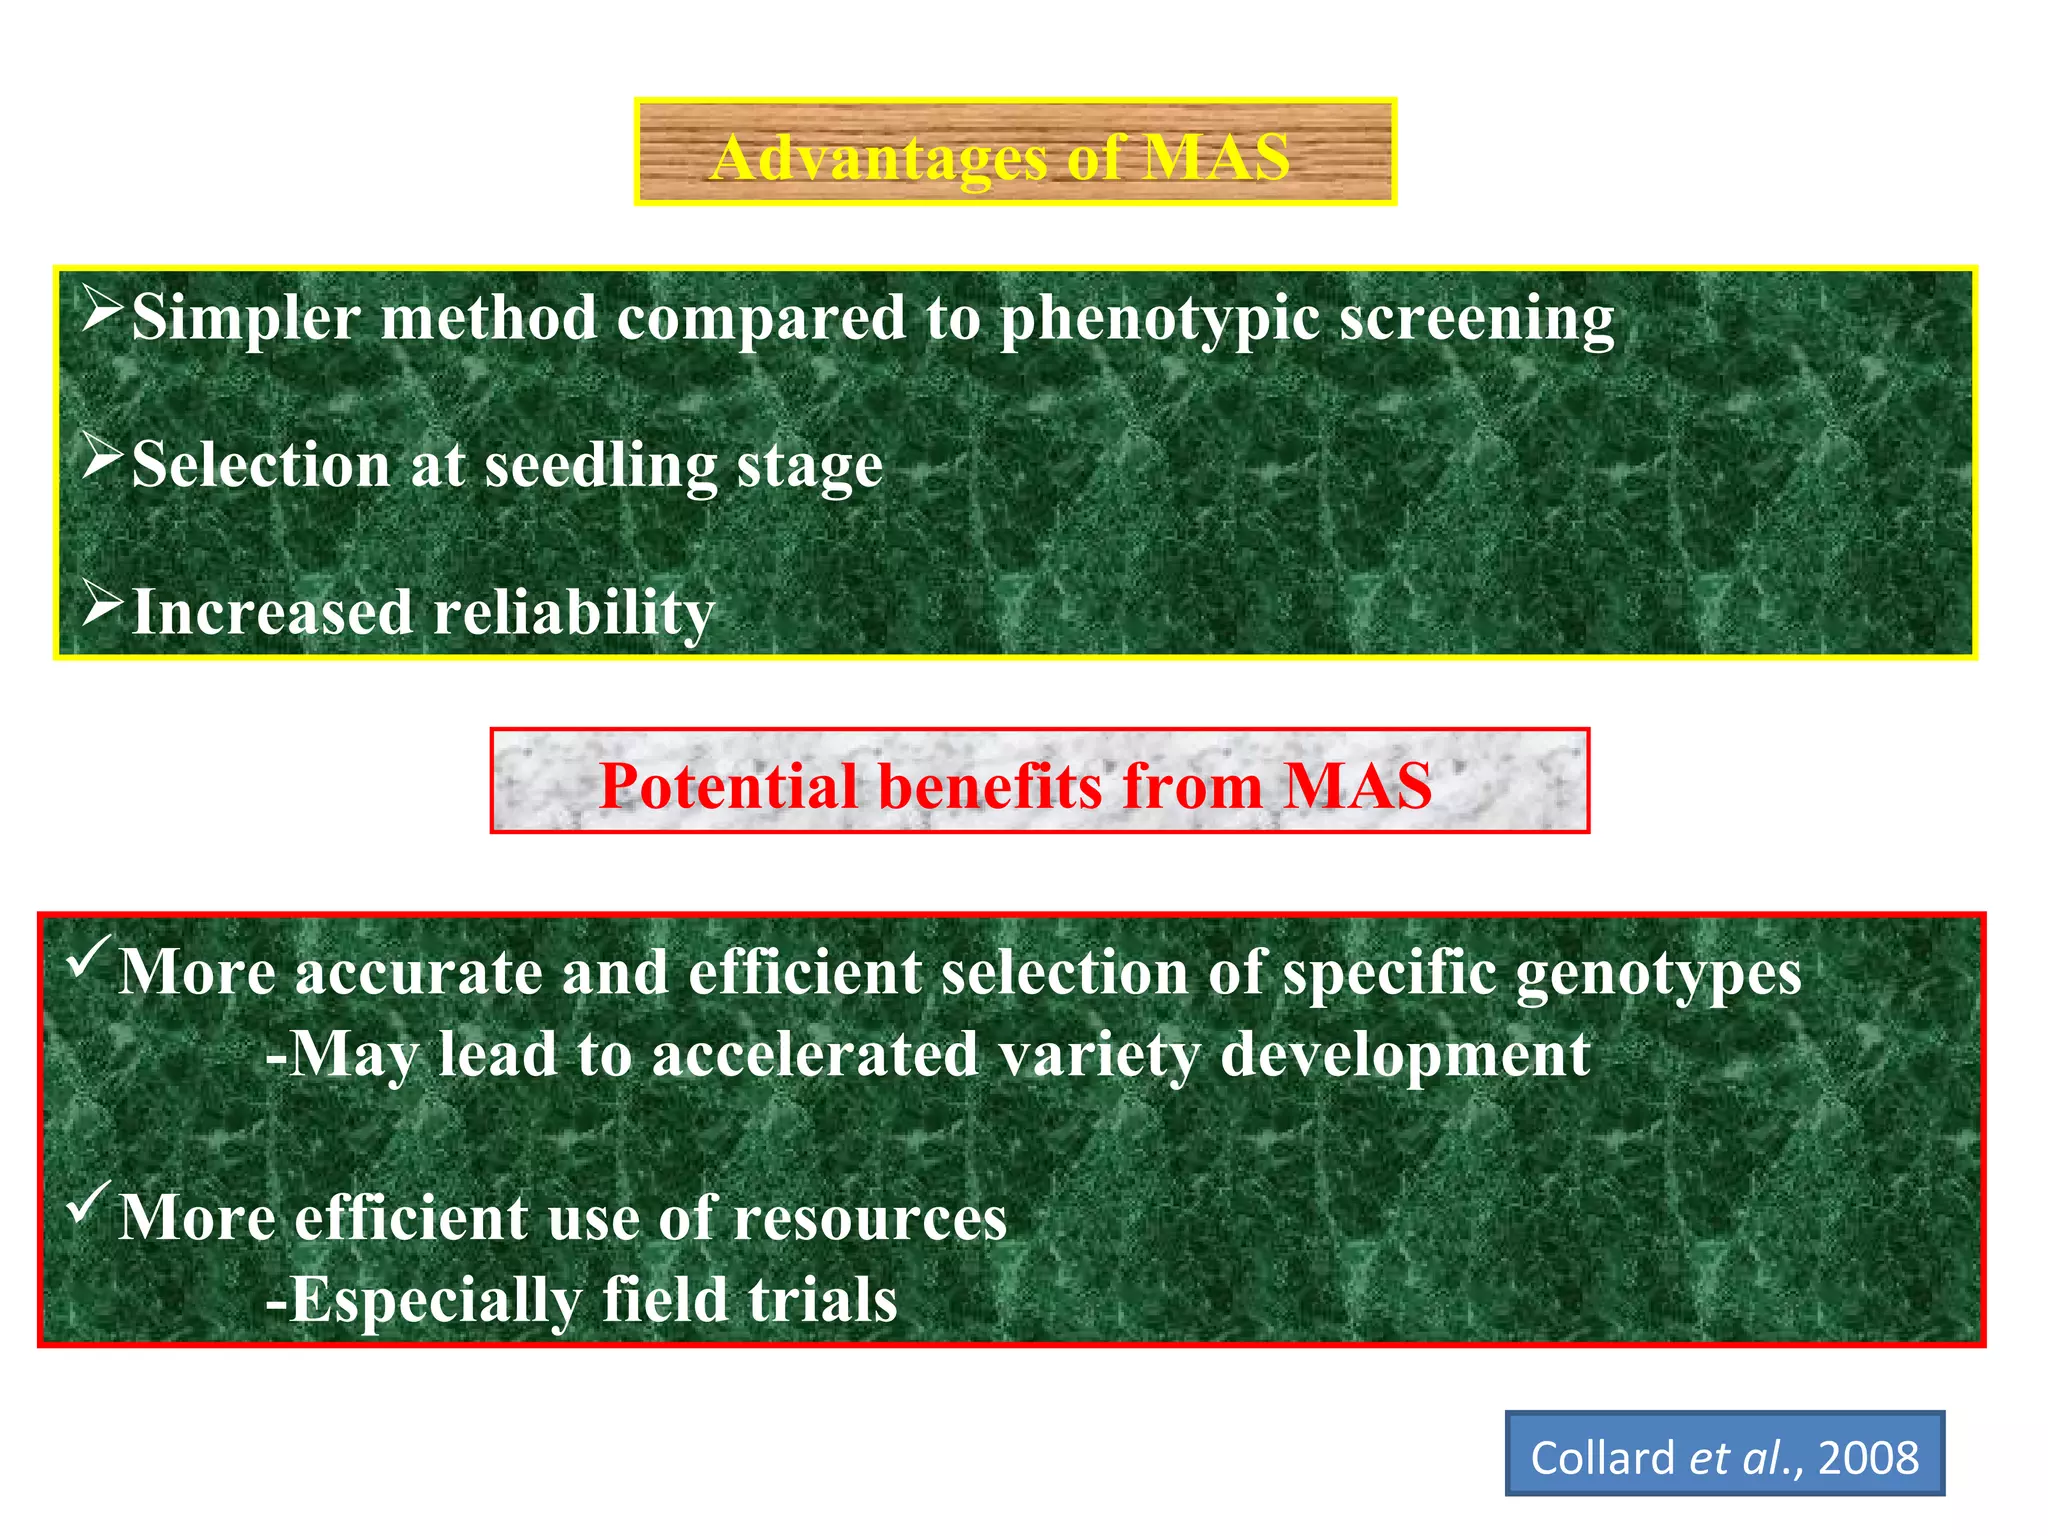
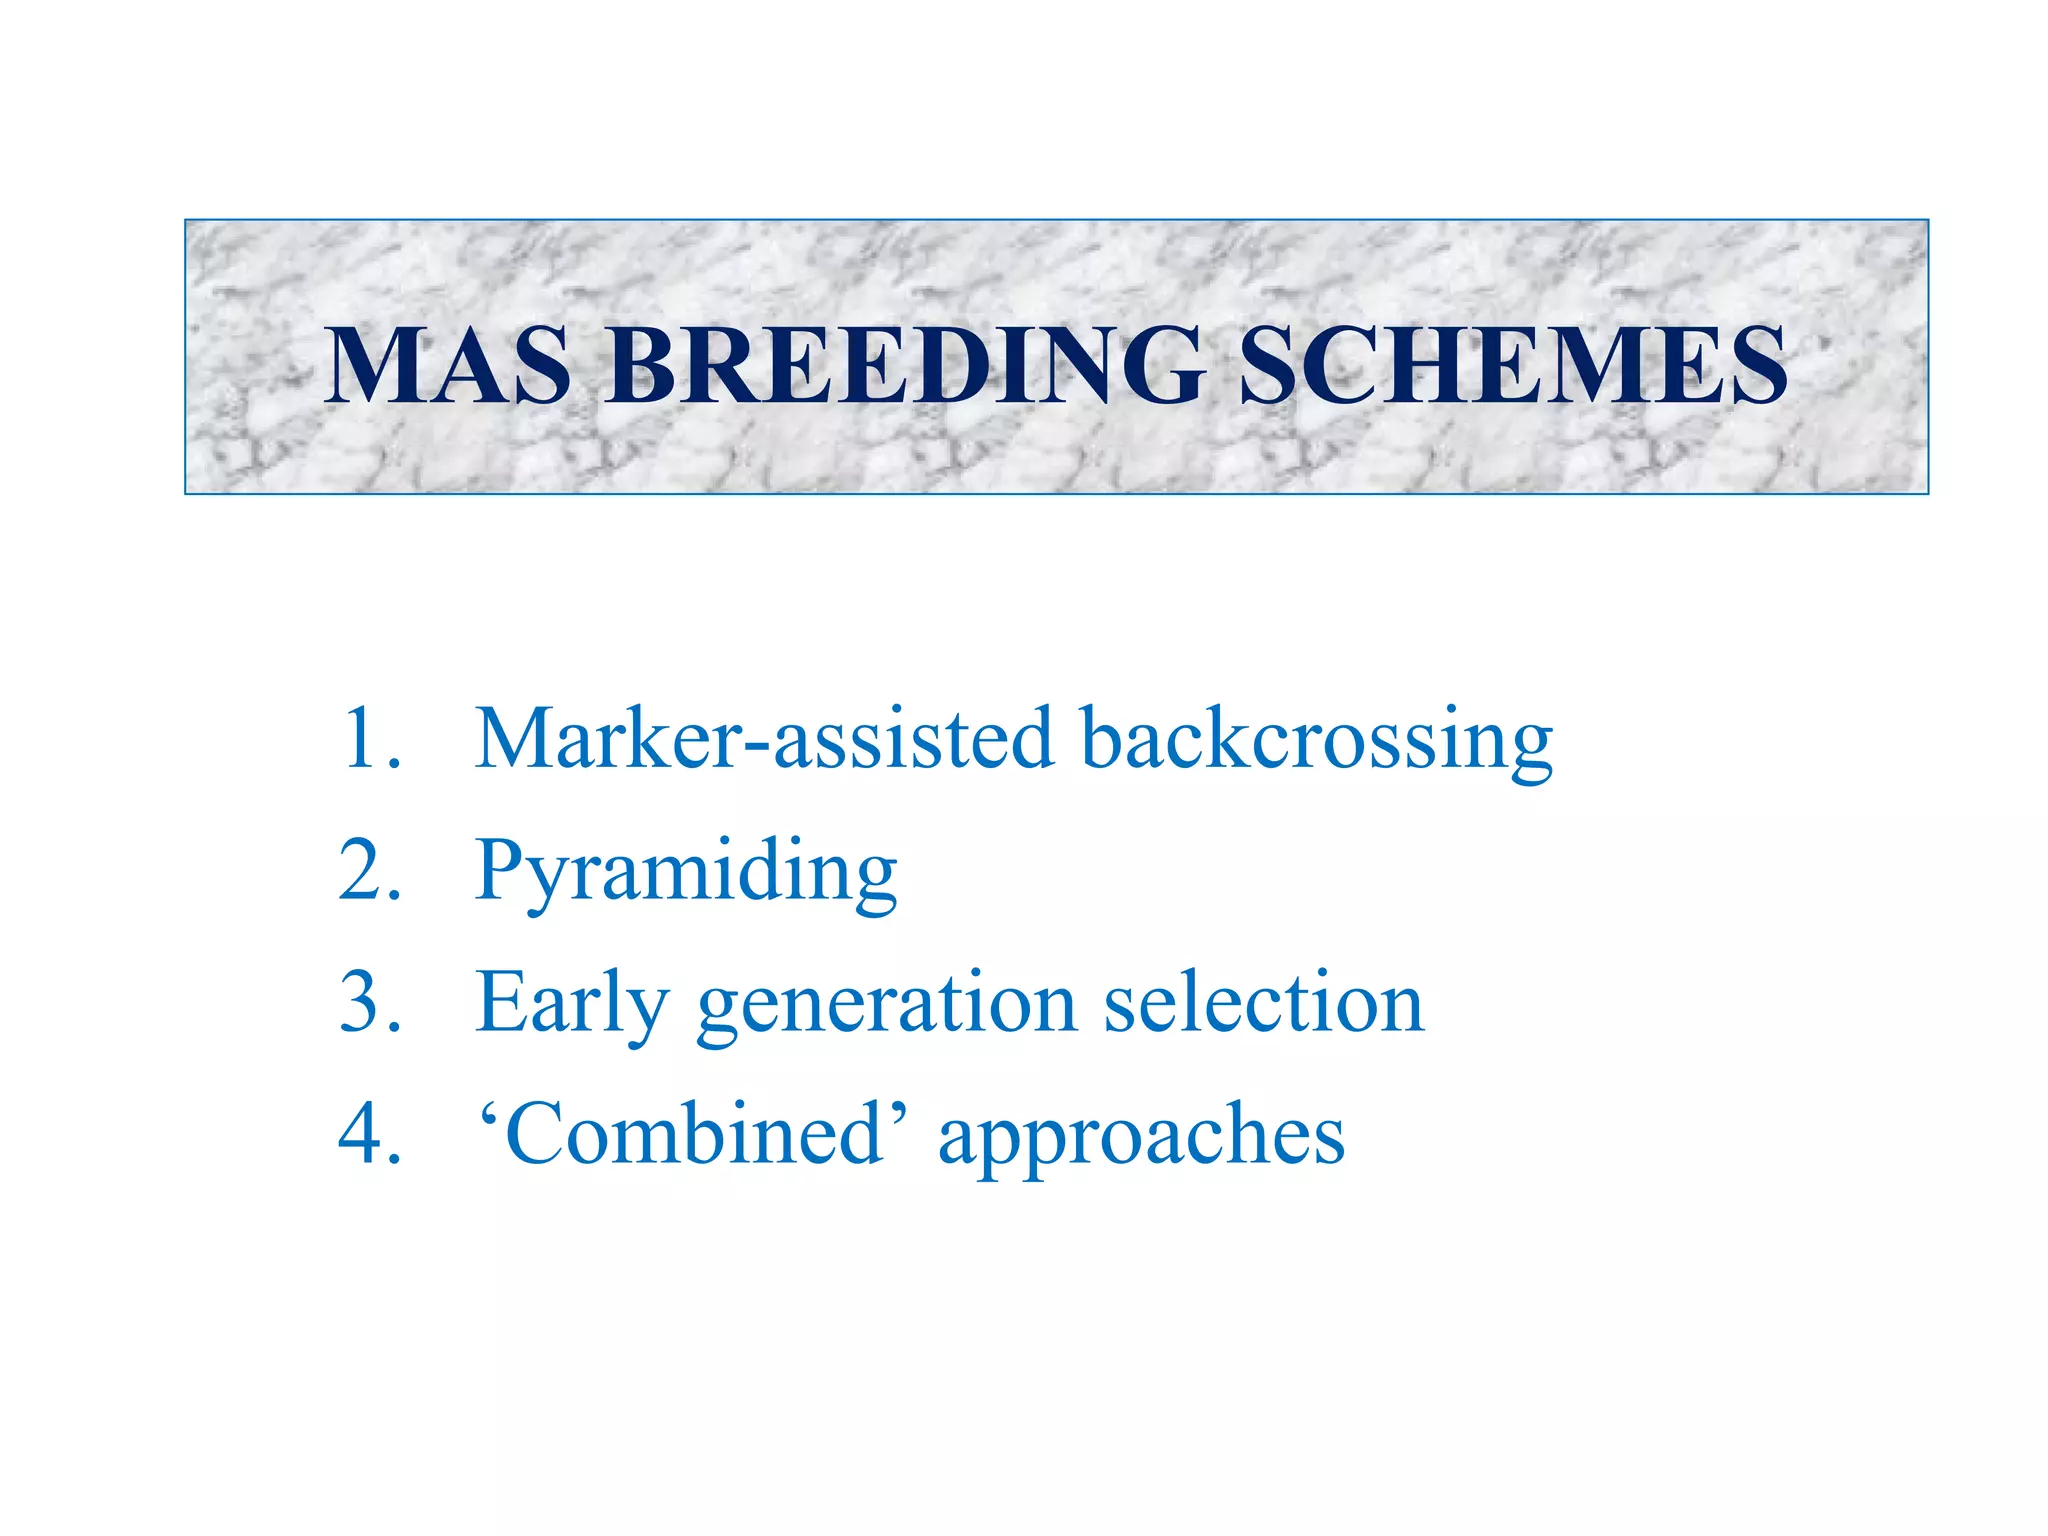
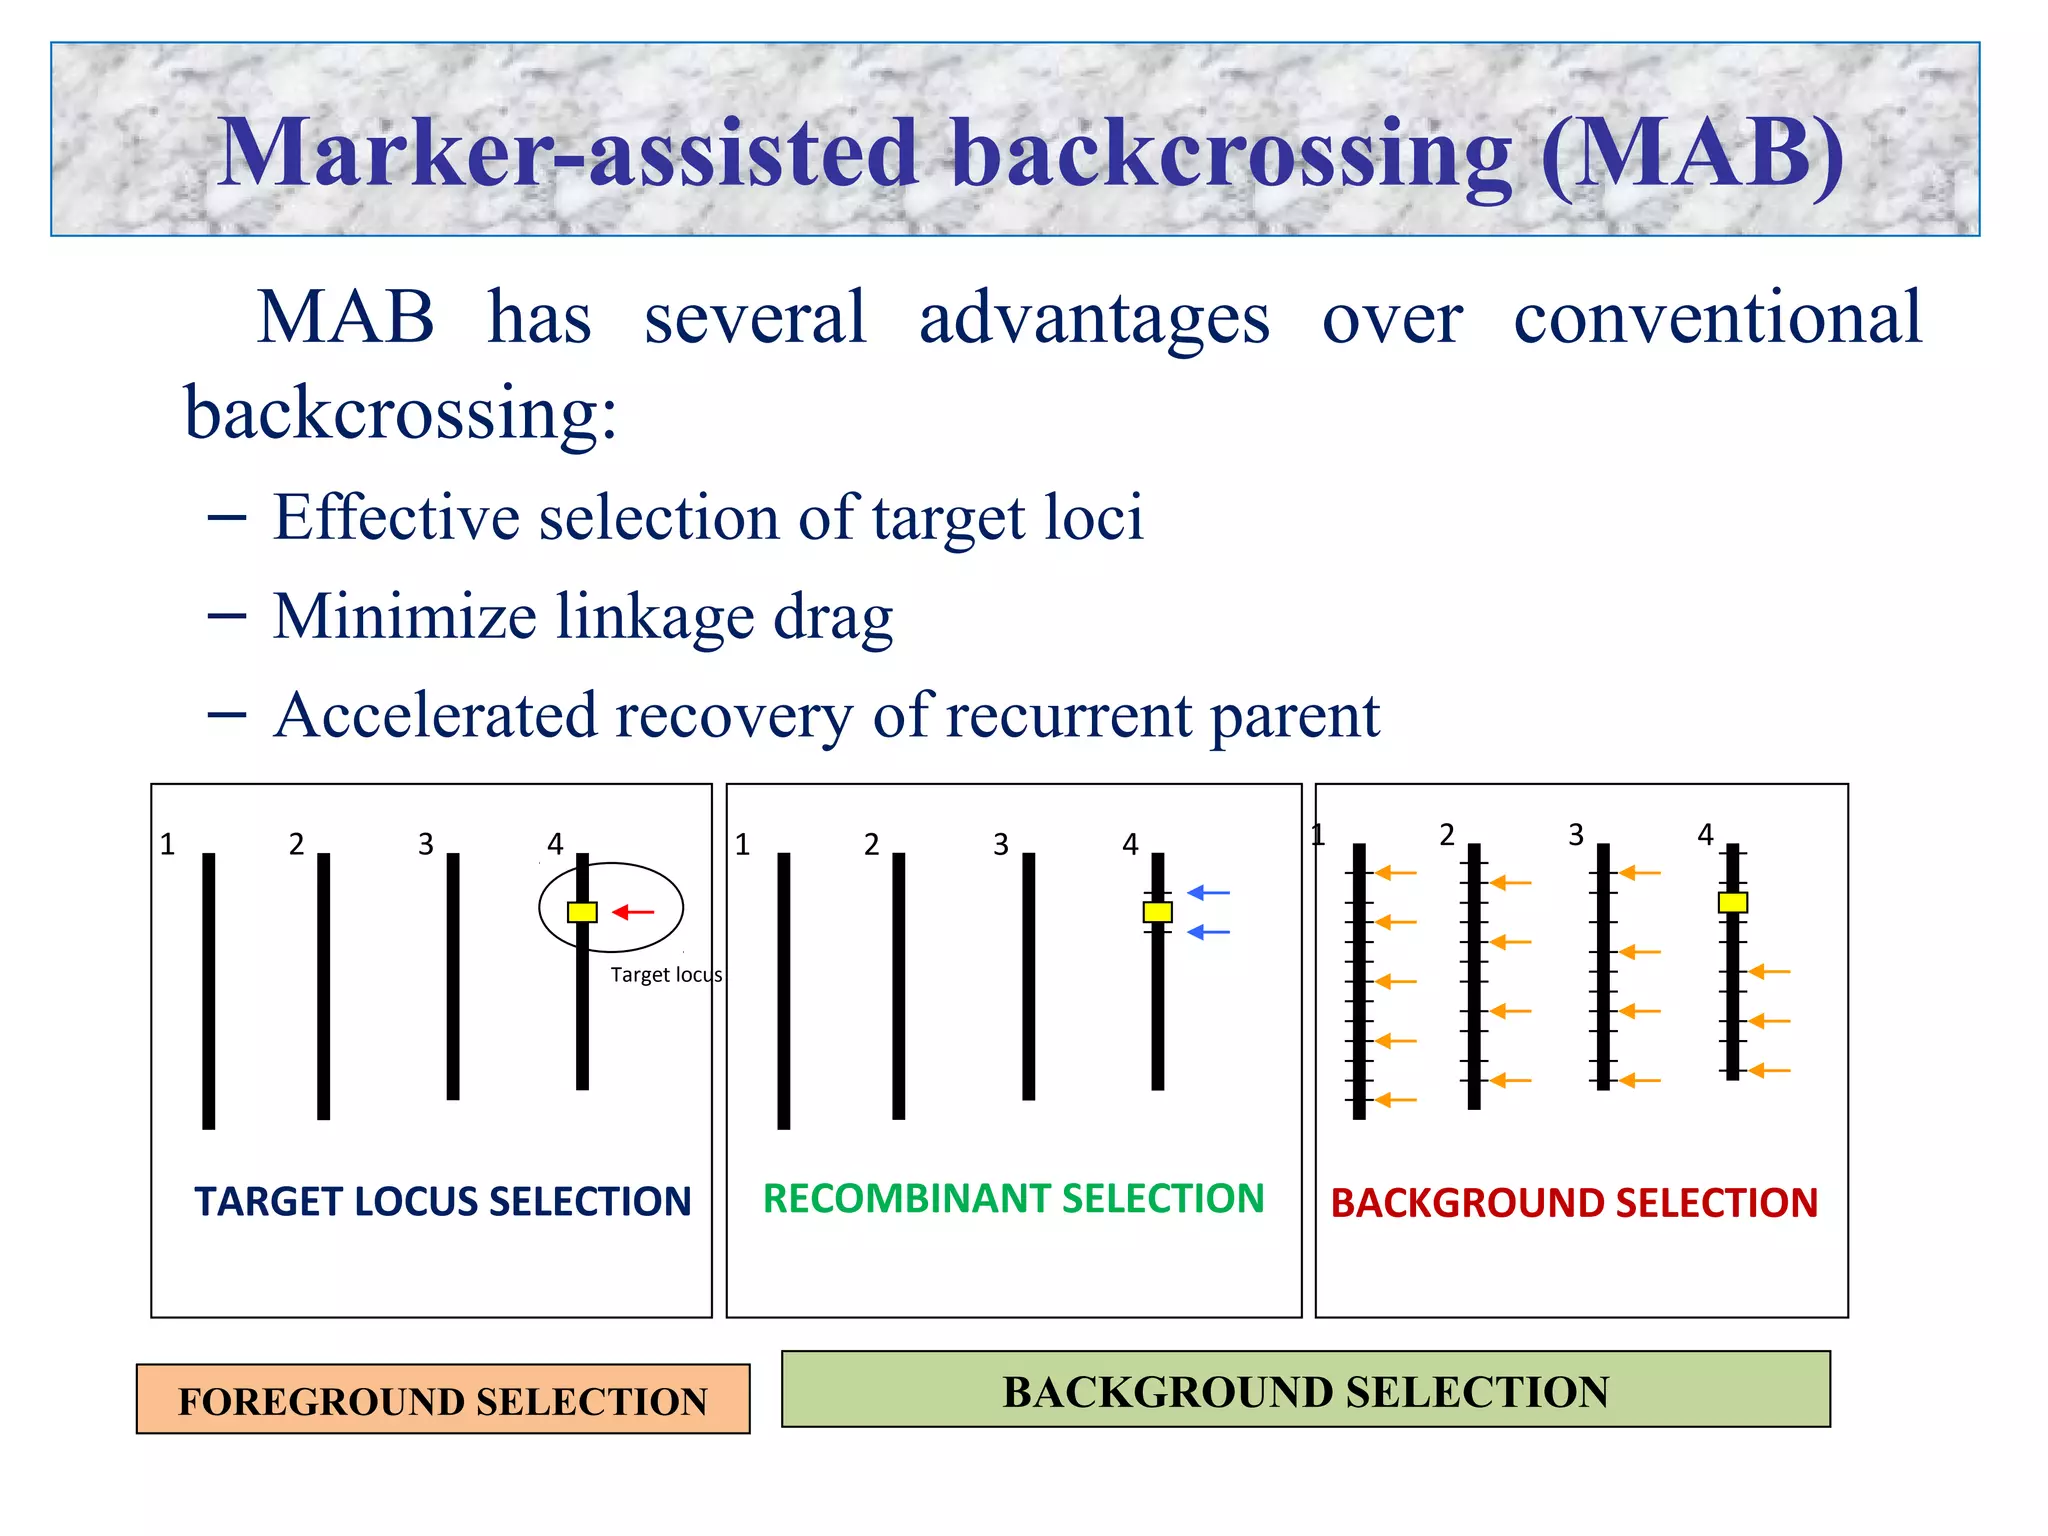
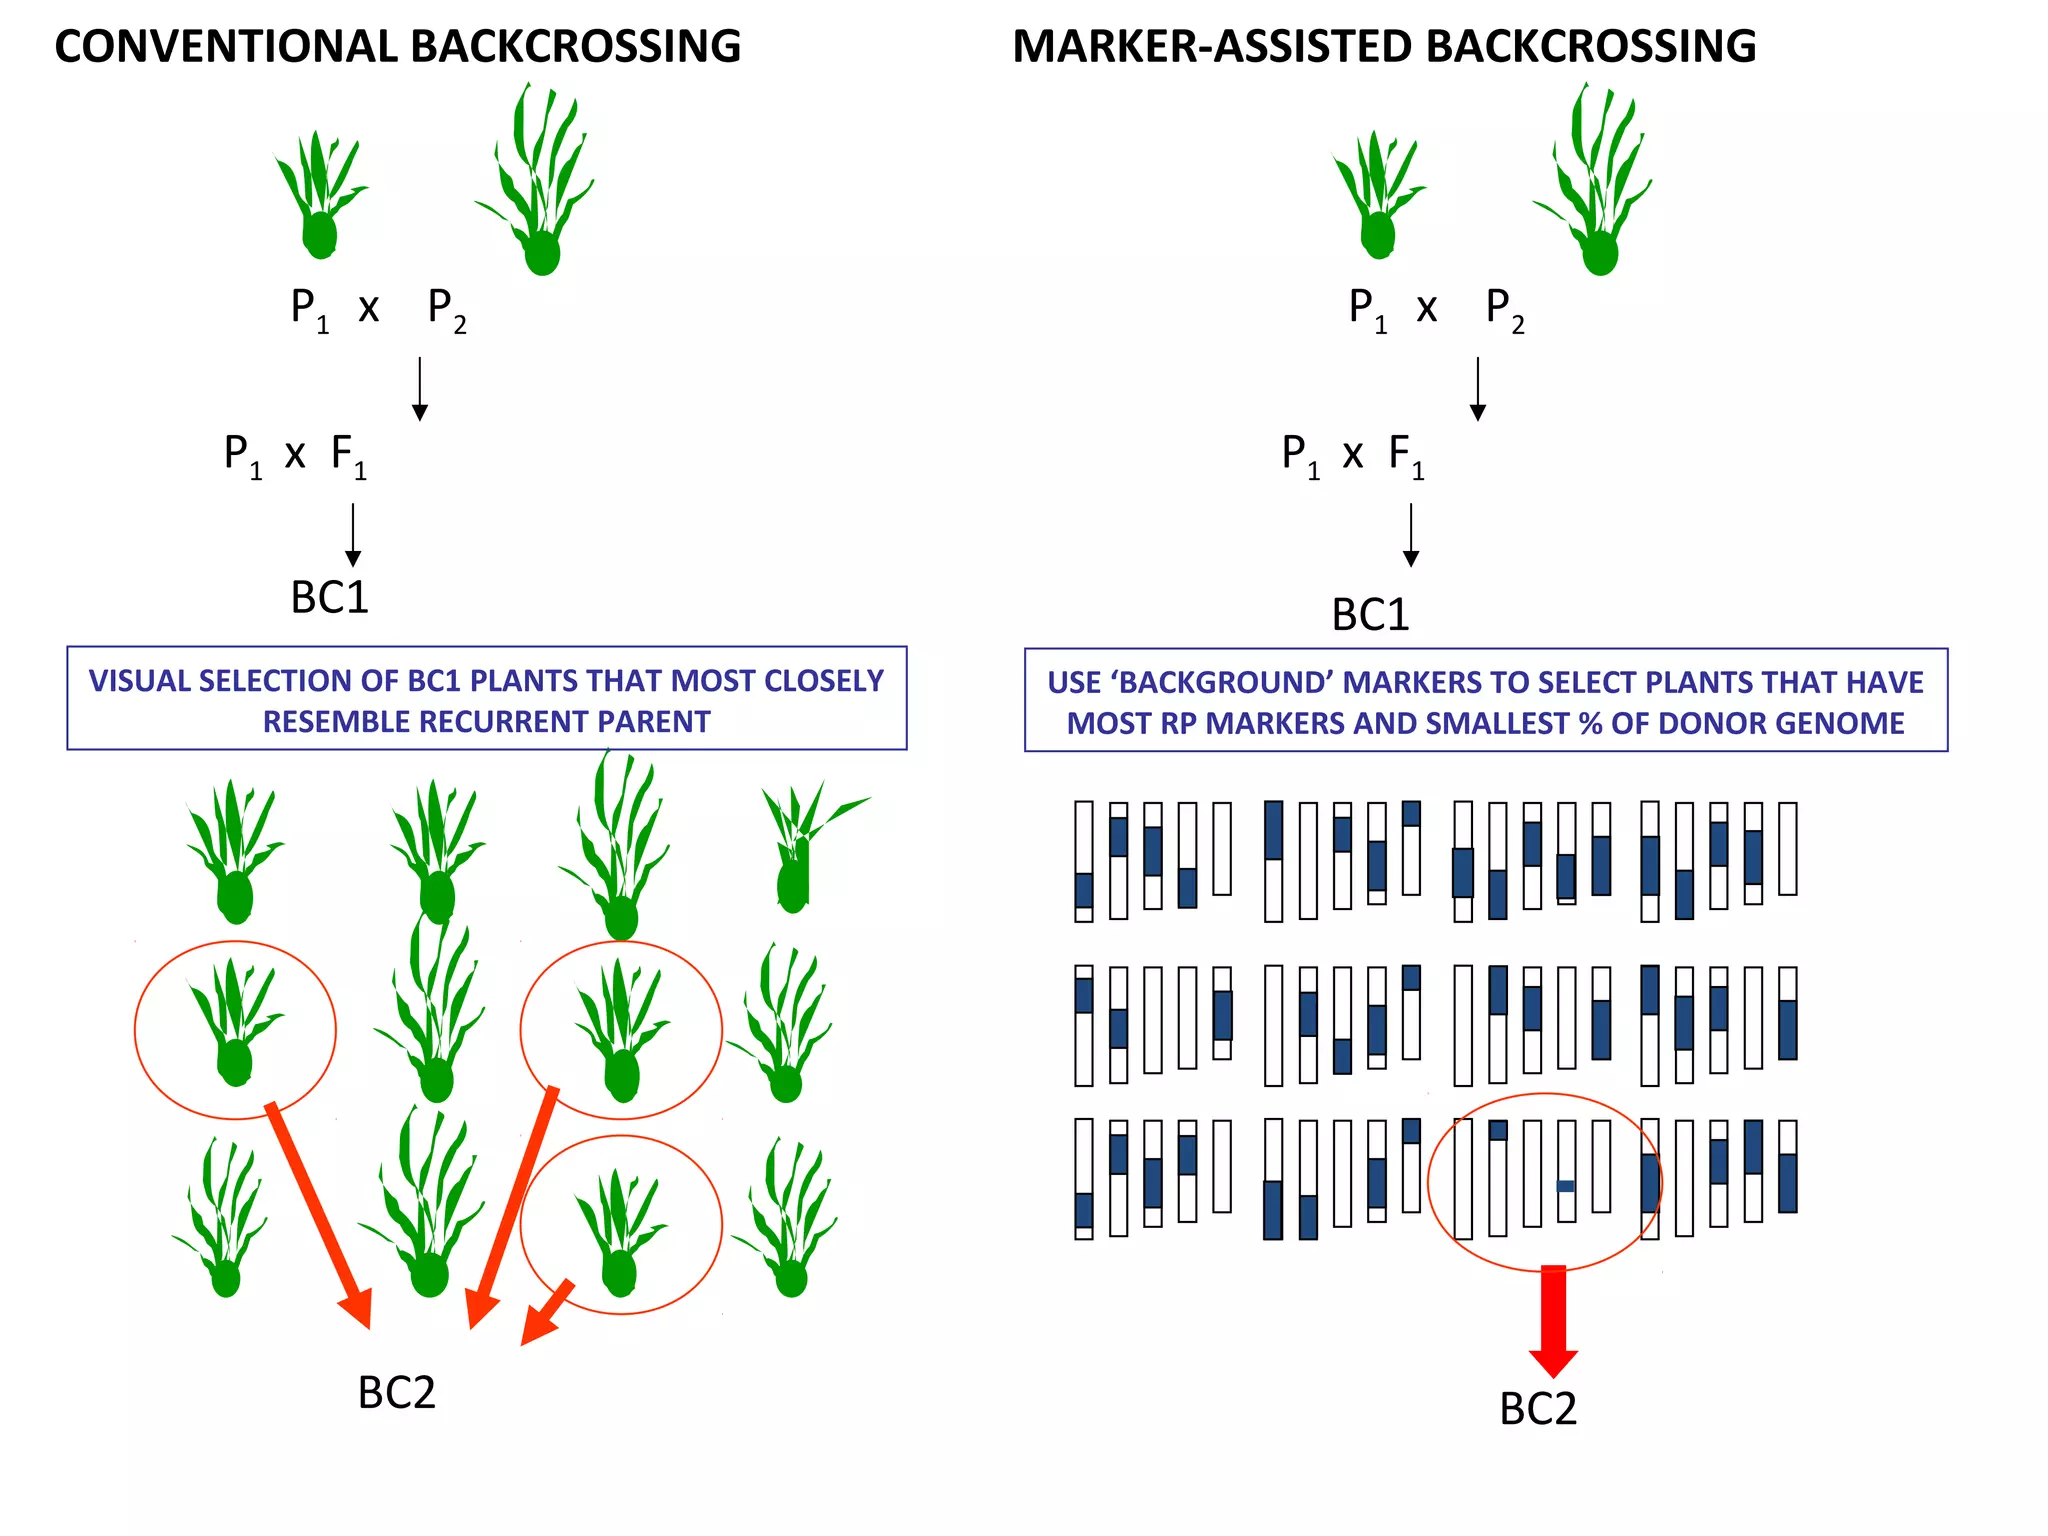
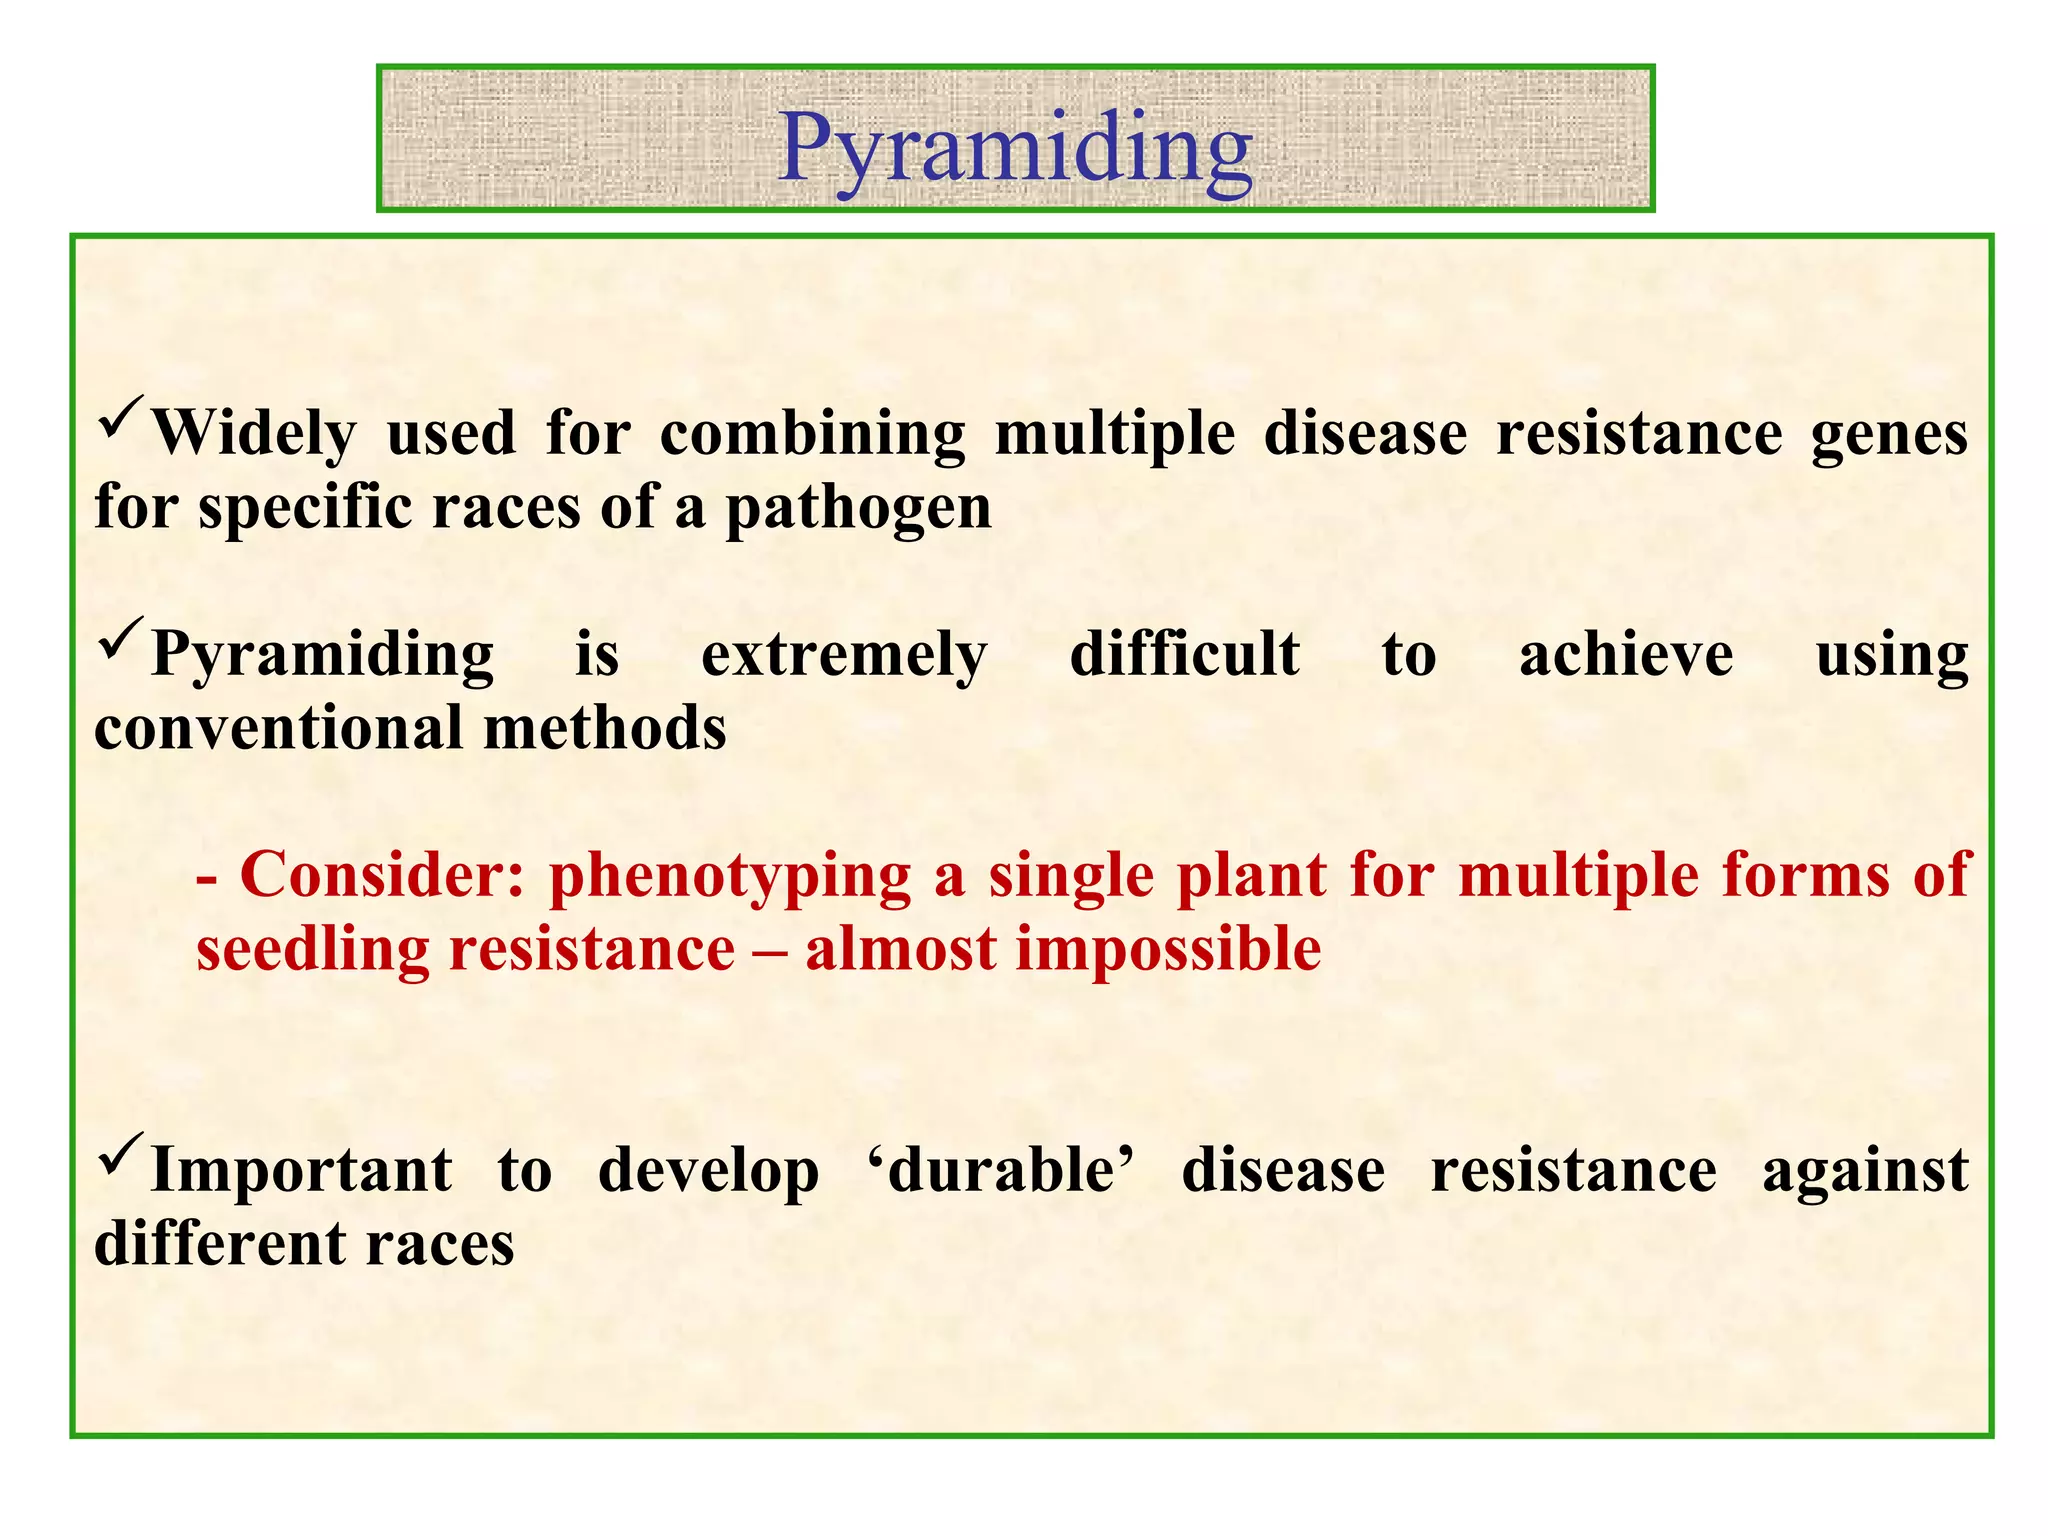
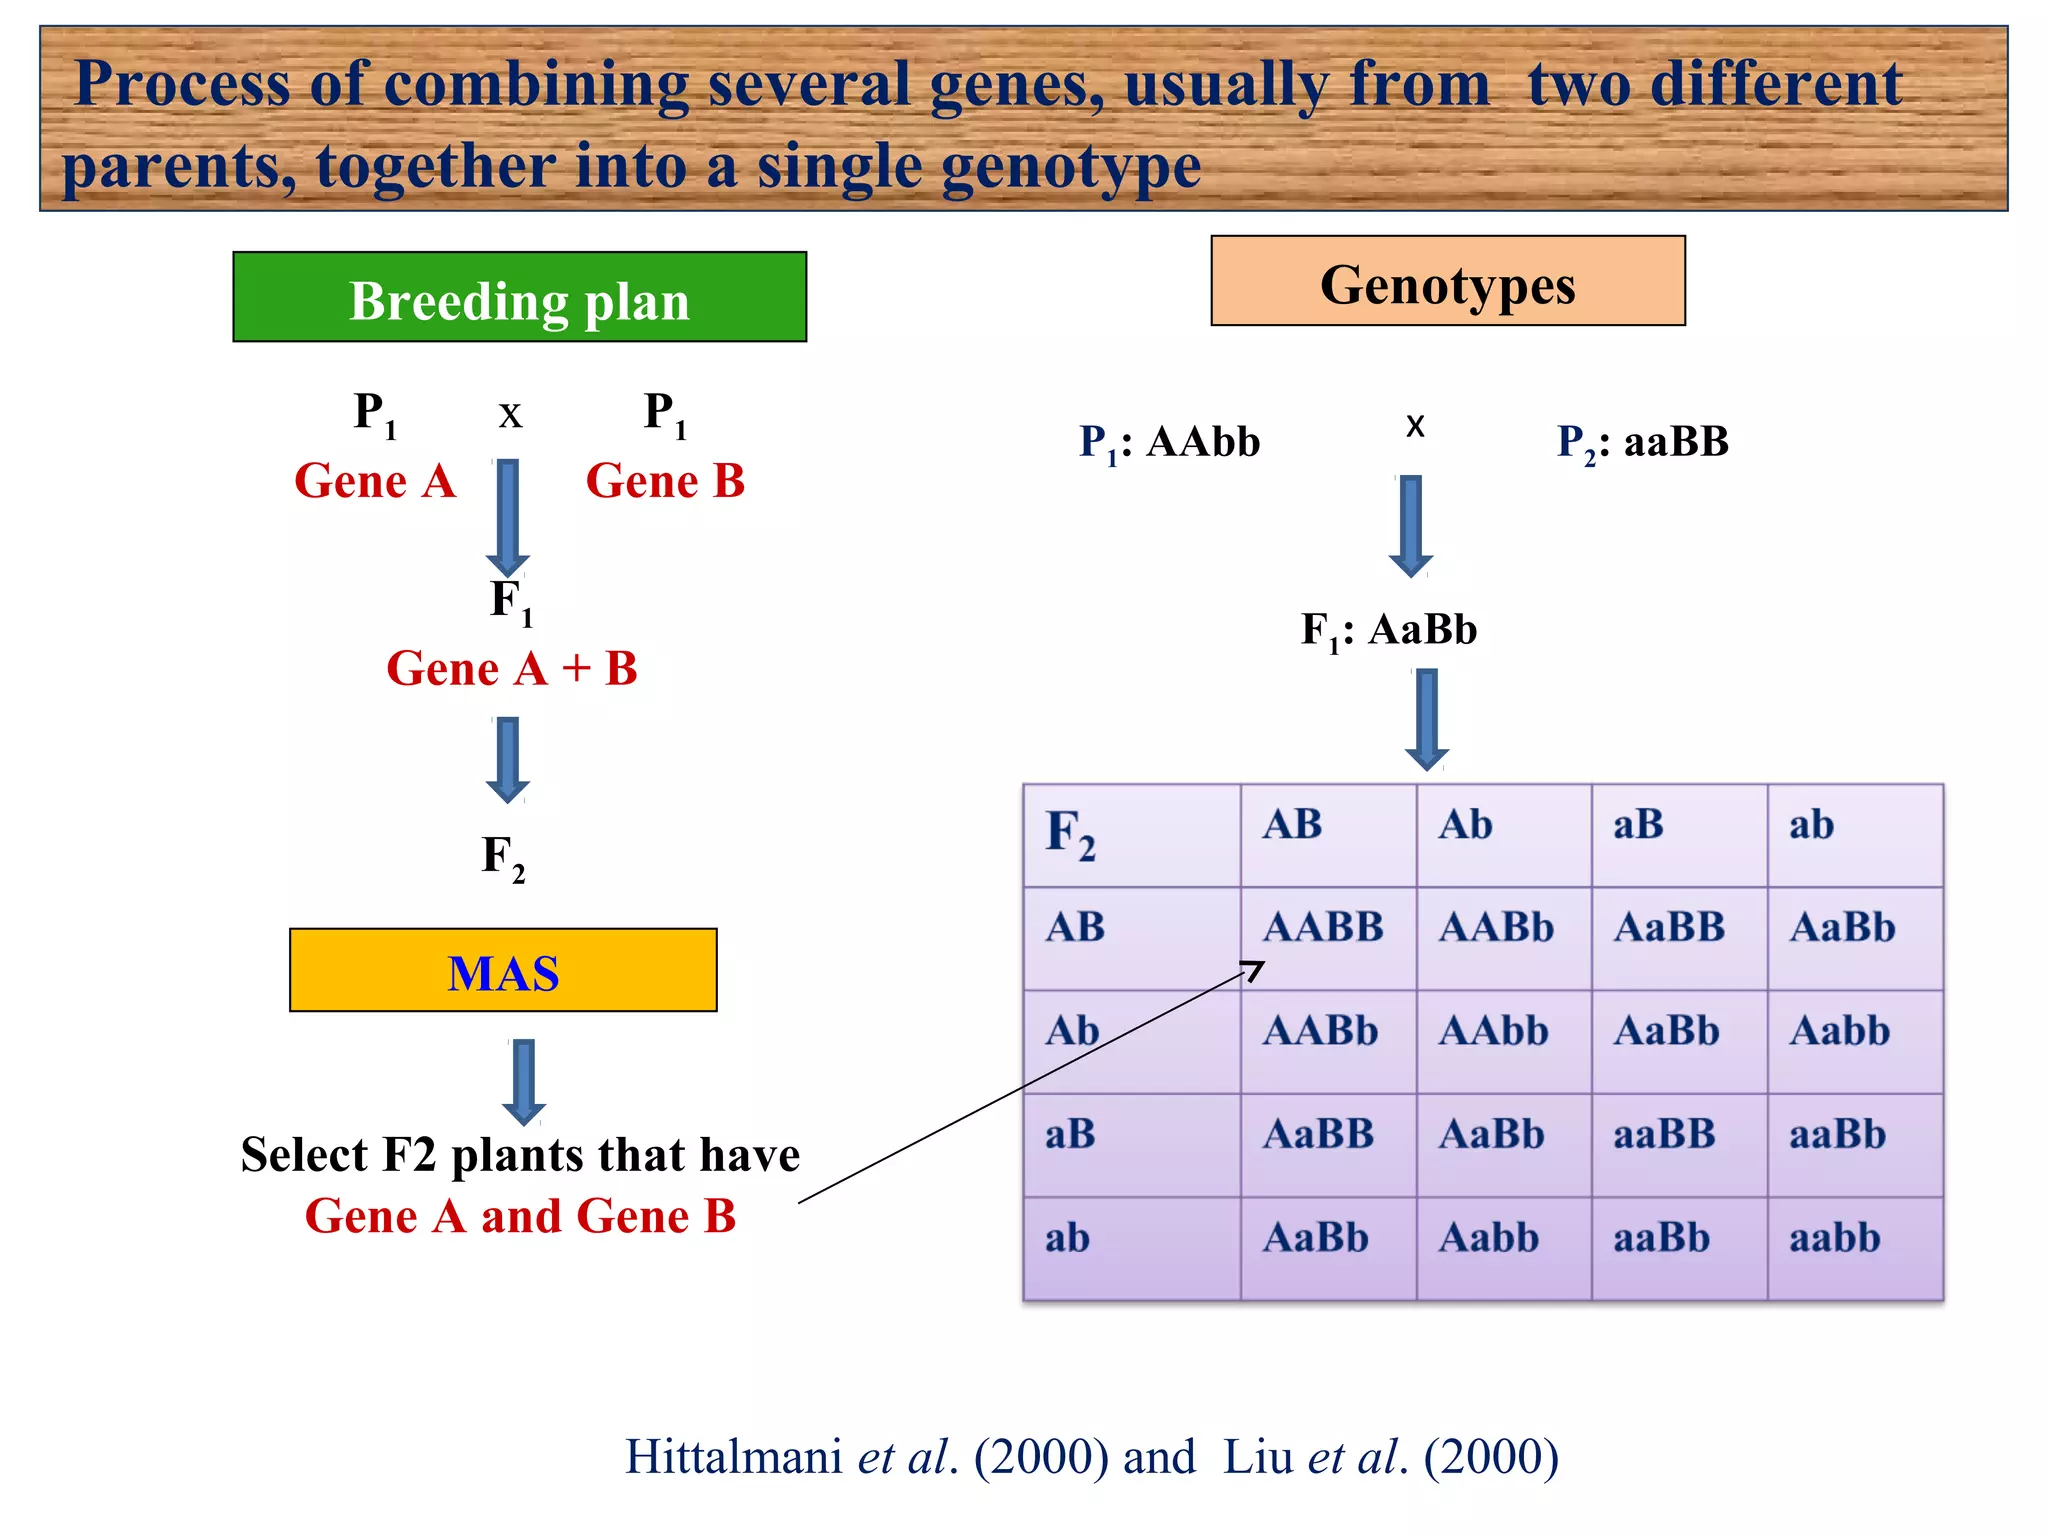
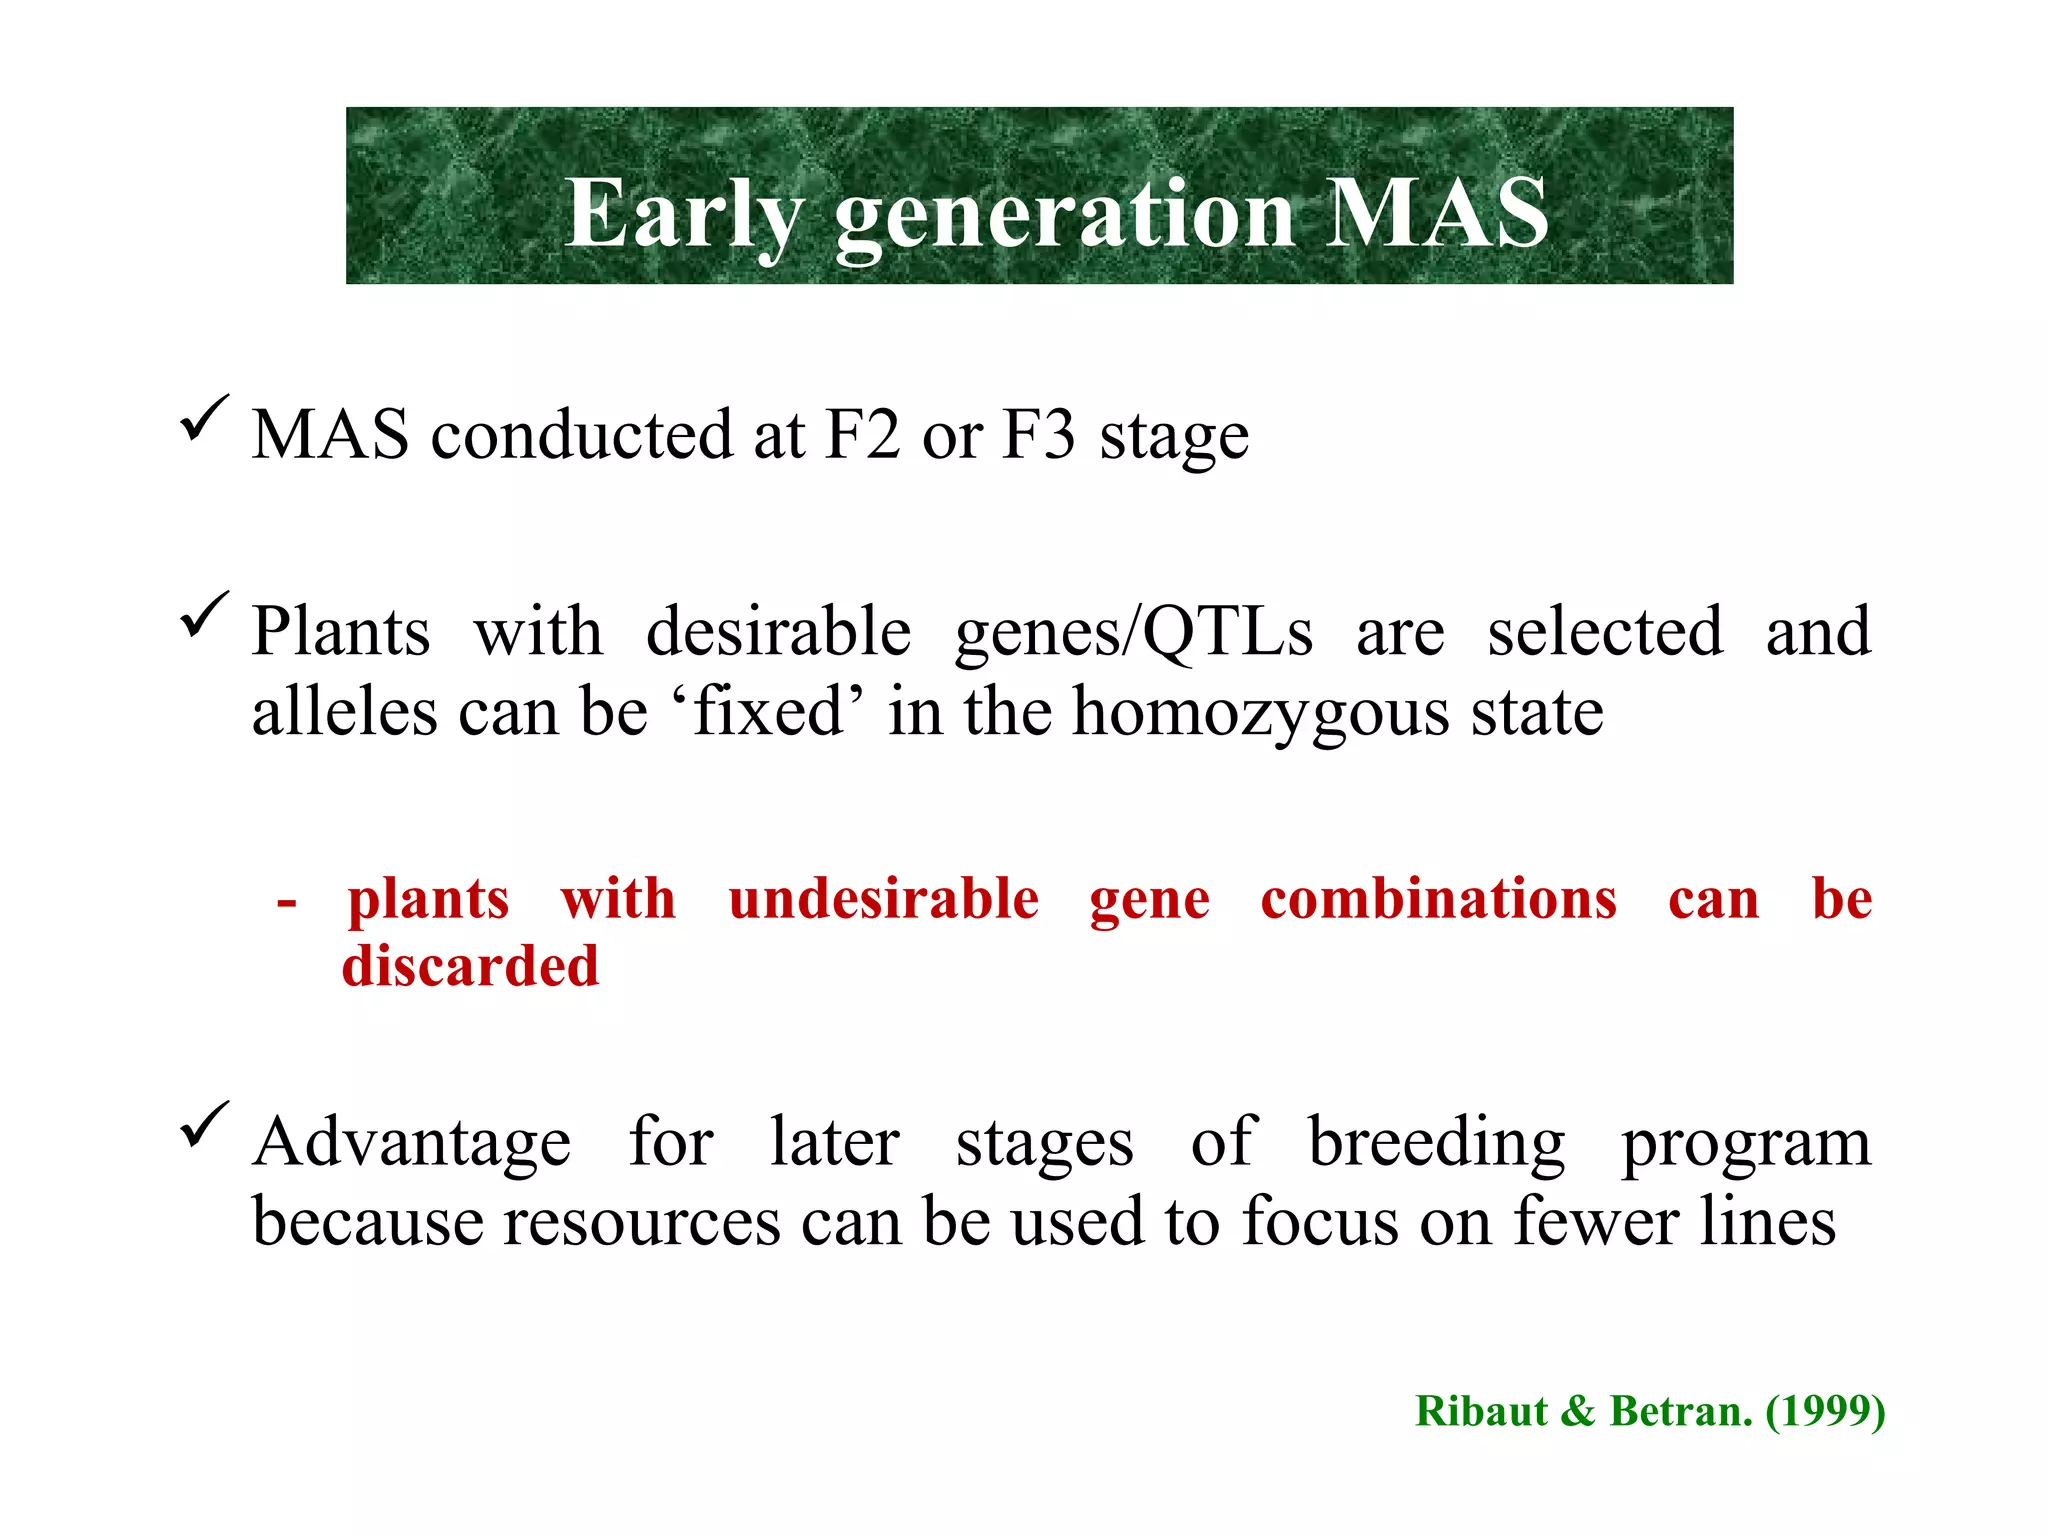
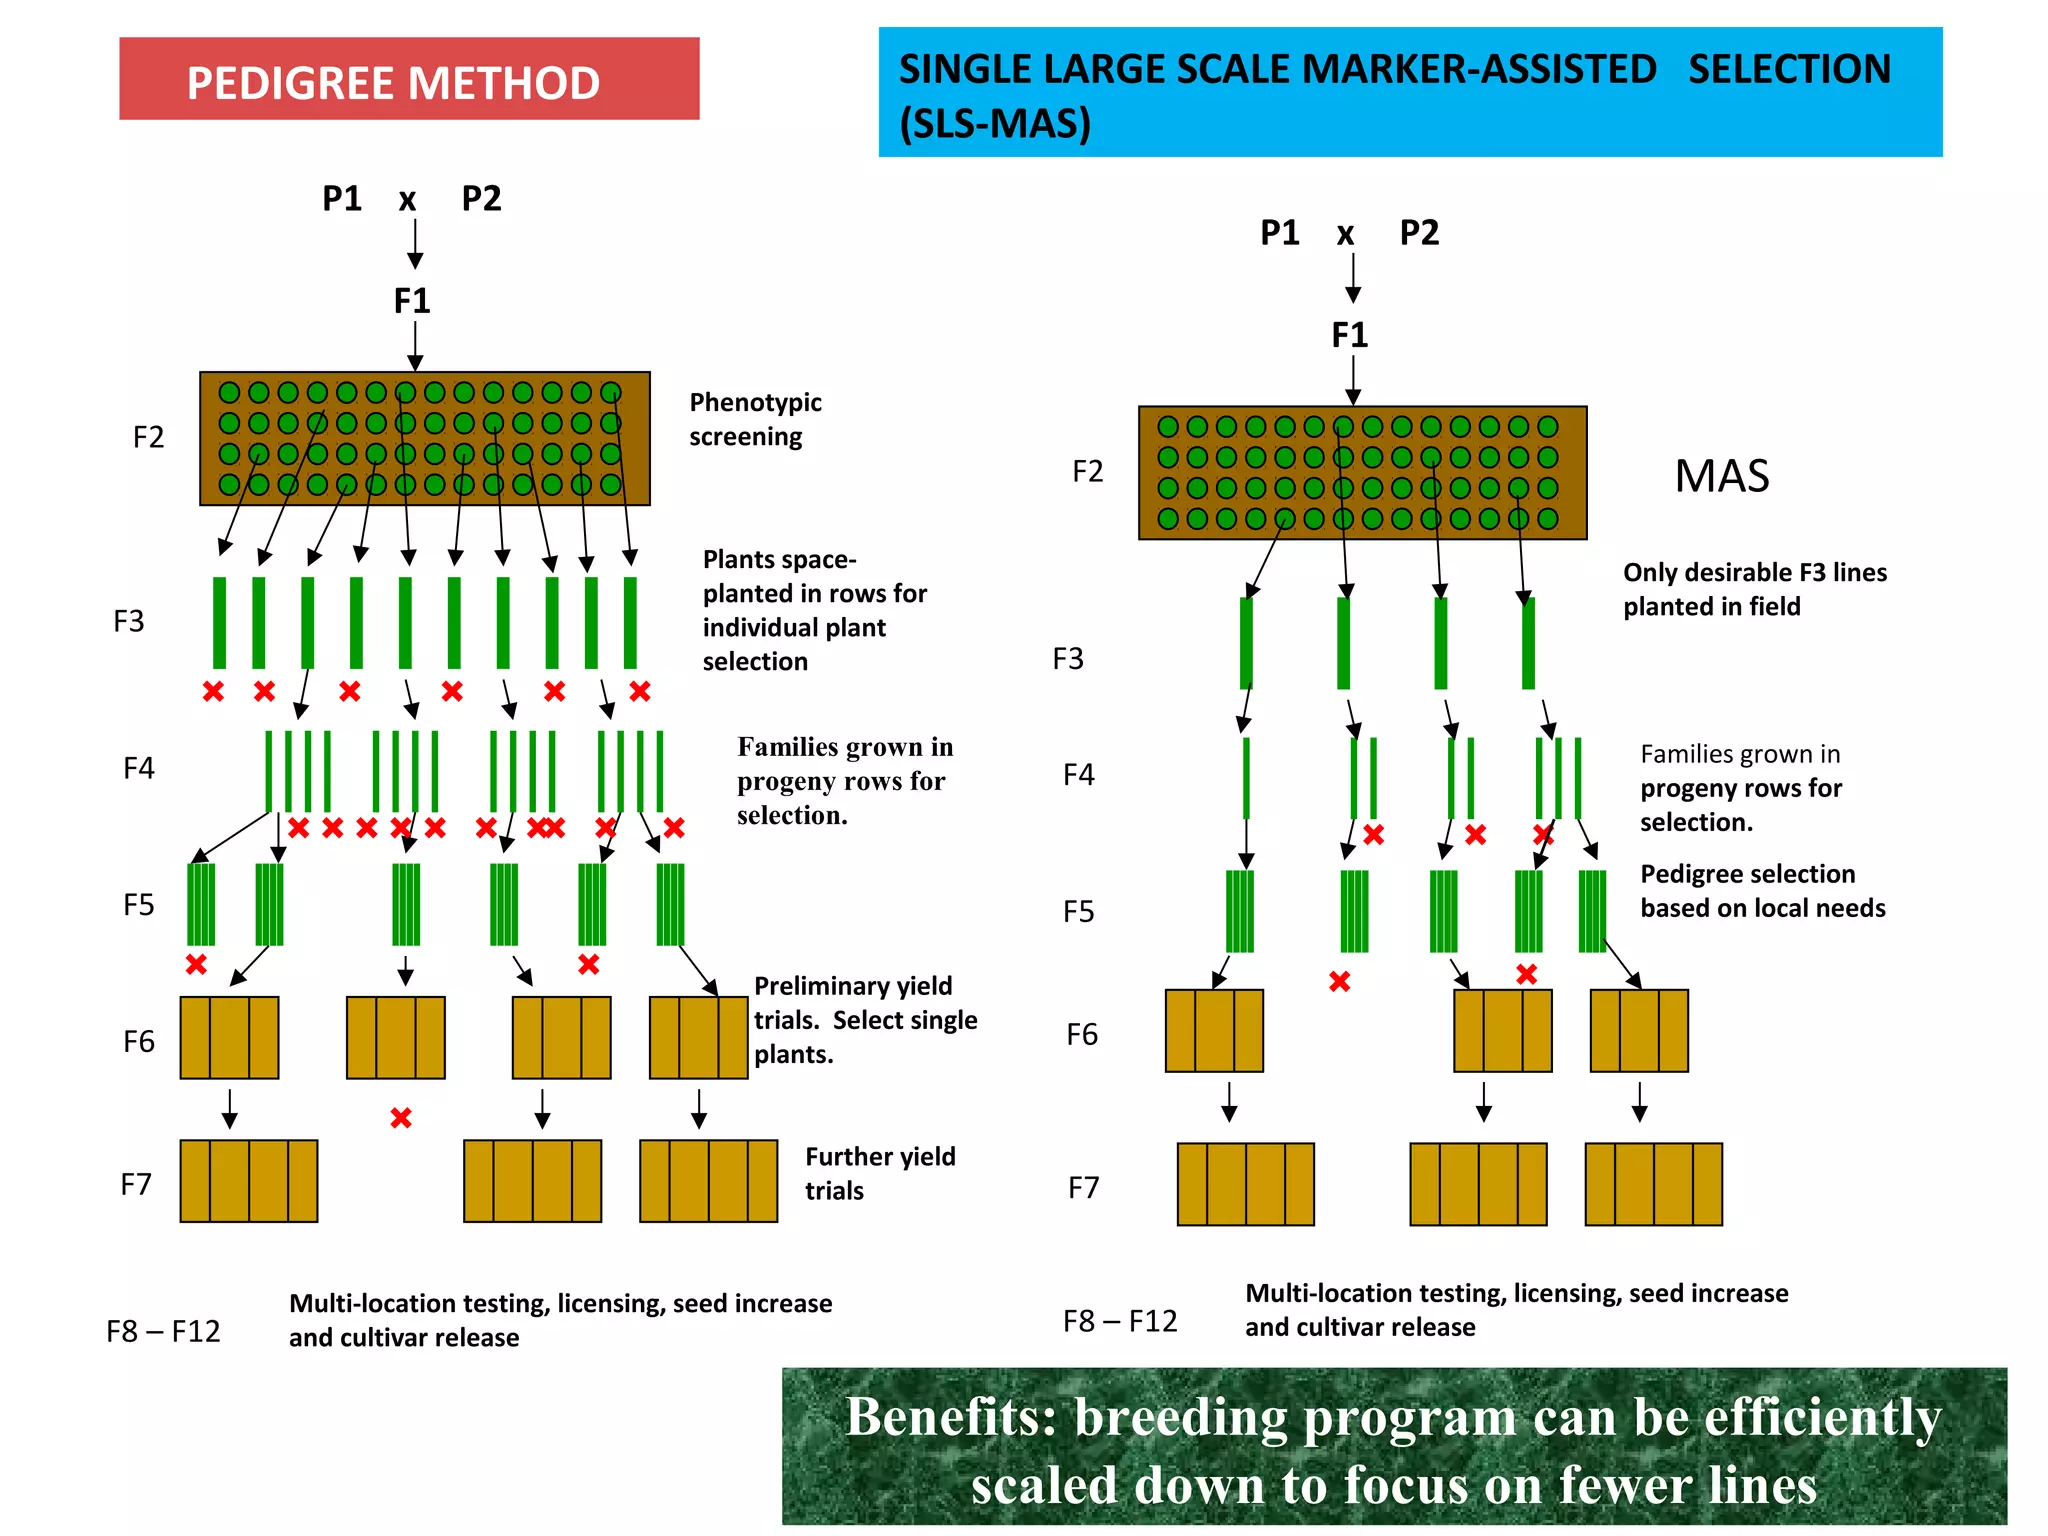
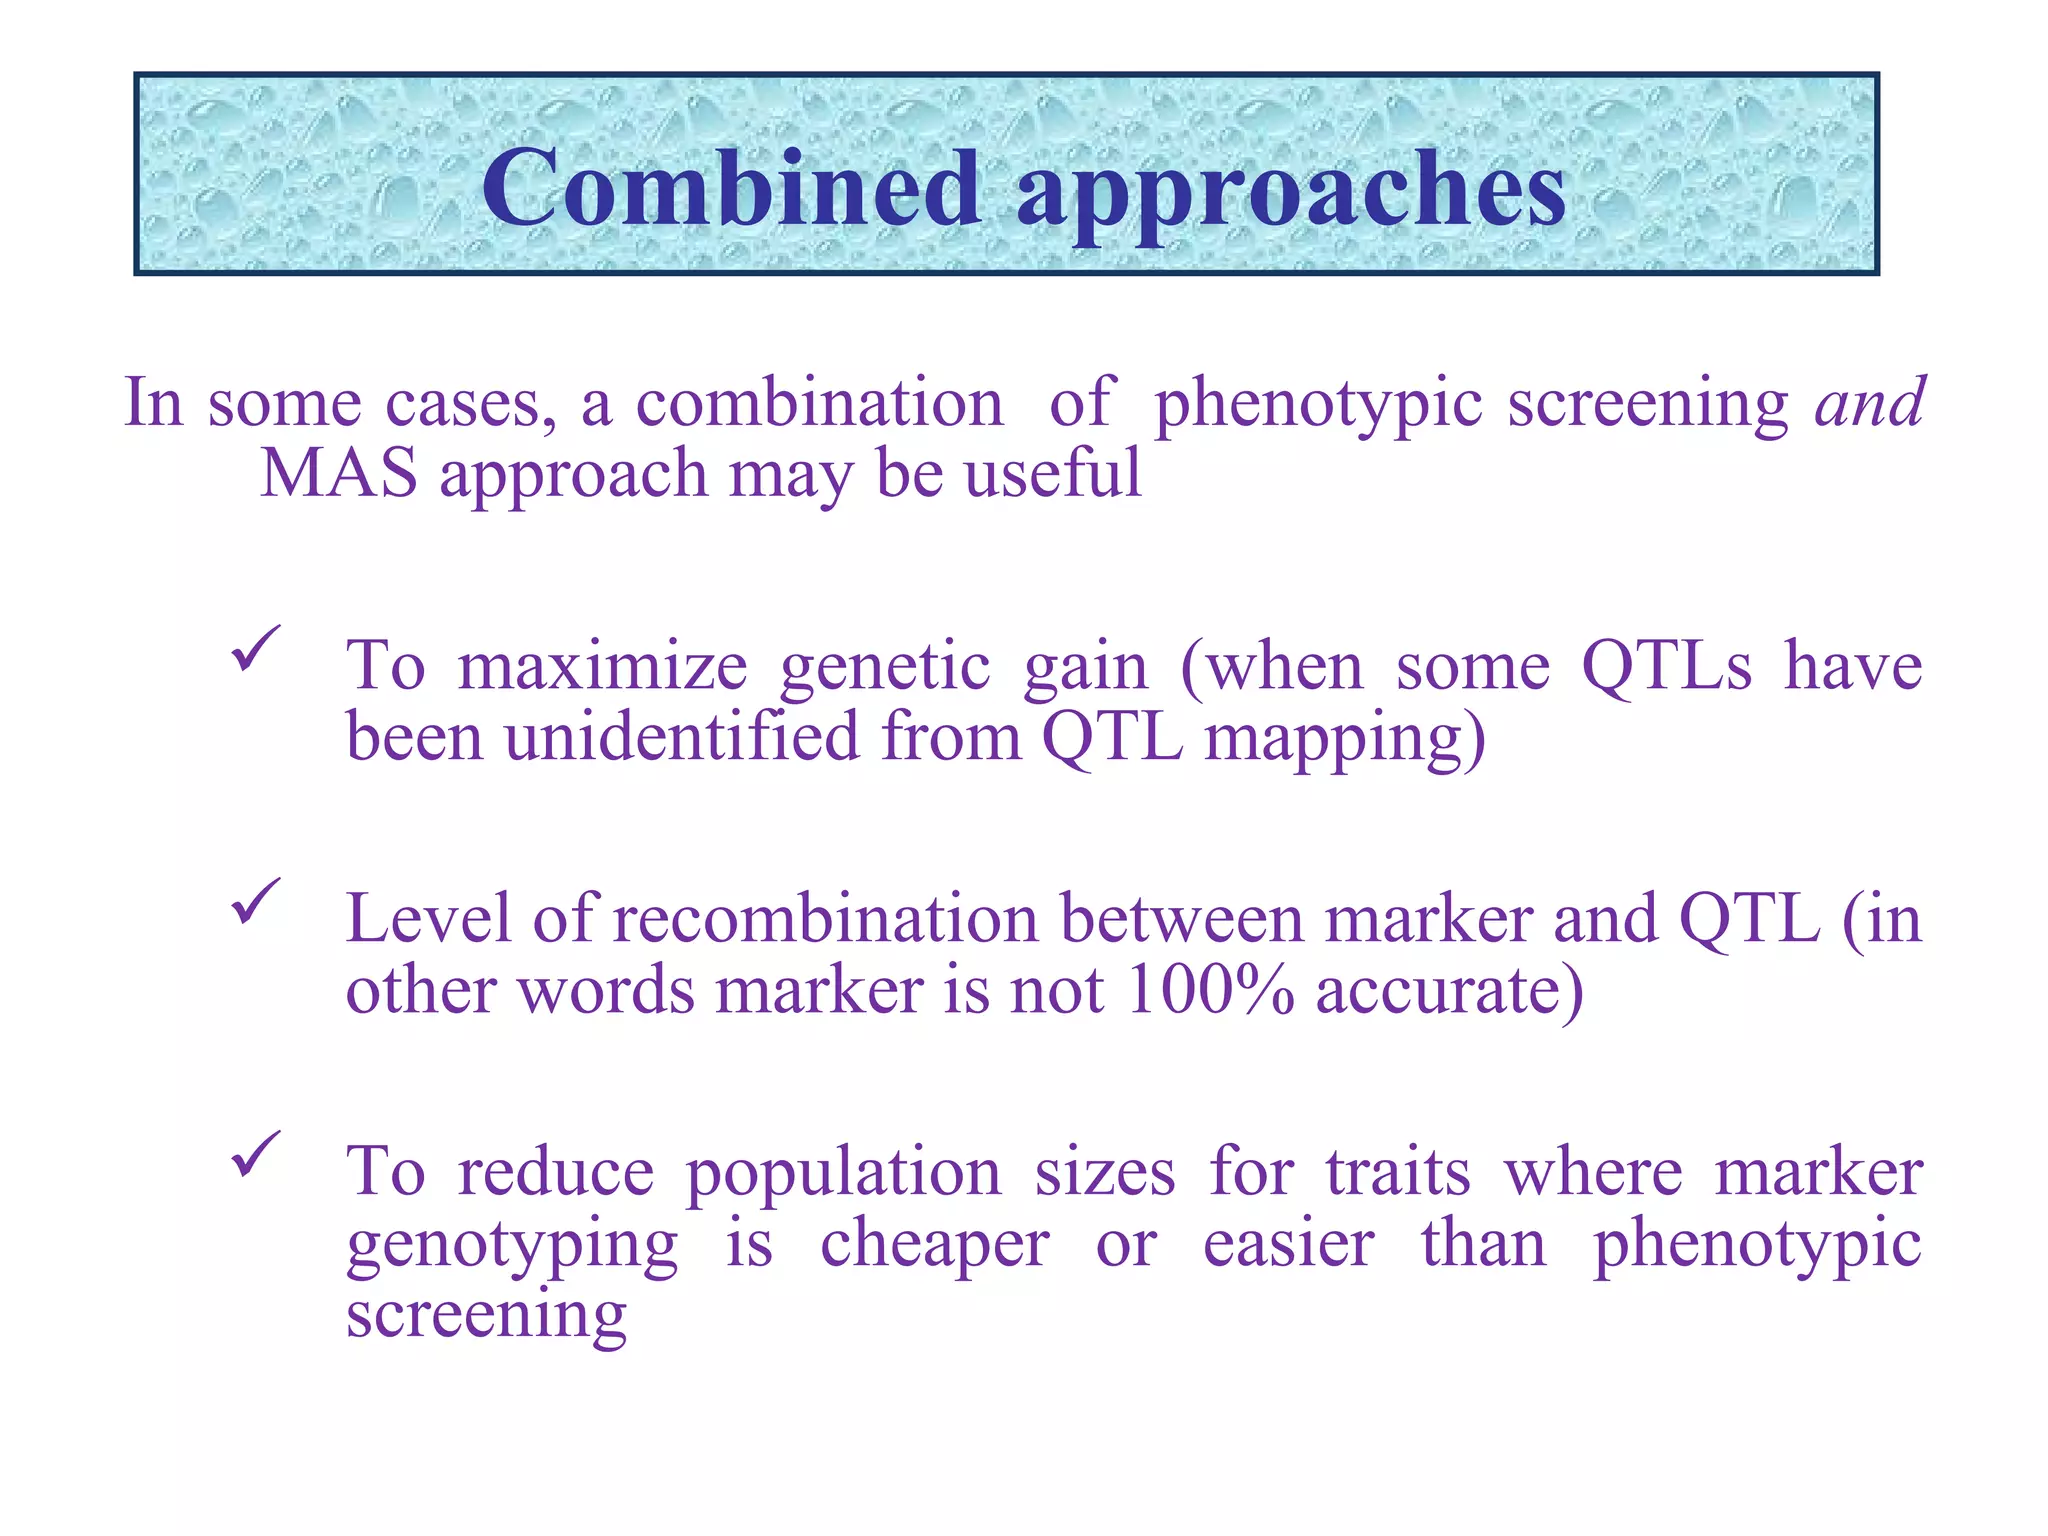
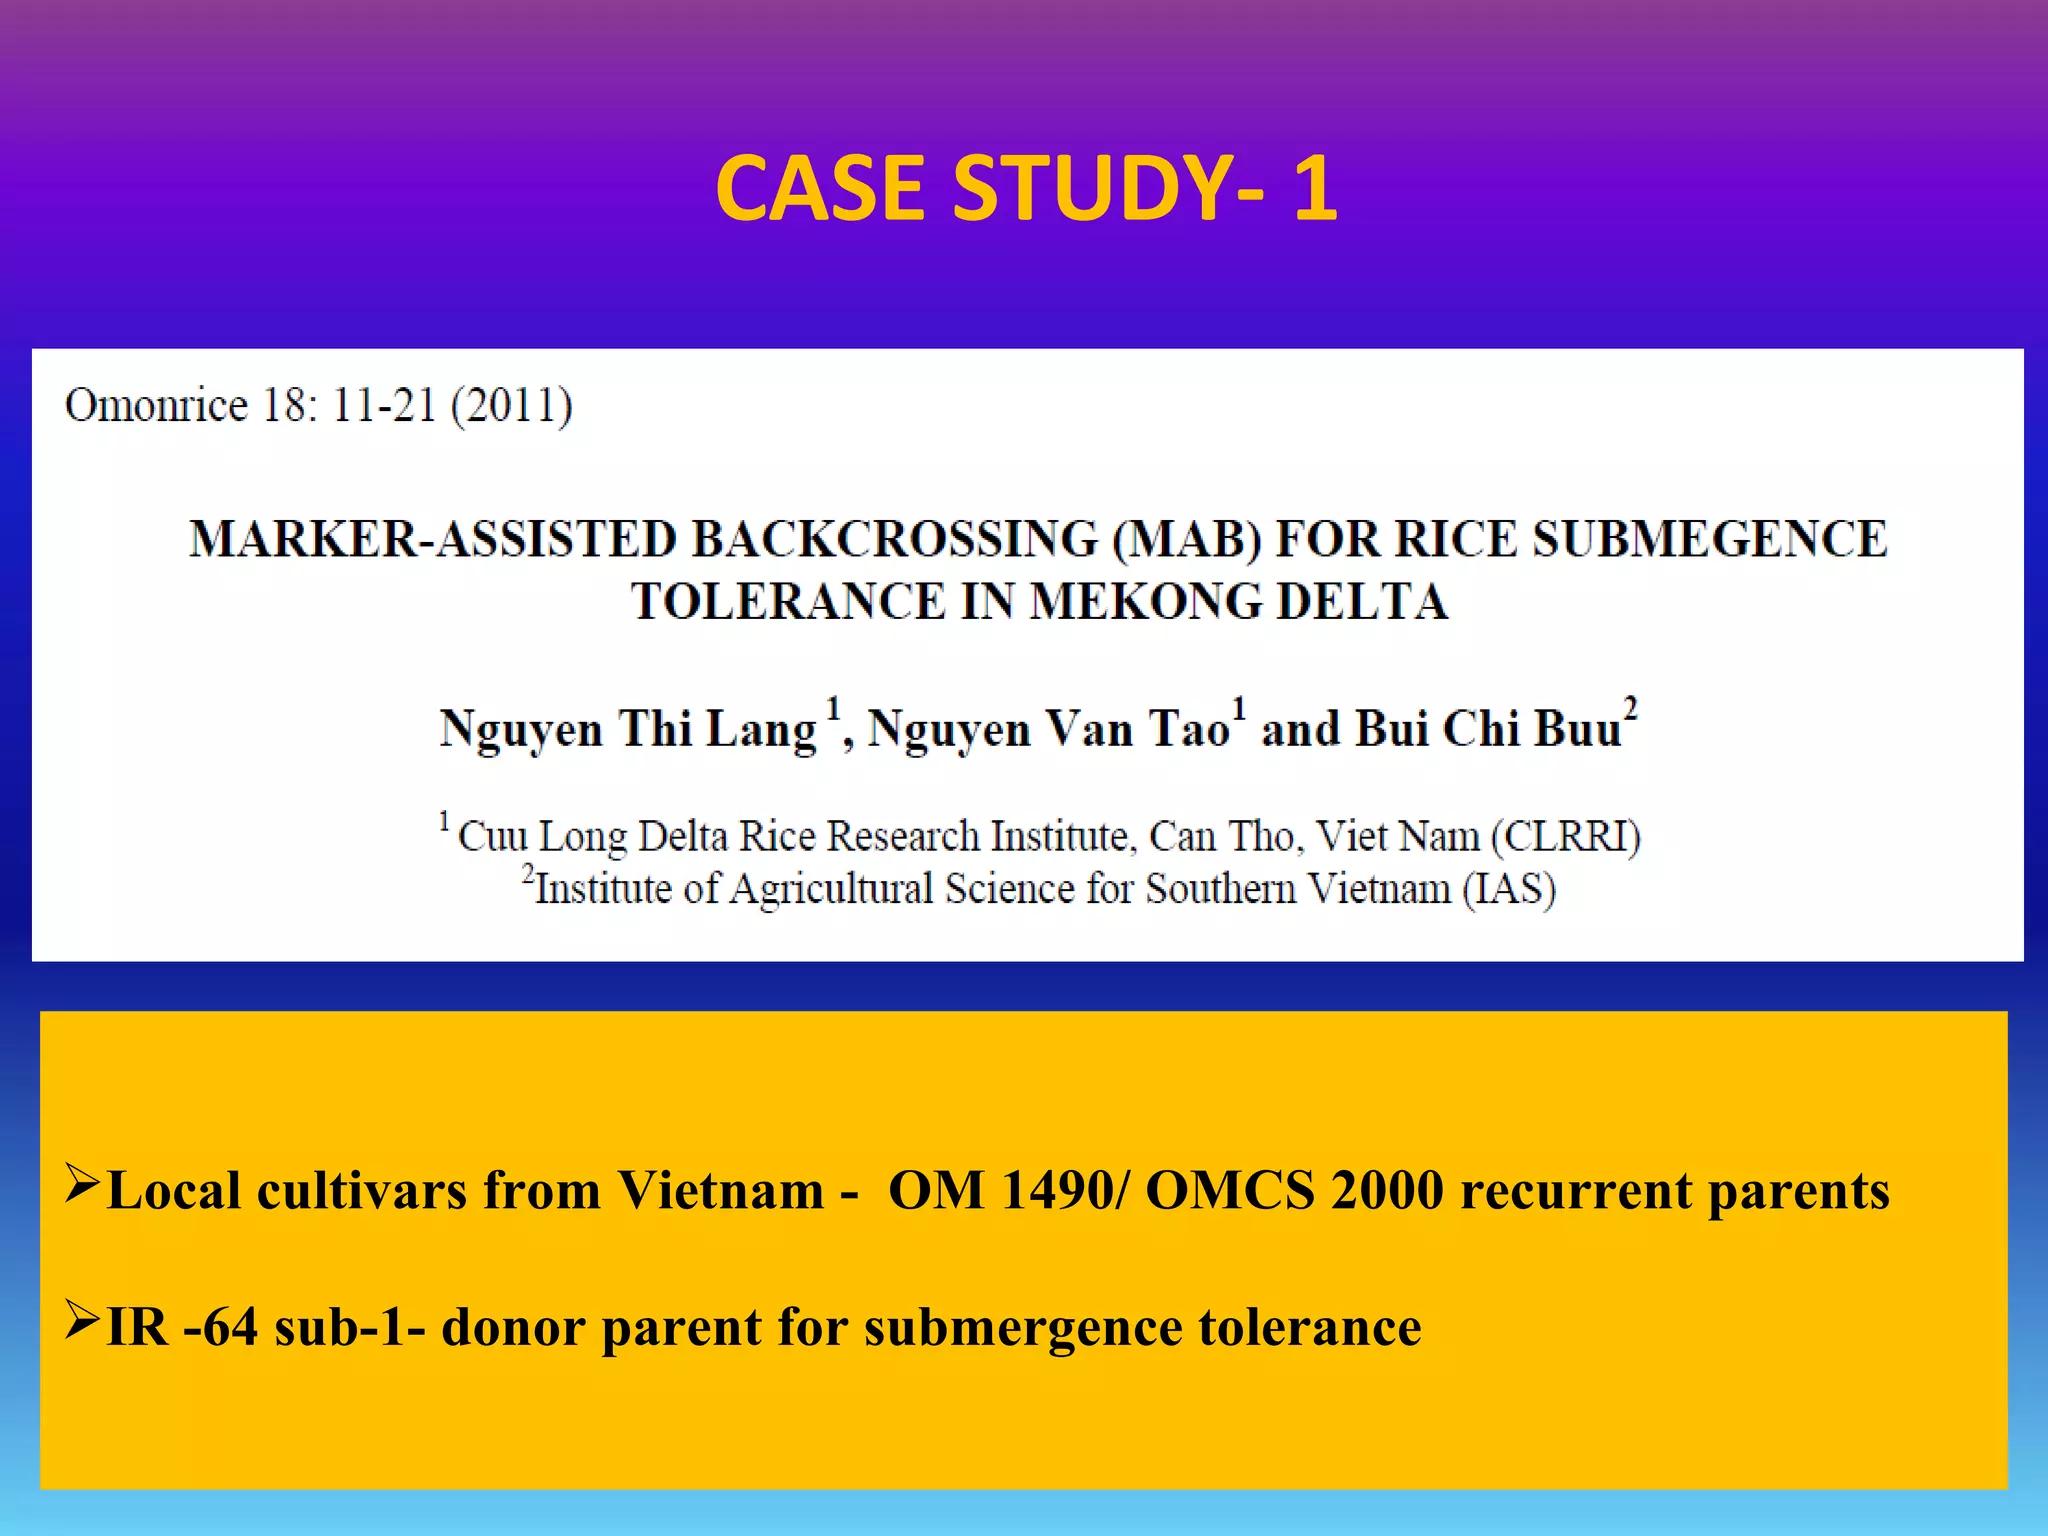
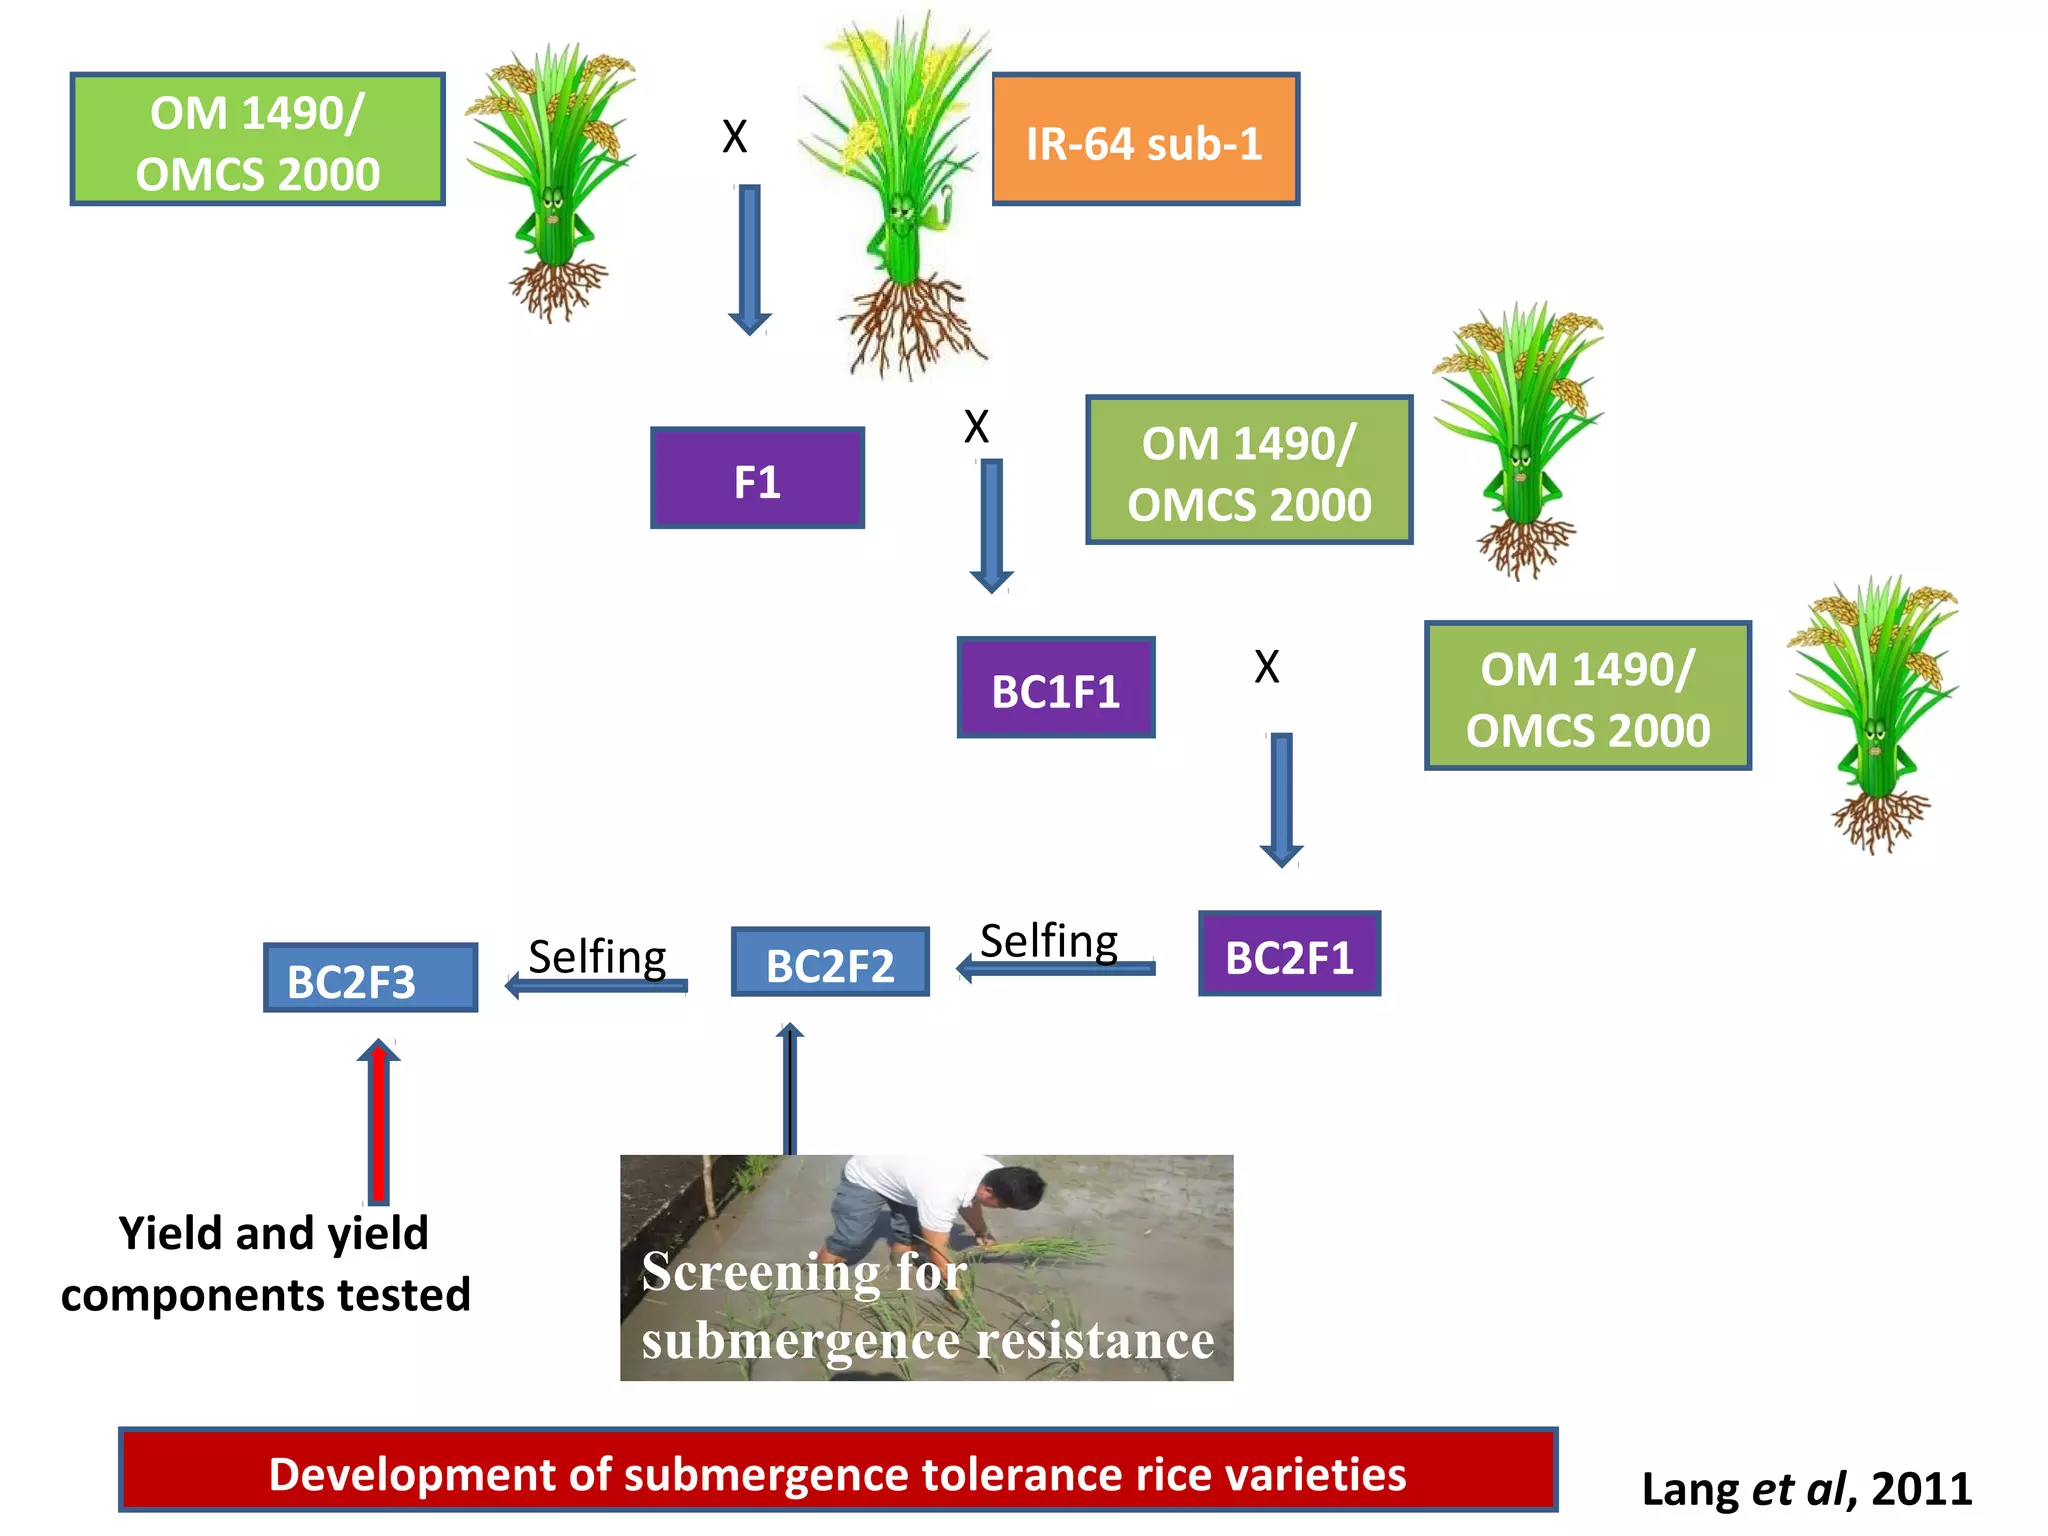
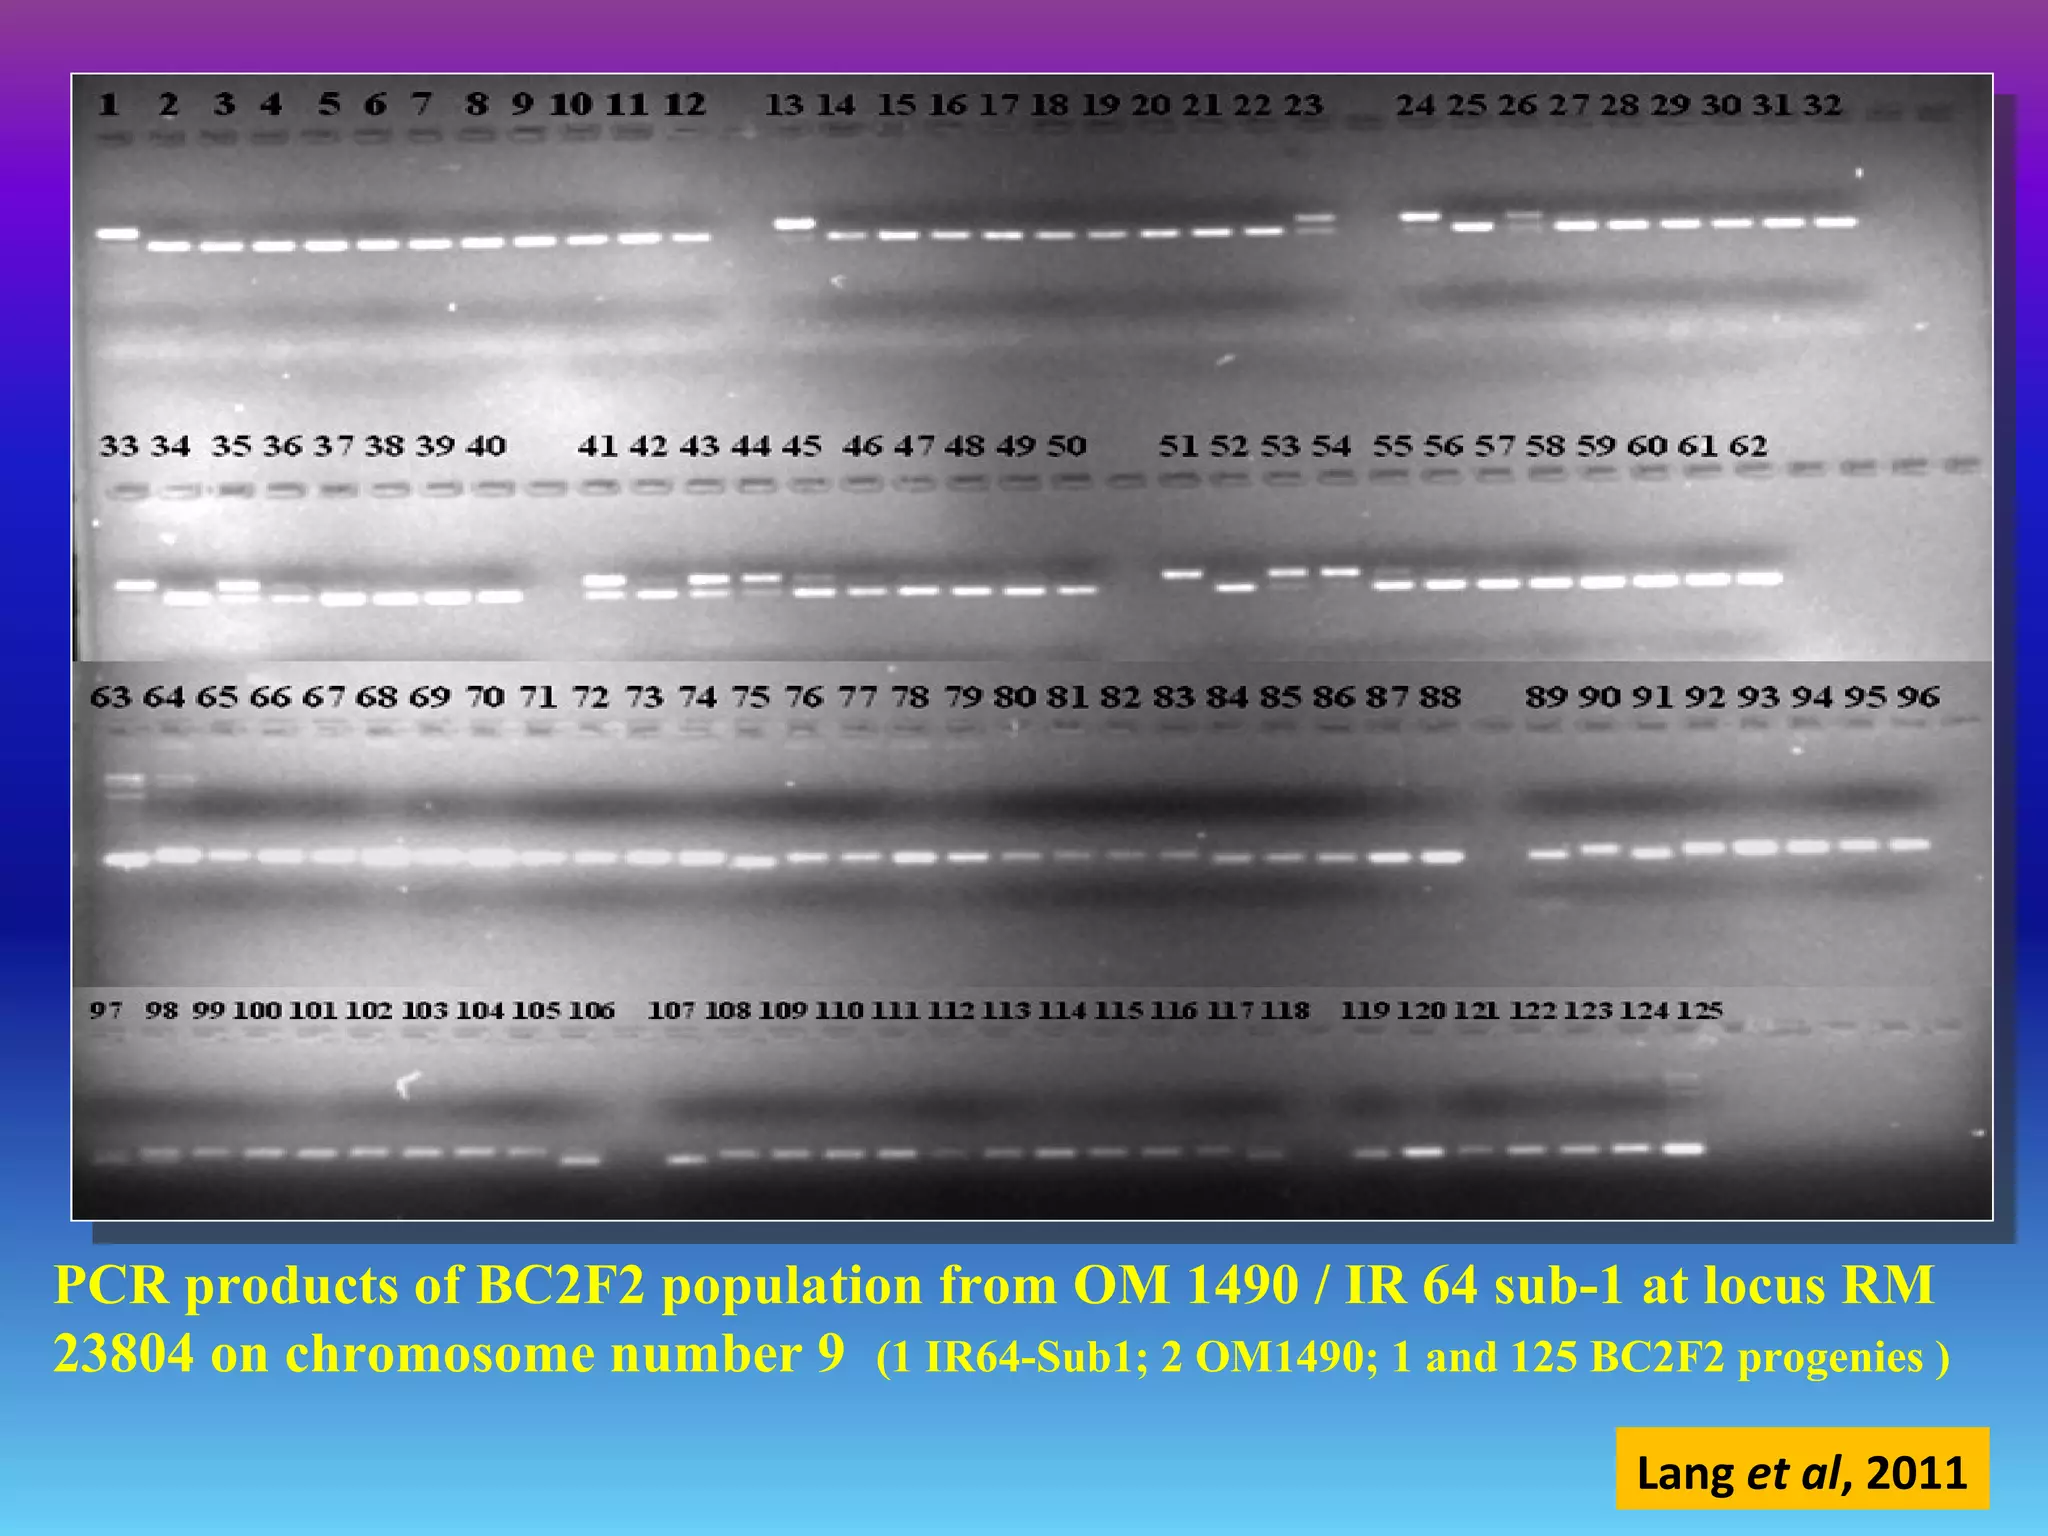
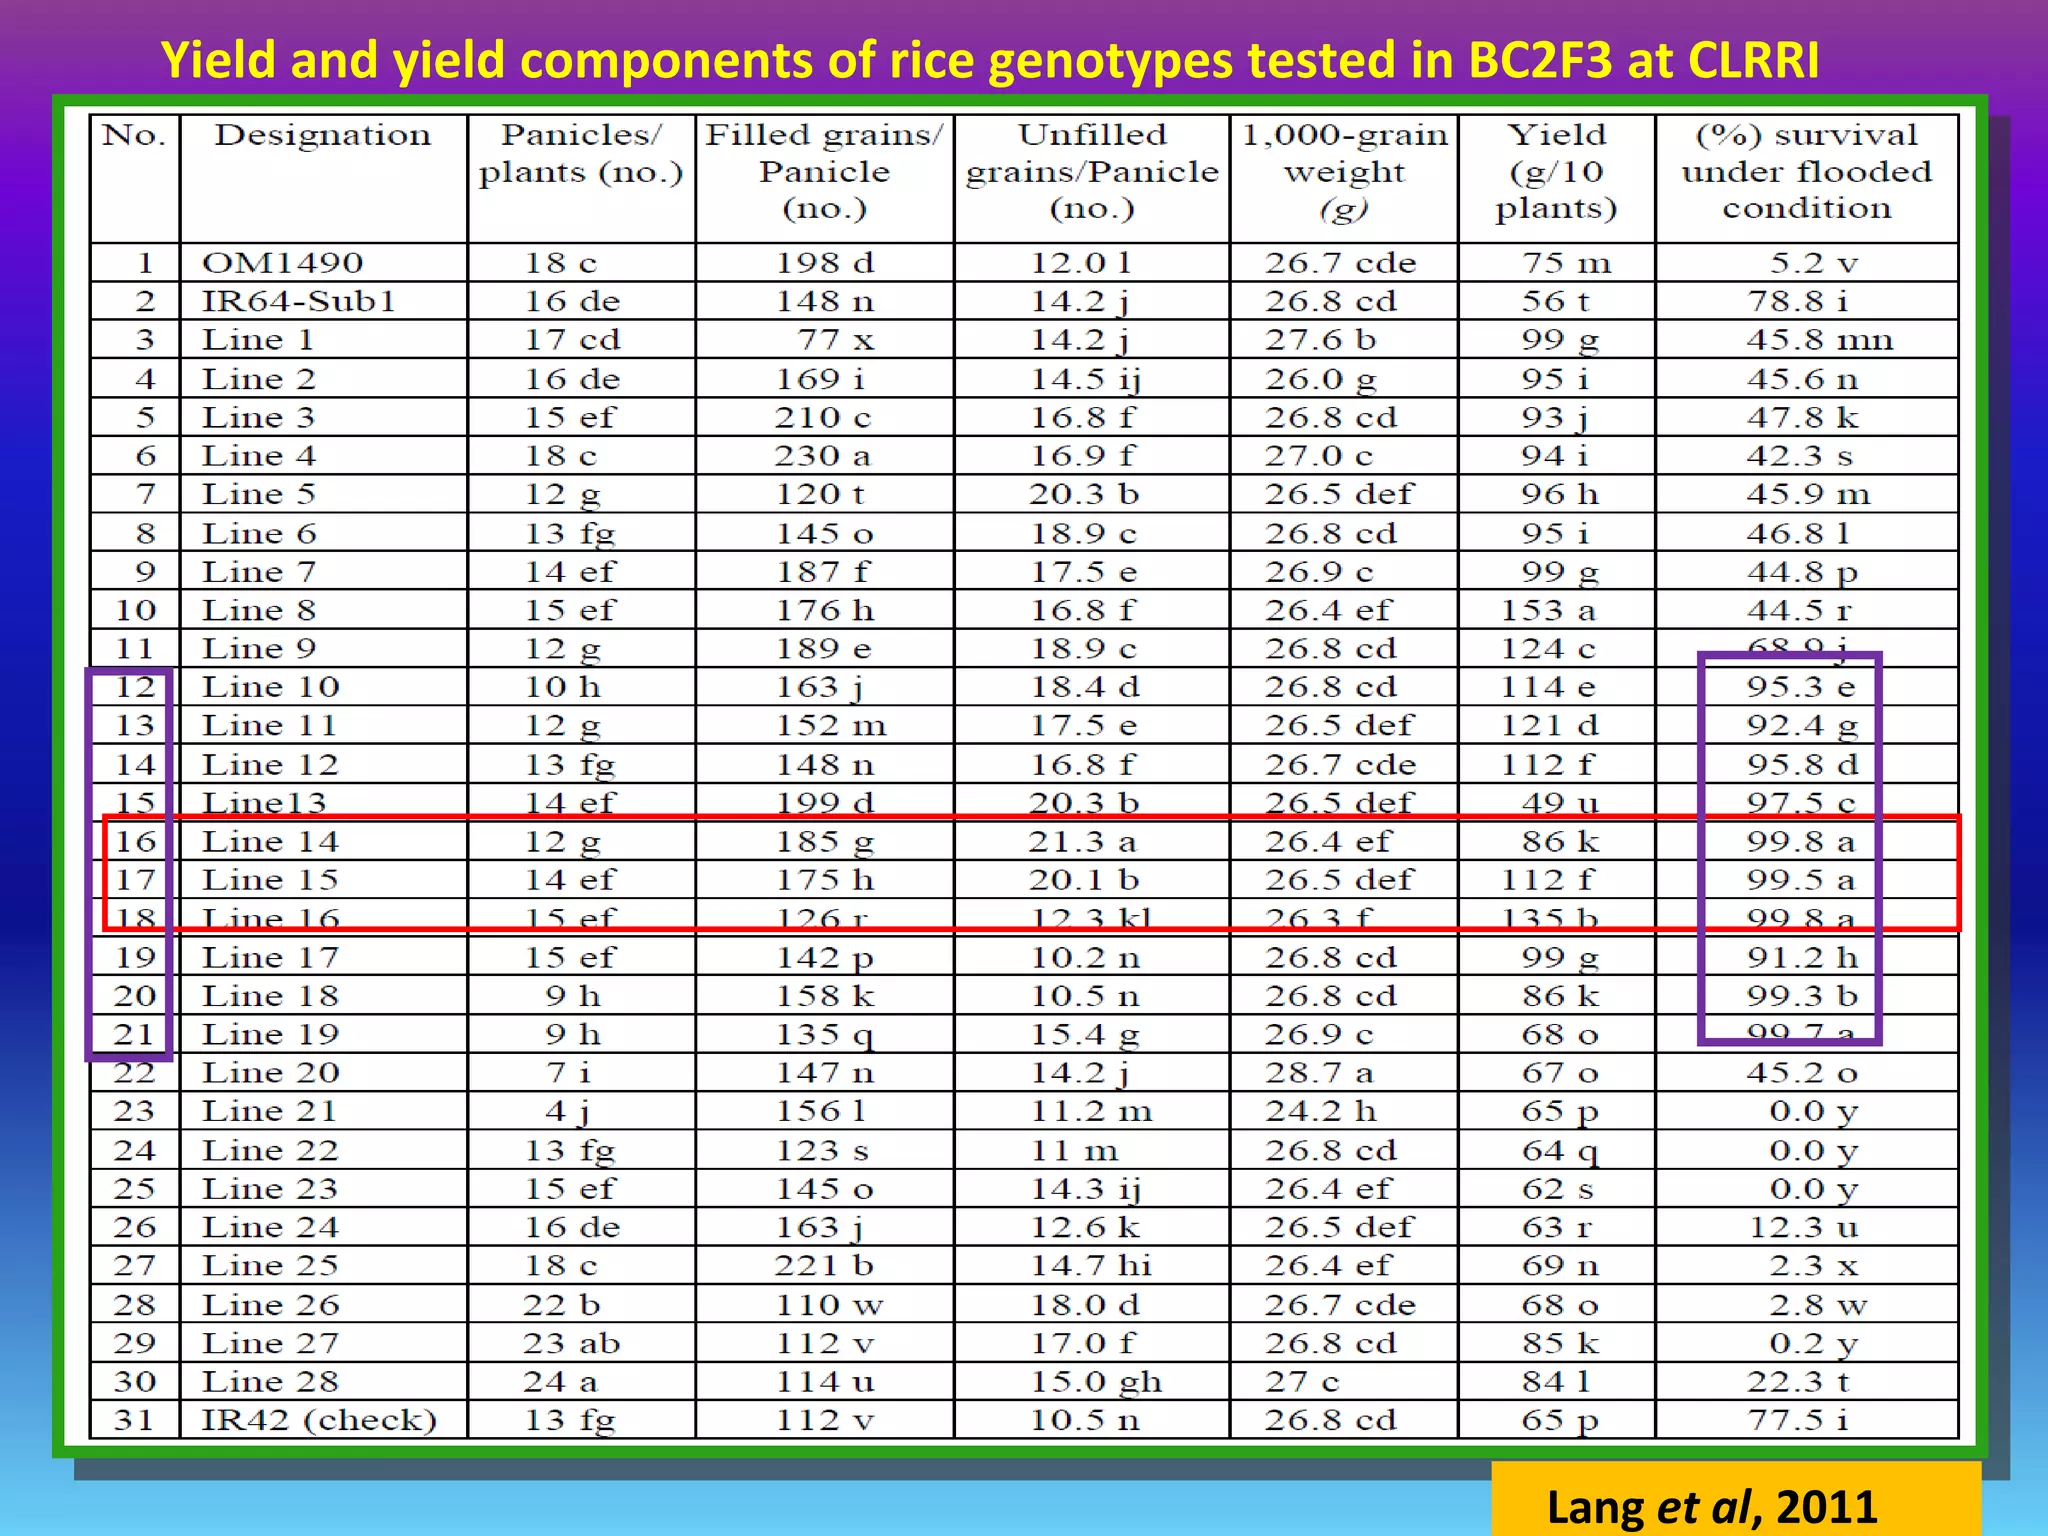
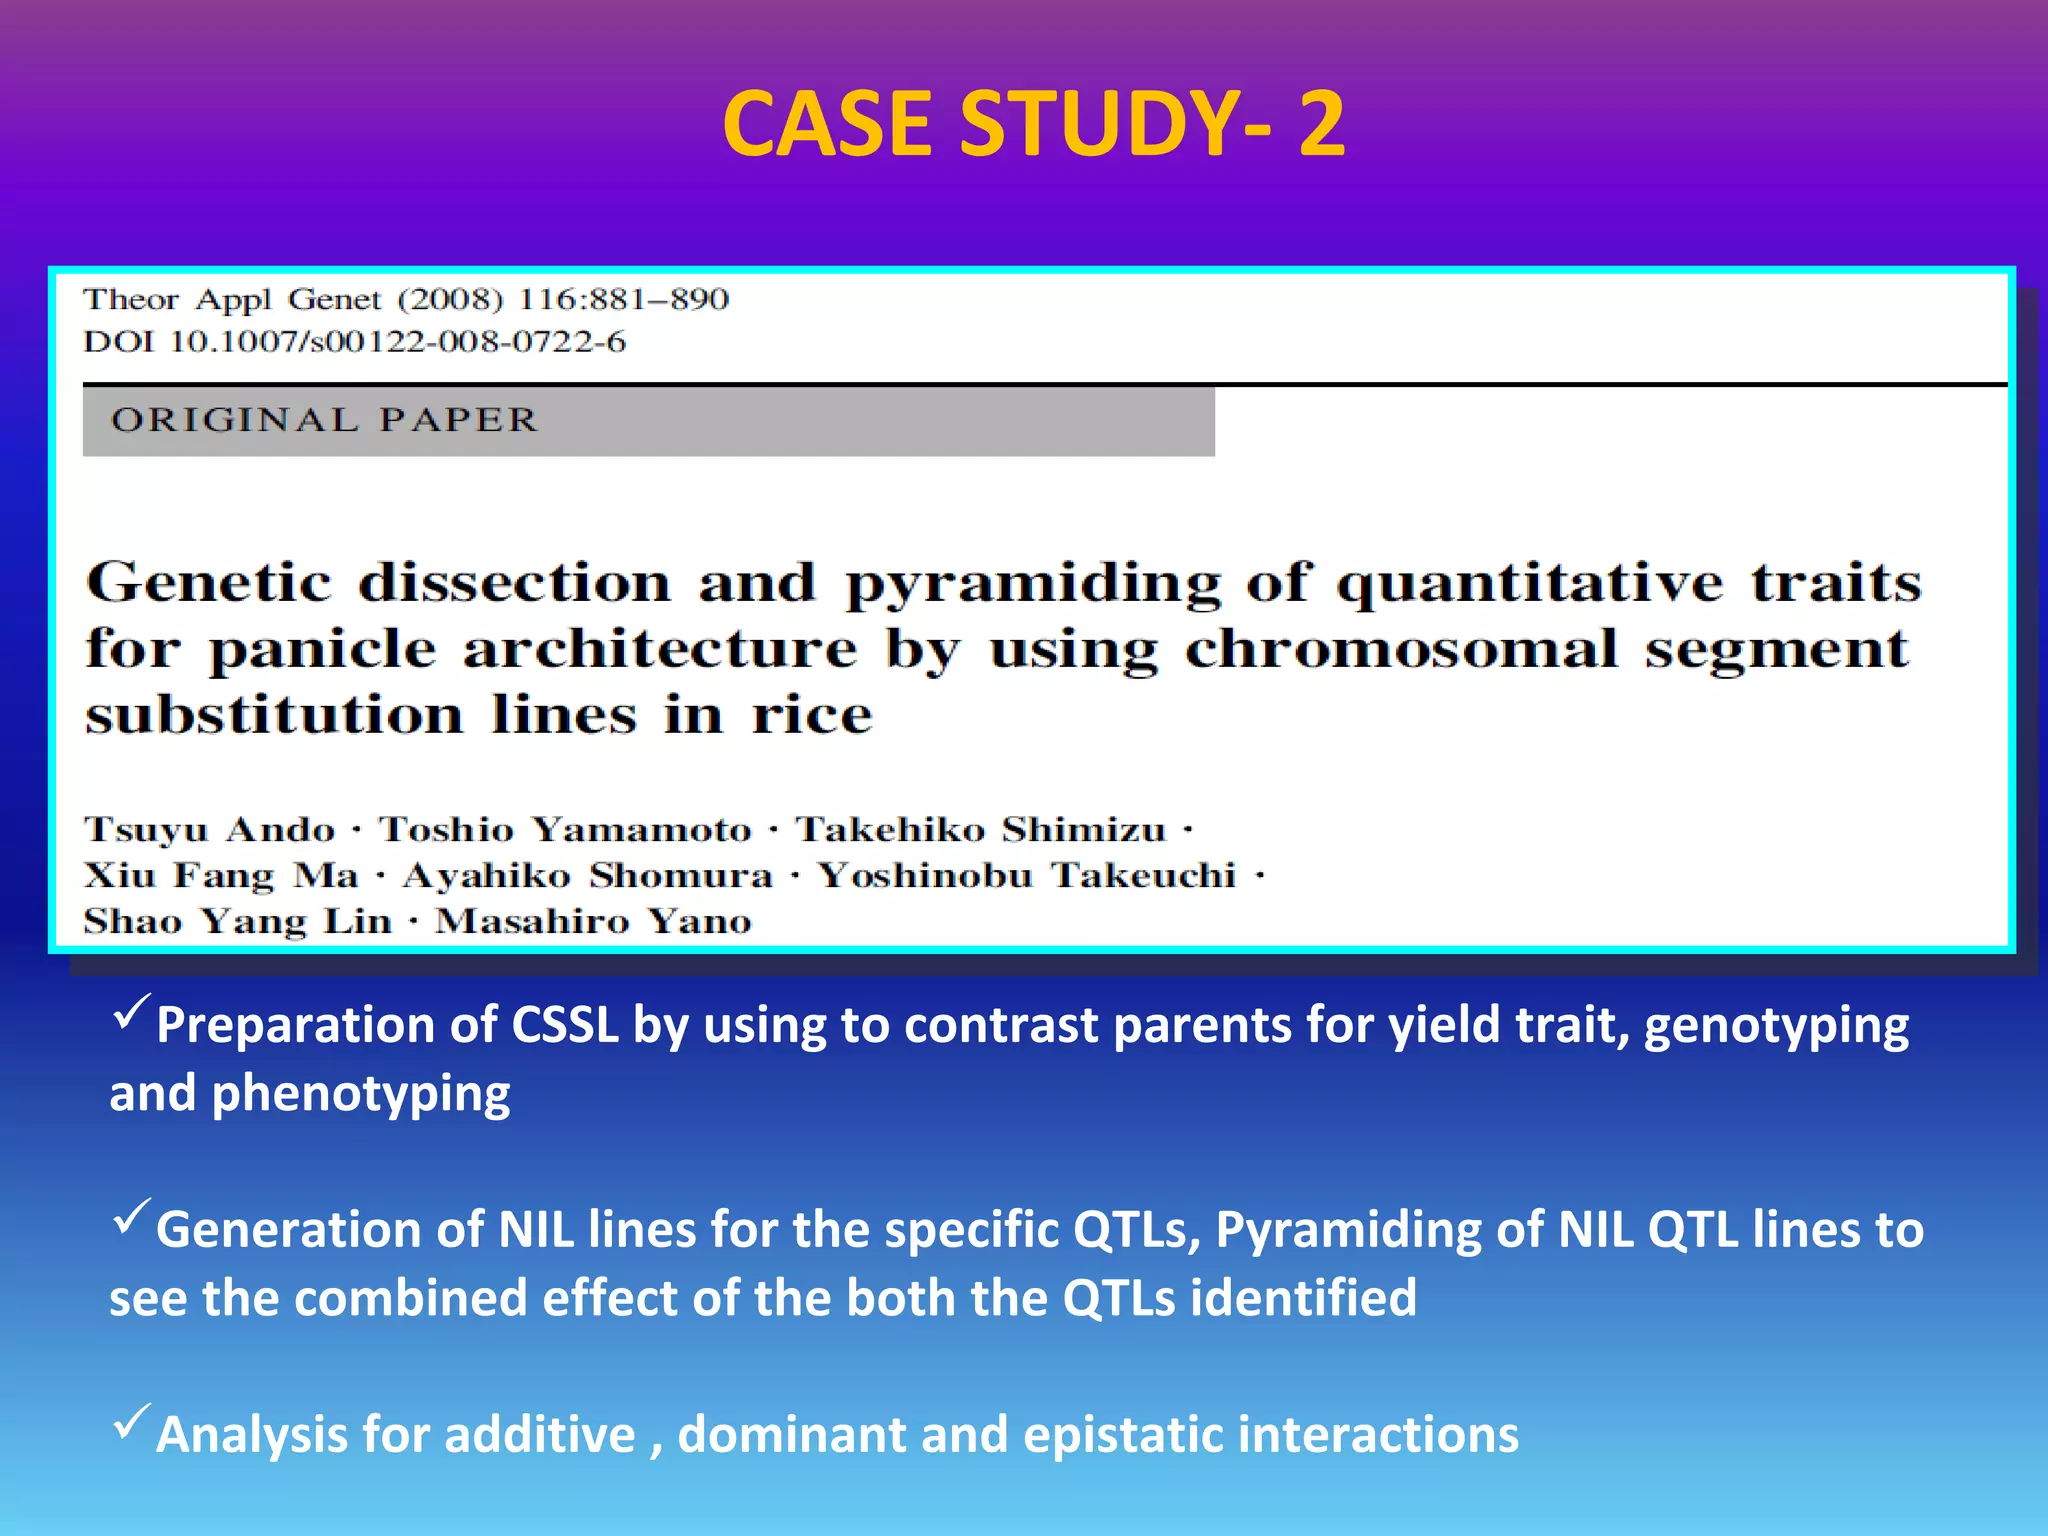
MAS refers to the use of DNA markers that are
tightly linked to target loci as a substitute for or to
assist phenotypic screening
Marker assisted selection (MAS)
Assumption: DNA markers can reliably predict phenotype
Multifactorial traits are determined by multiple genetic and
environmental factors acting together
Genetic architecture of a complex trait = specific effects and
combined interactions of all genetic and environmental factors
Quantitative traits = phenotypes differ in quantity rather
than type (such as height)
Variation in genotype can be eliminated by studying inbred
lines = homozygous for most genes, or F1 progeny of inbred
lines = uniformly heterozygous
Complete elimination of environmental variation is
impossible
Multifactorial = complex traits = quantitative traits
Considerations for using DNA
markers in plant breeding
1. Technical methodology
simple or complicated?
1. Reliability
2. Degree of polymorphism
3. DNA quality and quantity required
4. Cost
5. Available resources
Equipment, technical expertise
Collard et al., 2008
F2
P2
F1
P1
x
Large populations consisting of
thousands of plants
PHENOTYPIC SELECTION
Field trialsGlasshouse trials
DonorRecipient
Salinity screening in phytotron Bacterial blight screening Phosphorus deficiency plot
F2
P2
F1
P1 x
large populations consisting of
thousands of plants
ResistantSusceptible
MARKER-ASSISTED SELECTION (MAS)
Method whereby phenotypic selection is based on DNA markers
Advantages of MAS
Simpler method compared to phenotypic screening
Selection at seedling stage
Increased reliability
Potential benefits from MAS
More accurate and efficient selection of specific genotypes
-May lead to accelerated variety development
More efficient use of resources
-Especially field trials
Collard et al., 2008
MAS BREEDING SCHEMES
1. Marker-assisted backcrossing
2. Pyramiding
3. Early generation selection
4. ‘Combined’ approaches
Marker-assisted backcrossing (MAB)
MAB has several advantages over conventional
backcrossing:
– Effective selection of target loci
– Minimize linkage drag
– Accelerated recovery of recurrent parent
1 2 3 4
Target locus
1 2 3 4
RECOMBINANT SELECTION
1 2 3 4
BACKGROUND SELECTIONTARGET LOCUS SELECTION
FOREGROUND SELECTION BACKGROUND SELECTION
P1 x F1
P1 x P2
CONVENTIONAL BACKCROSSING
BC1
VISUAL SELECTION OF BC1 PLANTS THAT MOST CLOSELY
RESEMBLE RECURRENT PARENT
BC2
MARKER-ASSISTED BACKCROSSING
P1 x F1
P1 x P2
BC1
USE ‘BACKGROUND’ MARKERS TO SELECT PLANTS THAT HAVE
MOST RP MARKERS AND SMALLEST % OF DONOR GENOME
BC2
Pyramiding
Widely used for combining multiple disease resistance genes
for specific races of a pathogen
Pyramiding is extremely difficult to achieve using
conventional methods
- Consider: phenotyping a single plant for multiple forms of
seedling resistance – almost impossible
Important to develop ‘durable’ disease resistance against
different races
F2
F1
Gene A + B
P1
Gene A
x P1
Gene B
MAS
Select F2 plants that have
Gene A and Gene B
Genotypes
P1: AAbb P2: aaBB
F1: AaBb
Process of combining several genes, usually from two different
parents, together into a single genotype
x
Breeding plan
Hittalmani et al. (2000) and Liu et al. (2000)
Early generation MAS
 MAS conducted at F2 or F3 stage
 Plants with desirable genes/QTLs are selected and
alleles can be ‘fixed’ in the homozygous state
- plants with undesirable gene combinations can be
discarded
 Advantage for later stages of breeding program
because resources can be used to focus on fewer lines
Ribaut & Betran. (1999)
P1 x P2
F1
PEDIGREE METHOD
F2
F3
F4
F5
F6
F7
F8 – F12
Phenotypic
screening
Plants space-
planted in rows for
individual plant
selection
Families grown in
progeny rows for
selection.
Preliminary yield
trials. Select single
plants.
Further yield
trials
Multi-location testing, licensing, seed increase
and cultivar release
P1 x P2
F1
F2
F3
MAS
SINGLE LARGE SCALE MARKER-ASSISTED SELECTION
(SLS-MAS)
F4
Families grown in
progeny rows for
selection.
Pedigree selection
based on local needs
F6
F7
F5
F8 – F12
Multi-location testing, licensing, seed increase
and cultivar release
Only desirable F3 lines
planted in field
Benefits: breeding program can be efficiently
scaled down to focus on fewer lines
Combined approaches
In some cases, a combination of phenotypic screening and
MAS approach may be useful
 To maximize genetic gain (when some QTLs have
been unidentified from QTL mapping)
 Level of recombination between marker and QTL (in
other words marker is not 100% accurate)
 To reduce population sizes for traits where marker
genotyping is cheaper or easier than phenotypic
screening
Local cultivars from Vietnam - OM 1490/ OMCS 2000 recurrent parents
IR -64 sub-1- donor parent for submergence tolerance
CASE STUDY- 1
OM 1490/
OMCS 2000
X IR-64 sub-1
X OM 1490/
OMCS 2000
BC1F1 X OM 1490/
OMCS 2000
BC2F1Selfing
BC2F2BC2F3
Selfing
Yield and yield
components tested
Lang et al, 2011
Screening for
submergence resistance
F1
Development of submergence tolerance rice varieties
PCR products of BC2F2 population from OM 1490 / IR 64 sub-1 at locus RM
23804 on chromosome number 9 (1 IR64-Sub1; 2 OM1490; 1 and 125 BC2F2 progenies )
Lang et al, 2011
Yield and yield components of rice genotypes tested in BC2F3 at CLRRI
Lang et al, 2011
Preparation of CSSL by using to contrast parents for yield trait, genotyping
and phenotyping
Generation of NIL lines for the specific QTLs, Pyramiding of NIL QTL lines to
see the combined effect of the both the QTLs identified
Analysis for additive , dominant and epistatic interactions
CASE STUDY- 2
Strategies for development of CSSL
(31)BIL
Genotyping with 236 RFLP markers
30 lines
Genotyped with 116 SSR
markers distributed uniformly
at an interval of 2.6 Mb
Ando et al., 2008
Graphical representation of genotype of whole chromosomes in
the
CSSLs developed
Ando et al., 2008
Ando et al., 2008
Chromosomal locations of QTLs for panicle architecture
(QTLs detected in 2004 and 2005)
Development of QTL -NILs
Ando et al., 2008
Sasanishiki X BIL-8
F1 X sasanishiki
BC1F3
NIL for SBN1
Sasanishiki X BIL-21
F1 X sasanishiki
BC1F1 X sasanishiki
BC1F1
BC2F1
BC2F3
NIL for PBN 6X
NIL (SBN-1+ PBN-6)
Ando et al., 2008
Phenotypic performance
of QTL -NILs
Wild species used- Oryza rufipogon
V20A- recurrent female parent
V20B- maintainer line
Ce 64- restorer
V20A X Ce 64 – F1 hybrid shows strong
vigour, used for comparing the BC2 test cross
progeny
PCA of 34 wild accessions and15 accessions from cultivated species
CASE STUDY- 3
V20A X O. rufipogon
(IRGC-105491)
V 20 BXF1
BC1F1 V 20 BX
BC2F1 X Ce 64
BC2 test cross progeny
300 test cross families
52plants 10 plants
3000plants 300plants
QTL analysis
Field trail and trait evaluation
Xiao et al. (1998)
Identification of trait improving Quantitative trait alleles from a wild
rice relative Oryza rufipogon (AB-QTL )
Xiao et al. (1998)
Frequency distribution of phenotypic for different traits in BC2 test cross progeny
Xiao et al. (1998)
Frequency distribution of phenotypic for different traits in BC2 test cross progeny
Azhul X Spontaneum.
I
F1Azhul X
BC1F1 X Azhul
BC2F1 X Azhul
BC3F1
BC3F3
Genotyping and QTL analysis
Eshghi et al., 2013
Hull less variety Hulled wild relative
CASE STUDY- 4
Correlation matrix of the traits analyzed in the Azhul X Spontanum.I
population
Eshghi et al., 2013
QTLs for yield and yield components detected in the BC3 population from Azhul x
Spontaneum
Identification of limited number of major ‘players’ (QTLs)
controlling specific traits
Inadequacies / experimental deficiencies in QTL analysis
leading to either over estimation or under estimation of the
number of effects of QTLs
Lack of universally valid QTL/ marker associations
applicable over different sets of breeding material
Strong QTL X environmental interaction
Difficulty in precisely evaluating epistatic effects
Limitations on efficient utilization of QTL mapping
information in plant breeding through MAS
Future challenges
Improved cost-efficiency
Optimization, simplification of
methods and future innovation
Design of efficient and effective
MAS strategies
Greater integration between
molecular genetics and plant
breeding
Data management
Marker assisted selection for complex traits in agricultural crops

Marker assisted selection for complex traits in agricultural crops

  • 2.
    MAS refers tothe use of DNA markers that are tightly linked to target loci as a substitute for or to assist phenotypic screening Marker assisted selection (MAS) Assumption: DNA markers can reliably predict phenotype
  • 3.
    Multifactorial traits aredetermined by multiple genetic and environmental factors acting together Genetic architecture of a complex trait = specific effects and combined interactions of all genetic and environmental factors Quantitative traits = phenotypes differ in quantity rather than type (such as height) Variation in genotype can be eliminated by studying inbred lines = homozygous for most genes, or F1 progeny of inbred lines = uniformly heterozygous Complete elimination of environmental variation is impossible Multifactorial = complex traits = quantitative traits
  • 4.
    Considerations for usingDNA markers in plant breeding 1. Technical methodology simple or complicated? 1. Reliability 2. Degree of polymorphism 3. DNA quality and quantity required 4. Cost 5. Available resources Equipment, technical expertise Collard et al., 2008
  • 5.
    F2 P2 F1 P1 x Large populations consistingof thousands of plants PHENOTYPIC SELECTION Field trialsGlasshouse trials DonorRecipient Salinity screening in phytotron Bacterial blight screening Phosphorus deficiency plot
  • 6.
    F2 P2 F1 P1 x large populationsconsisting of thousands of plants ResistantSusceptible MARKER-ASSISTED SELECTION (MAS) Method whereby phenotypic selection is based on DNA markers
  • 7.
    Advantages of MAS Simplermethod compared to phenotypic screening Selection at seedling stage Increased reliability Potential benefits from MAS More accurate and efficient selection of specific genotypes -May lead to accelerated variety development More efficient use of resources -Especially field trials Collard et al., 2008
  • 8.
    MAS BREEDING SCHEMES 1.Marker-assisted backcrossing 2. Pyramiding 3. Early generation selection 4. ‘Combined’ approaches
  • 9.
    Marker-assisted backcrossing (MAB) MABhas several advantages over conventional backcrossing: – Effective selection of target loci – Minimize linkage drag – Accelerated recovery of recurrent parent 1 2 3 4 Target locus 1 2 3 4 RECOMBINANT SELECTION 1 2 3 4 BACKGROUND SELECTIONTARGET LOCUS SELECTION FOREGROUND SELECTION BACKGROUND SELECTION
  • 10.
    P1 x F1 P1x P2 CONVENTIONAL BACKCROSSING BC1 VISUAL SELECTION OF BC1 PLANTS THAT MOST CLOSELY RESEMBLE RECURRENT PARENT BC2 MARKER-ASSISTED BACKCROSSING P1 x F1 P1 x P2 BC1 USE ‘BACKGROUND’ MARKERS TO SELECT PLANTS THAT HAVE MOST RP MARKERS AND SMALLEST % OF DONOR GENOME BC2
  • 11.
    Pyramiding Widely used forcombining multiple disease resistance genes for specific races of a pathogen Pyramiding is extremely difficult to achieve using conventional methods - Consider: phenotyping a single plant for multiple forms of seedling resistance – almost impossible Important to develop ‘durable’ disease resistance against different races
  • 12.
    F2 F1 Gene A +B P1 Gene A x P1 Gene B MAS Select F2 plants that have Gene A and Gene B Genotypes P1: AAbb P2: aaBB F1: AaBb Process of combining several genes, usually from two different parents, together into a single genotype x Breeding plan Hittalmani et al. (2000) and Liu et al. (2000)
  • 13.
    Early generation MAS MAS conducted at F2 or F3 stage  Plants with desirable genes/QTLs are selected and alleles can be ‘fixed’ in the homozygous state - plants with undesirable gene combinations can be discarded  Advantage for later stages of breeding program because resources can be used to focus on fewer lines Ribaut & Betran. (1999)
  • 14.
    P1 x P2 F1 PEDIGREEMETHOD F2 F3 F4 F5 F6 F7 F8 – F12 Phenotypic screening Plants space- planted in rows for individual plant selection Families grown in progeny rows for selection. Preliminary yield trials. Select single plants. Further yield trials Multi-location testing, licensing, seed increase and cultivar release P1 x P2 F1 F2 F3 MAS SINGLE LARGE SCALE MARKER-ASSISTED SELECTION (SLS-MAS) F4 Families grown in progeny rows for selection. Pedigree selection based on local needs F6 F7 F5 F8 – F12 Multi-location testing, licensing, seed increase and cultivar release Only desirable F3 lines planted in field Benefits: breeding program can be efficiently scaled down to focus on fewer lines
  • 15.
    Combined approaches In somecases, a combination of phenotypic screening and MAS approach may be useful  To maximize genetic gain (when some QTLs have been unidentified from QTL mapping)  Level of recombination between marker and QTL (in other words marker is not 100% accurate)  To reduce population sizes for traits where marker genotyping is cheaper or easier than phenotypic screening
  • 16.
    Local cultivars fromVietnam - OM 1490/ OMCS 2000 recurrent parents IR -64 sub-1- donor parent for submergence tolerance CASE STUDY- 1
  • 17.
    OM 1490/ OMCS 2000 XIR-64 sub-1 X OM 1490/ OMCS 2000 BC1F1 X OM 1490/ OMCS 2000 BC2F1Selfing BC2F2BC2F3 Selfing Yield and yield components tested Lang et al, 2011 Screening for submergence resistance F1 Development of submergence tolerance rice varieties
  • 18.
    PCR products ofBC2F2 population from OM 1490 / IR 64 sub-1 at locus RM 23804 on chromosome number 9 (1 IR64-Sub1; 2 OM1490; 1 and 125 BC2F2 progenies ) Lang et al, 2011
  • 19.
    Yield and yieldcomponents of rice genotypes tested in BC2F3 at CLRRI Lang et al, 2011
  • 20.
    Preparation of CSSLby using to contrast parents for yield trait, genotyping and phenotyping Generation of NIL lines for the specific QTLs, Pyramiding of NIL QTL lines to see the combined effect of the both the QTLs identified Analysis for additive , dominant and epistatic interactions CASE STUDY- 2
  • 21.
    Strategies for developmentof CSSL (31)BIL Genotyping with 236 RFLP markers Genotyping with 236 RFLP markers 30 lines Genotyped with 116 SSR markers distributed uniformly at an interval of 2.6 Mb Ando et al., 2008
  • 22.
    Graphical representation ofgenotype of whole chromosomes in the CSSLs developed Ando et al., 2008
  • 23.
    Ando et al.,2008 Chromosomal locations of QTLs for panicle architecture (QTLs detected in 2004 and 2005)
  • 24.
    Development of QTL-NILs Ando et al., 2008 Sasanishiki X BIL-8 F1 X sasanishiki BC1F3 NIL for SBN1 Sasanishiki X BIL-21 F1 X sasanishiki BC1F1 X sasanishiki BC1F1 BC2F1 BC2F3 NIL for PBN 6X NIL (SBN-1+ PBN-6)
  • 25.
    Ando et al.,2008 Phenotypic performance of QTL -NILs
  • 26.
    Wild species used-Oryza rufipogon V20A- recurrent female parent V20B- maintainer line Ce 64- restorer V20A X Ce 64 – F1 hybrid shows strong vigour, used for comparing the BC2 test cross progeny PCA of 34 wild accessions and15 accessions from cultivated species CASE STUDY- 3
  • 27.
    V20A X O.rufipogon (IRGC-105491) V 20 BXF1 BC1F1 V 20 BX BC2F1 X Ce 64 BC2 test cross progeny 300 test cross families 52plants 10 plants 3000plants 300plants QTL analysis Field trail and trait evaluation Xiao et al. (1998) Identification of trait improving Quantitative trait alleles from a wild rice relative Oryza rufipogon (AB-QTL )
  • 28.
    Xiao et al.(1998) Frequency distribution of phenotypic for different traits in BC2 test cross progeny
  • 29.
    Xiao et al.(1998) Frequency distribution of phenotypic for different traits in BC2 test cross progeny
  • 30.
    Azhul X Spontaneum. I F1AzhulX BC1F1 X Azhul BC2F1 X Azhul BC3F1 BC3F3 Genotyping and QTL analysis Eshghi et al., 2013 Hull less variety Hulled wild relative CASE STUDY- 4
  • 31.
    Correlation matrix ofthe traits analyzed in the Azhul X Spontanum.I population Eshghi et al., 2013
  • 32.
    QTLs for yieldand yield components detected in the BC3 population from Azhul x Spontaneum
  • 33.
    Identification of limitednumber of major ‘players’ (QTLs) controlling specific traits Inadequacies / experimental deficiencies in QTL analysis leading to either over estimation or under estimation of the number of effects of QTLs Lack of universally valid QTL/ marker associations applicable over different sets of breeding material Strong QTL X environmental interaction Difficulty in precisely evaluating epistatic effects Limitations on efficient utilization of QTL mapping information in plant breeding through MAS
  • 34.
    Future challenges Improved cost-efficiency Optimization,simplification of methods and future innovation Design of efficient and effective MAS strategies Greater integration between molecular genetics and plant breeding Data management