The document provides an overview of Six Sigma, including:
- Six Sigma aims to reduce defects and variation in processes by focusing on outputs that are within 6 standard deviations from the mean.
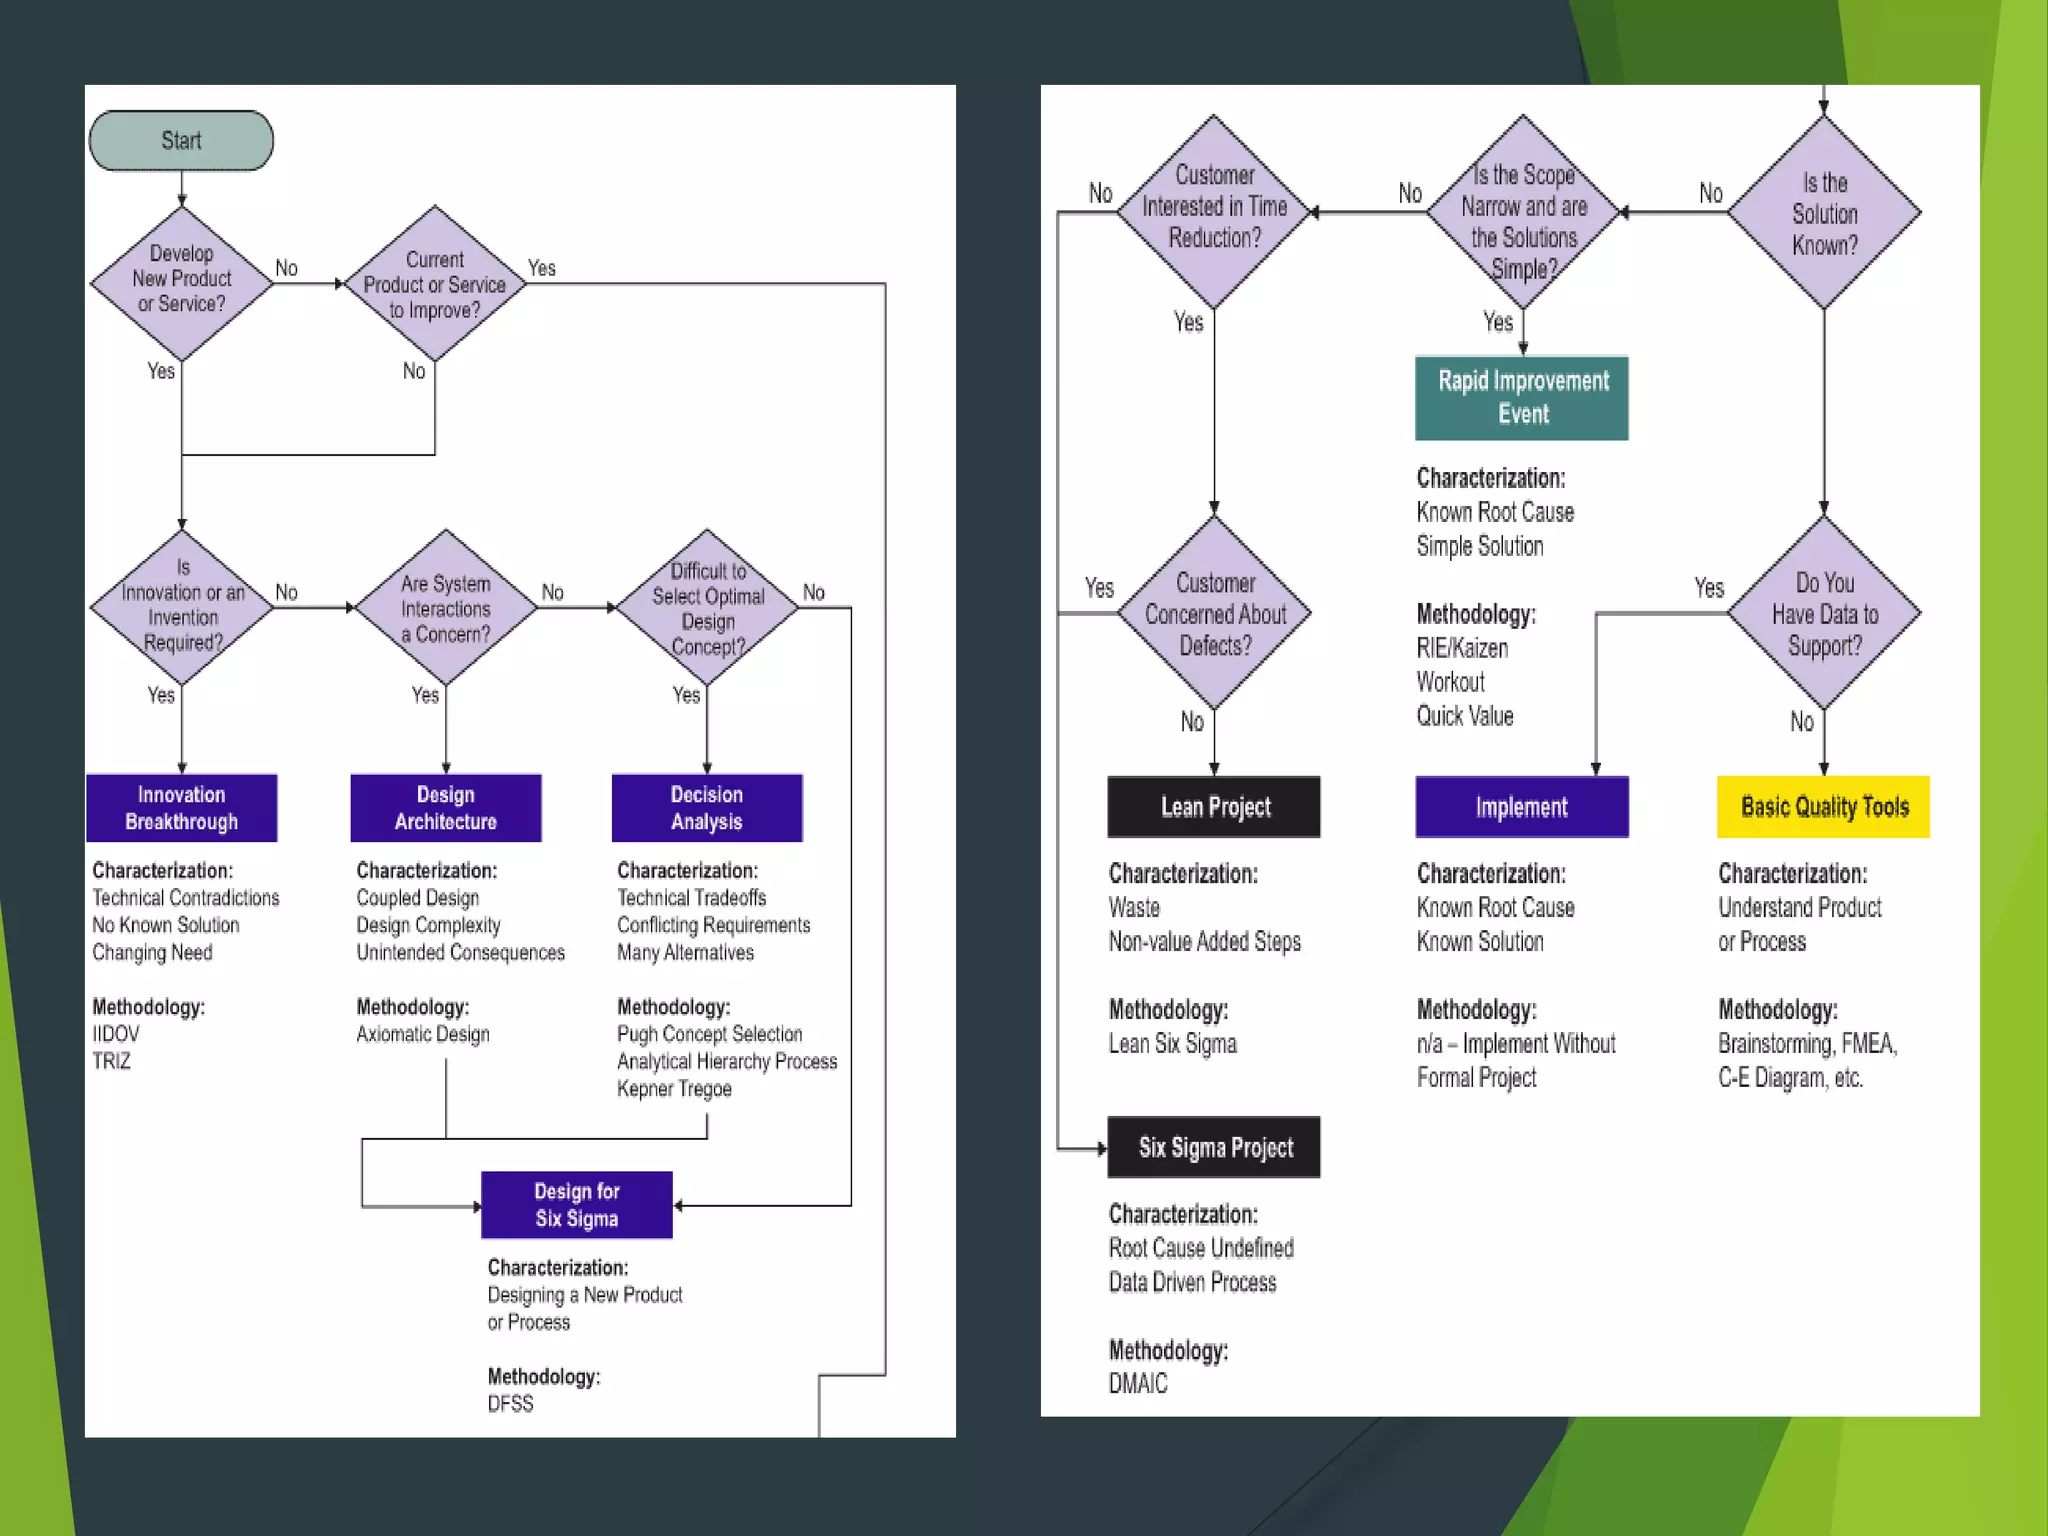
- It was introduced at Motorola in 1986 and uses statistical tools and a DMAIC methodology for continuous improvement.
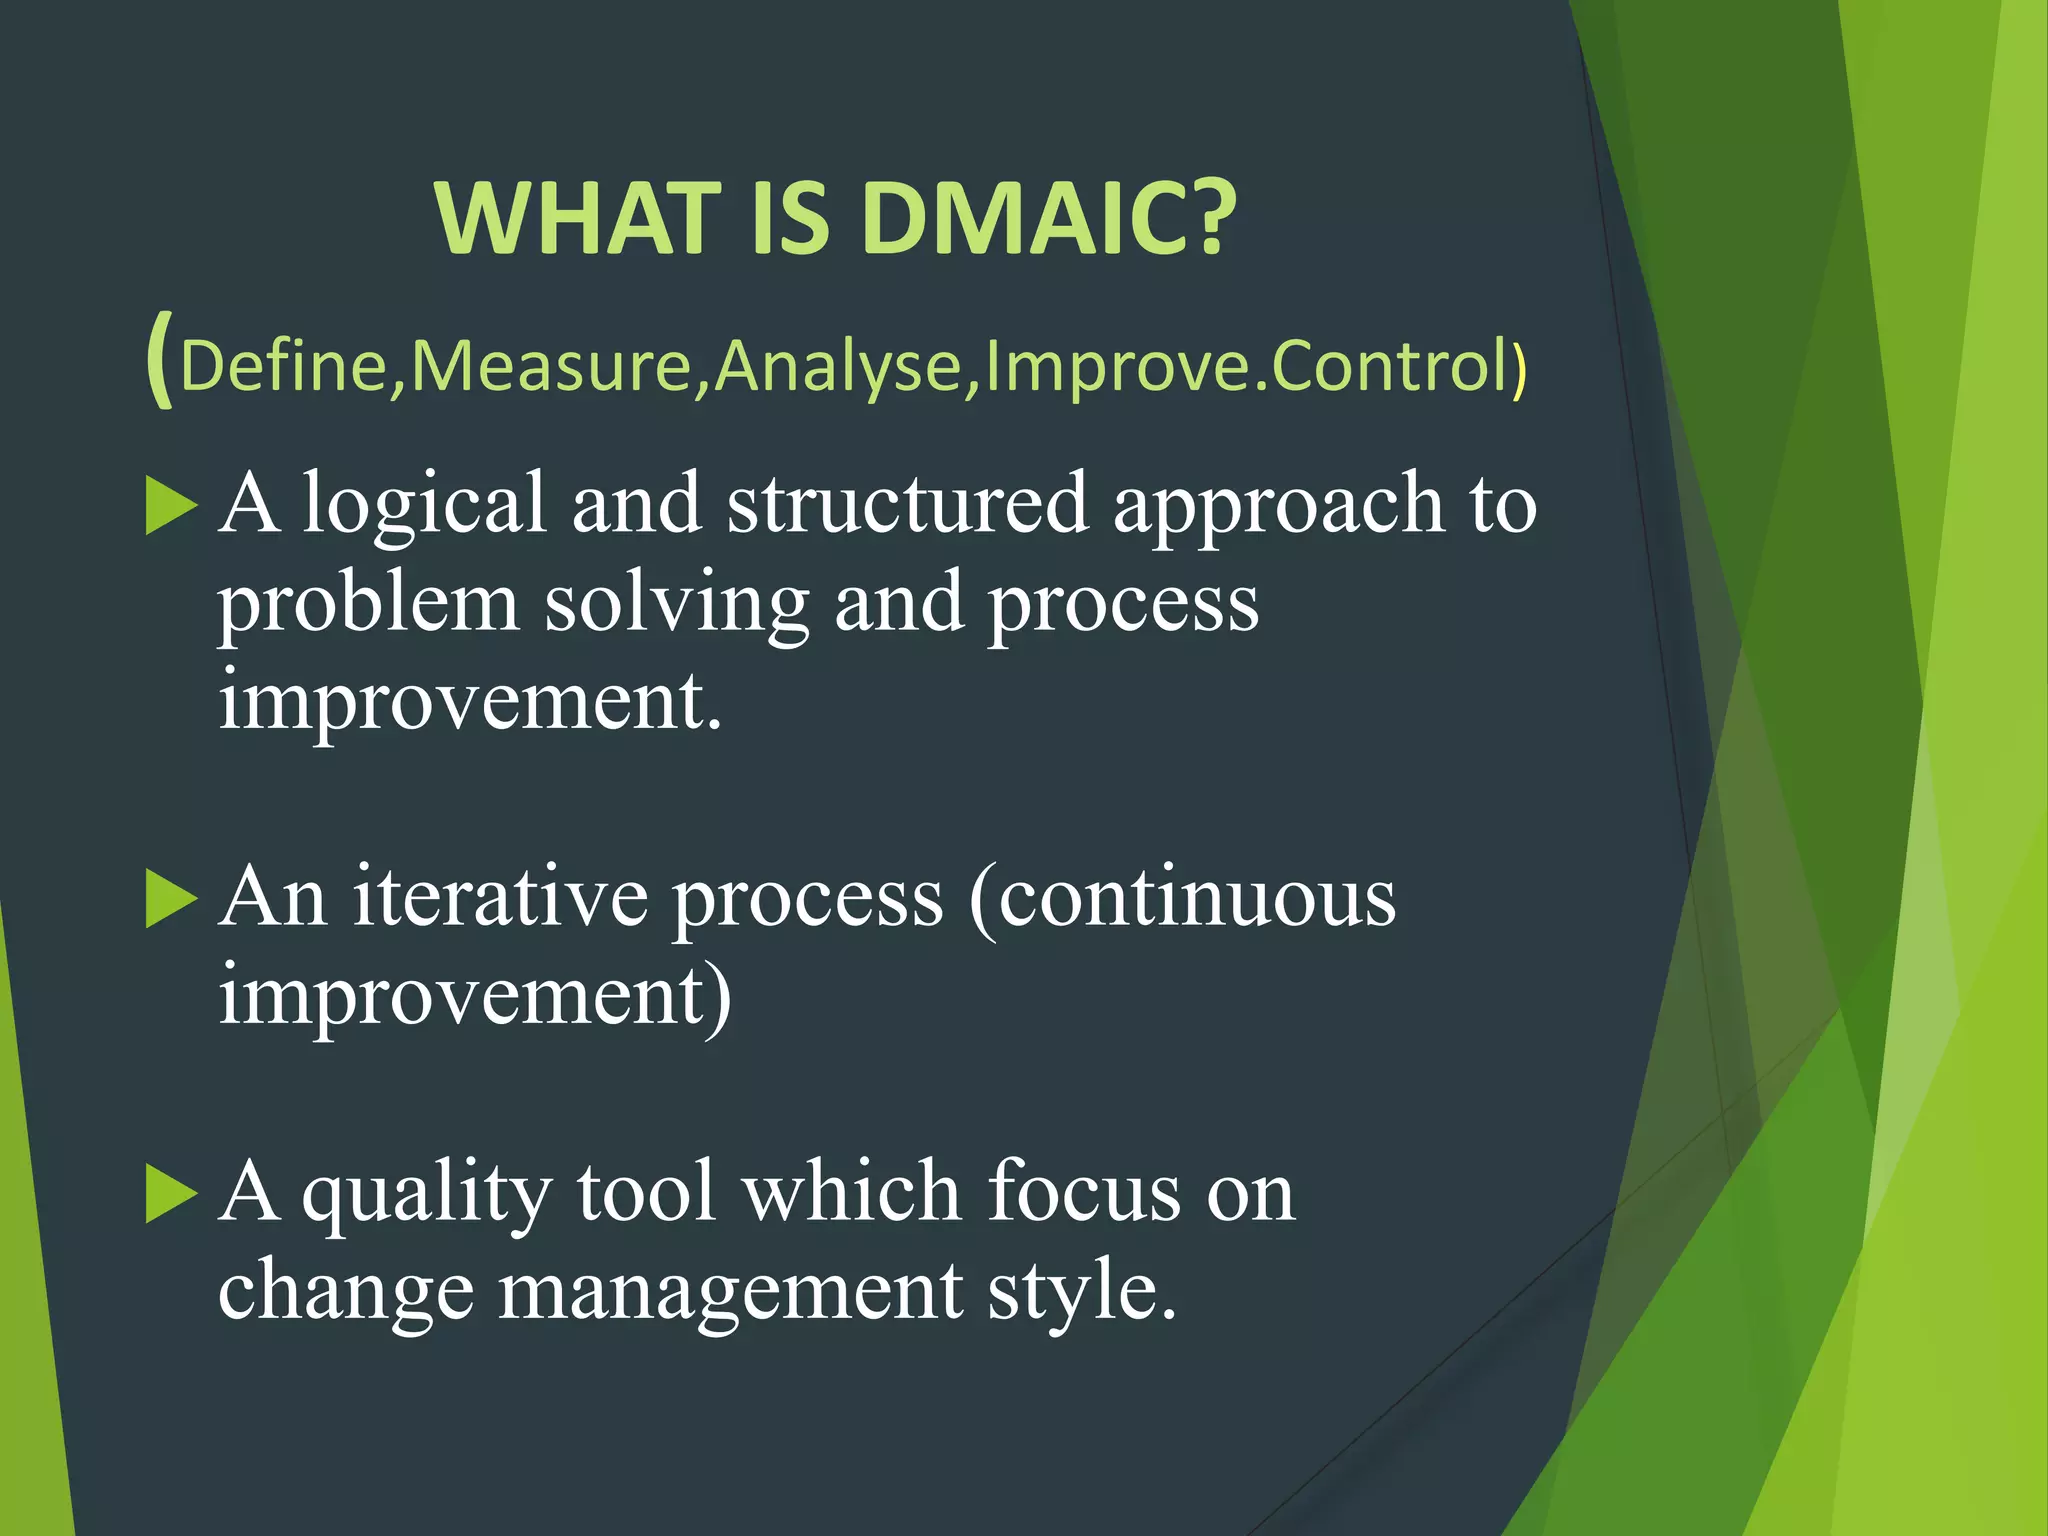
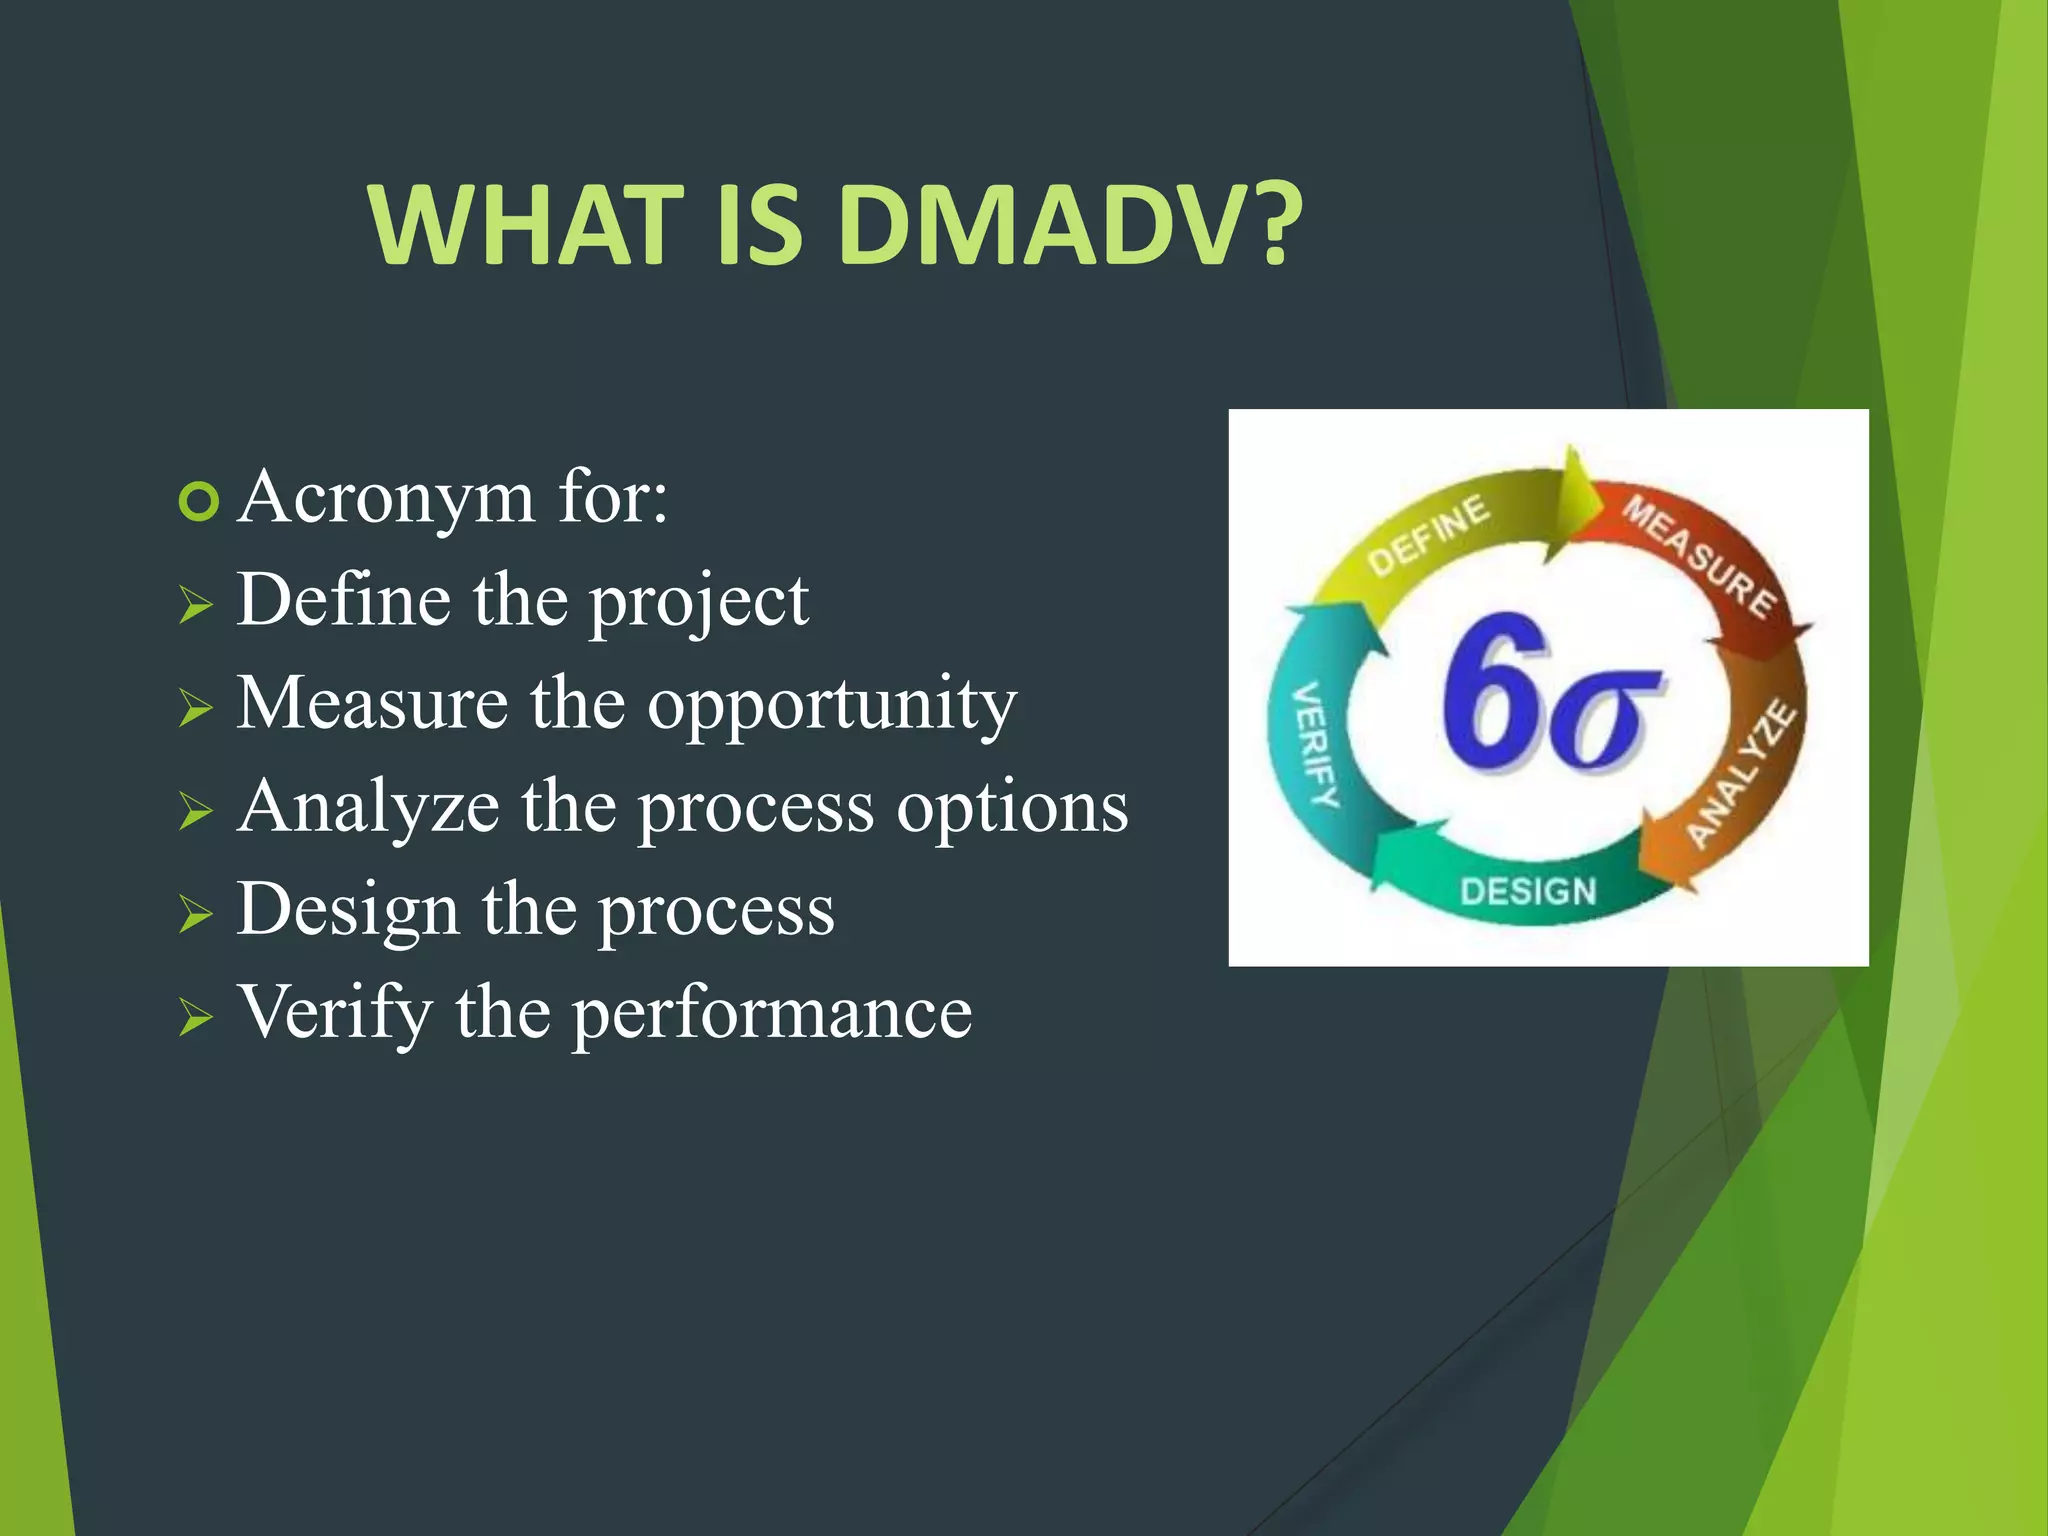
- DMAIC stands for Define, Measure, Analyze, Improve, Control and is an iterative problem-solving approach. DMADV is for creating new processes.
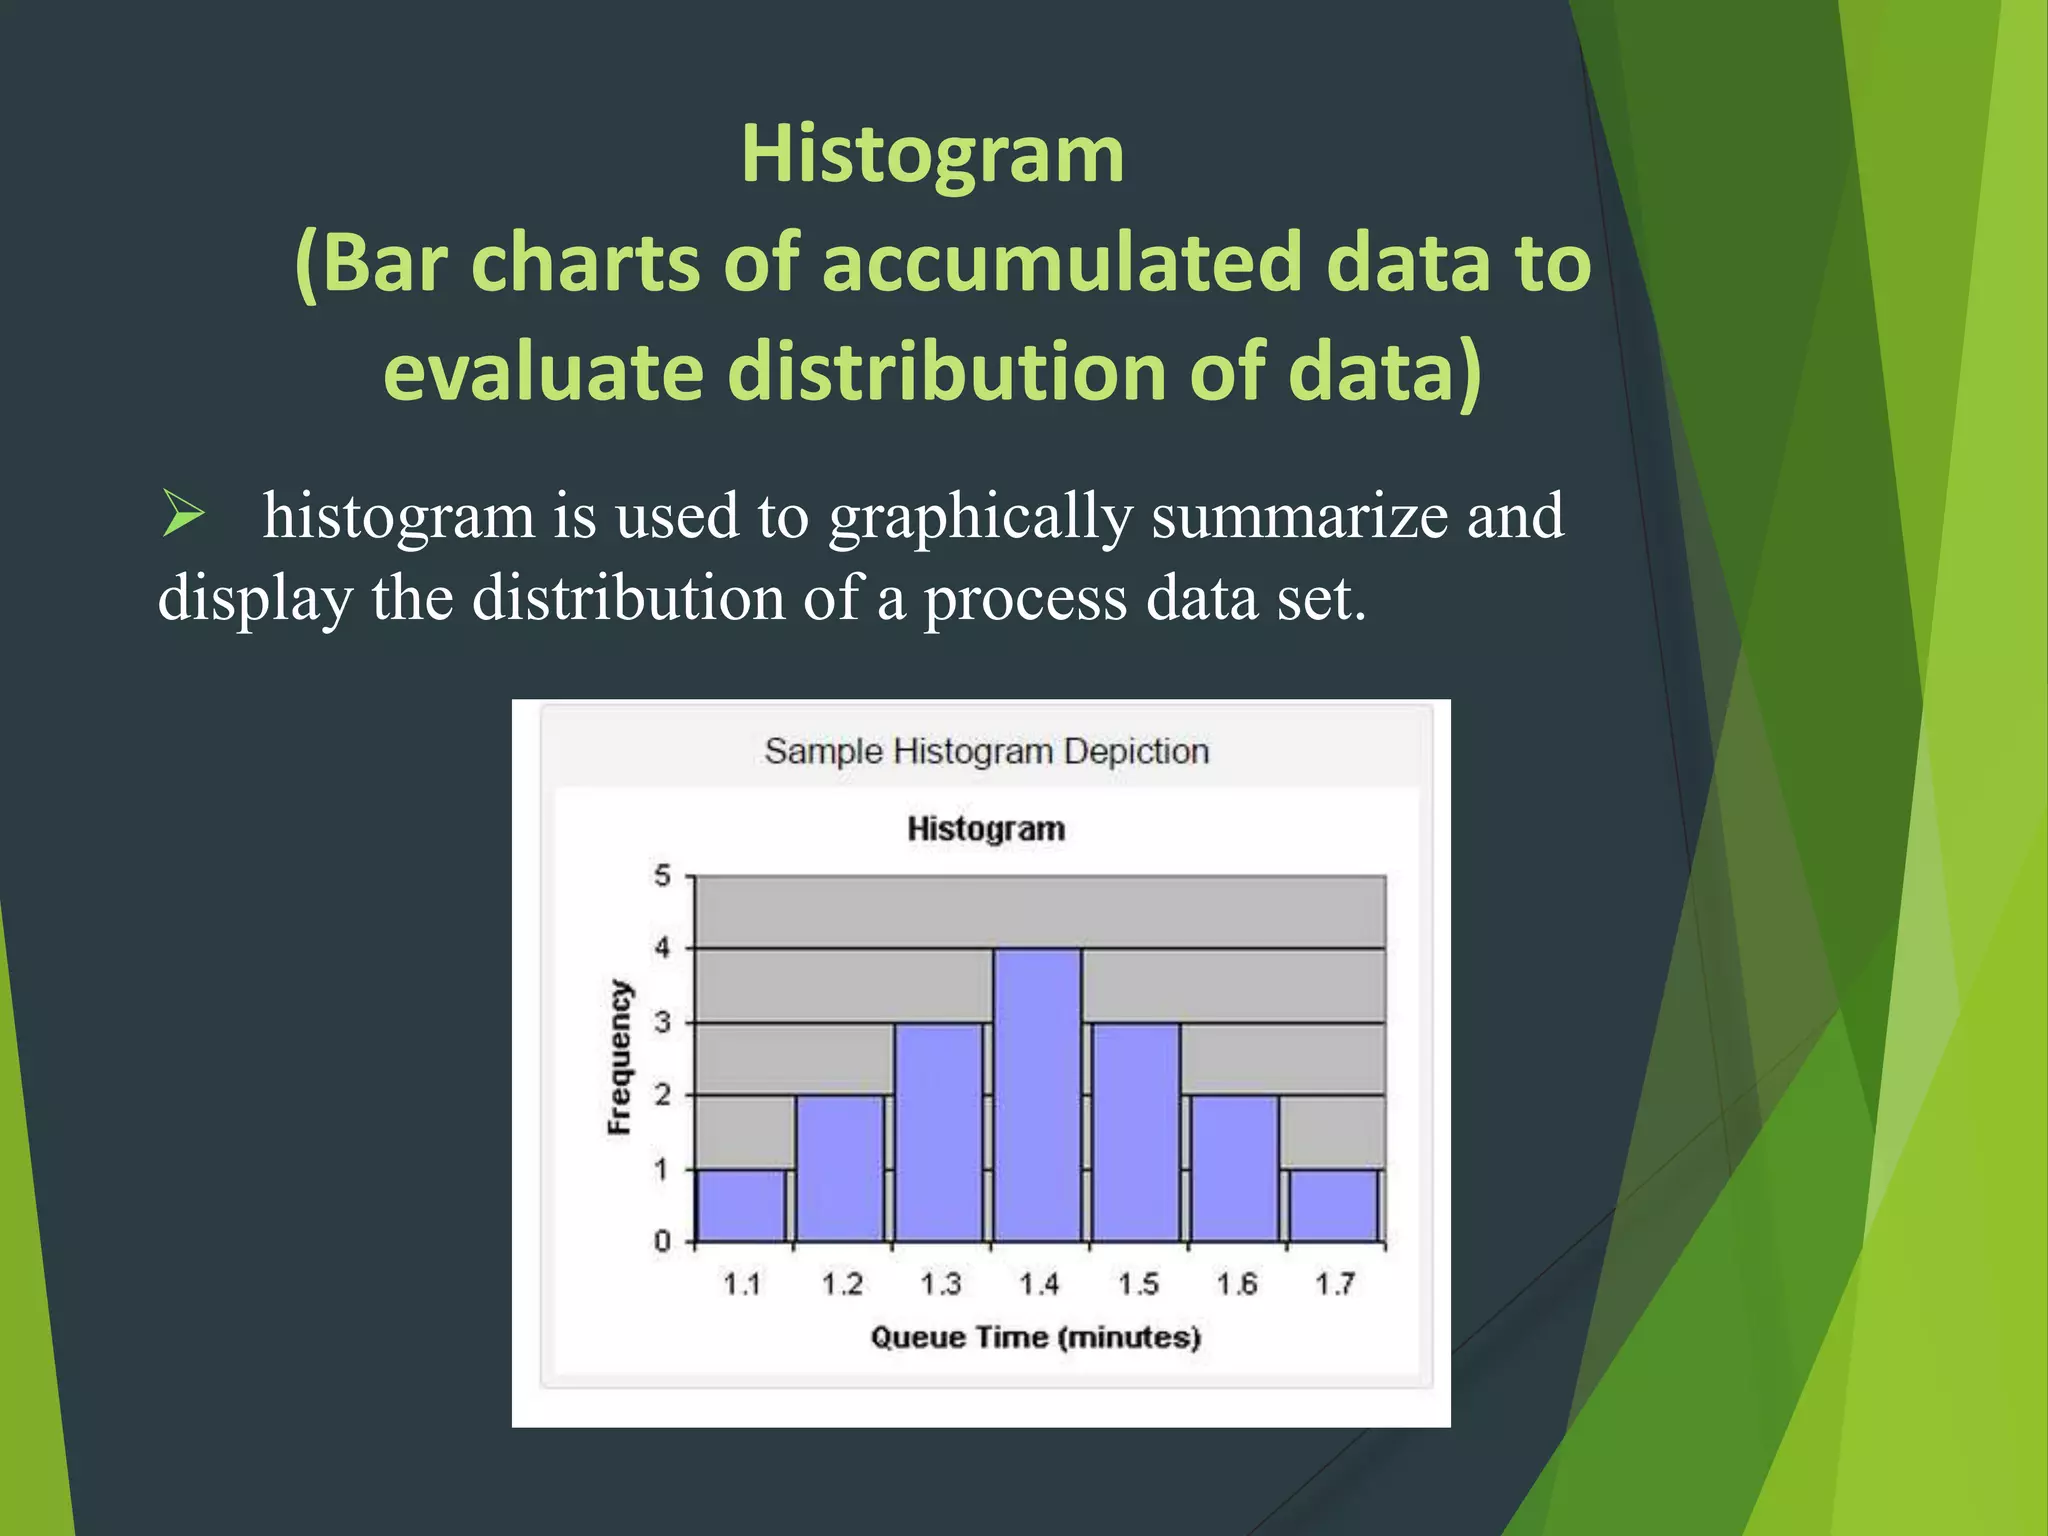
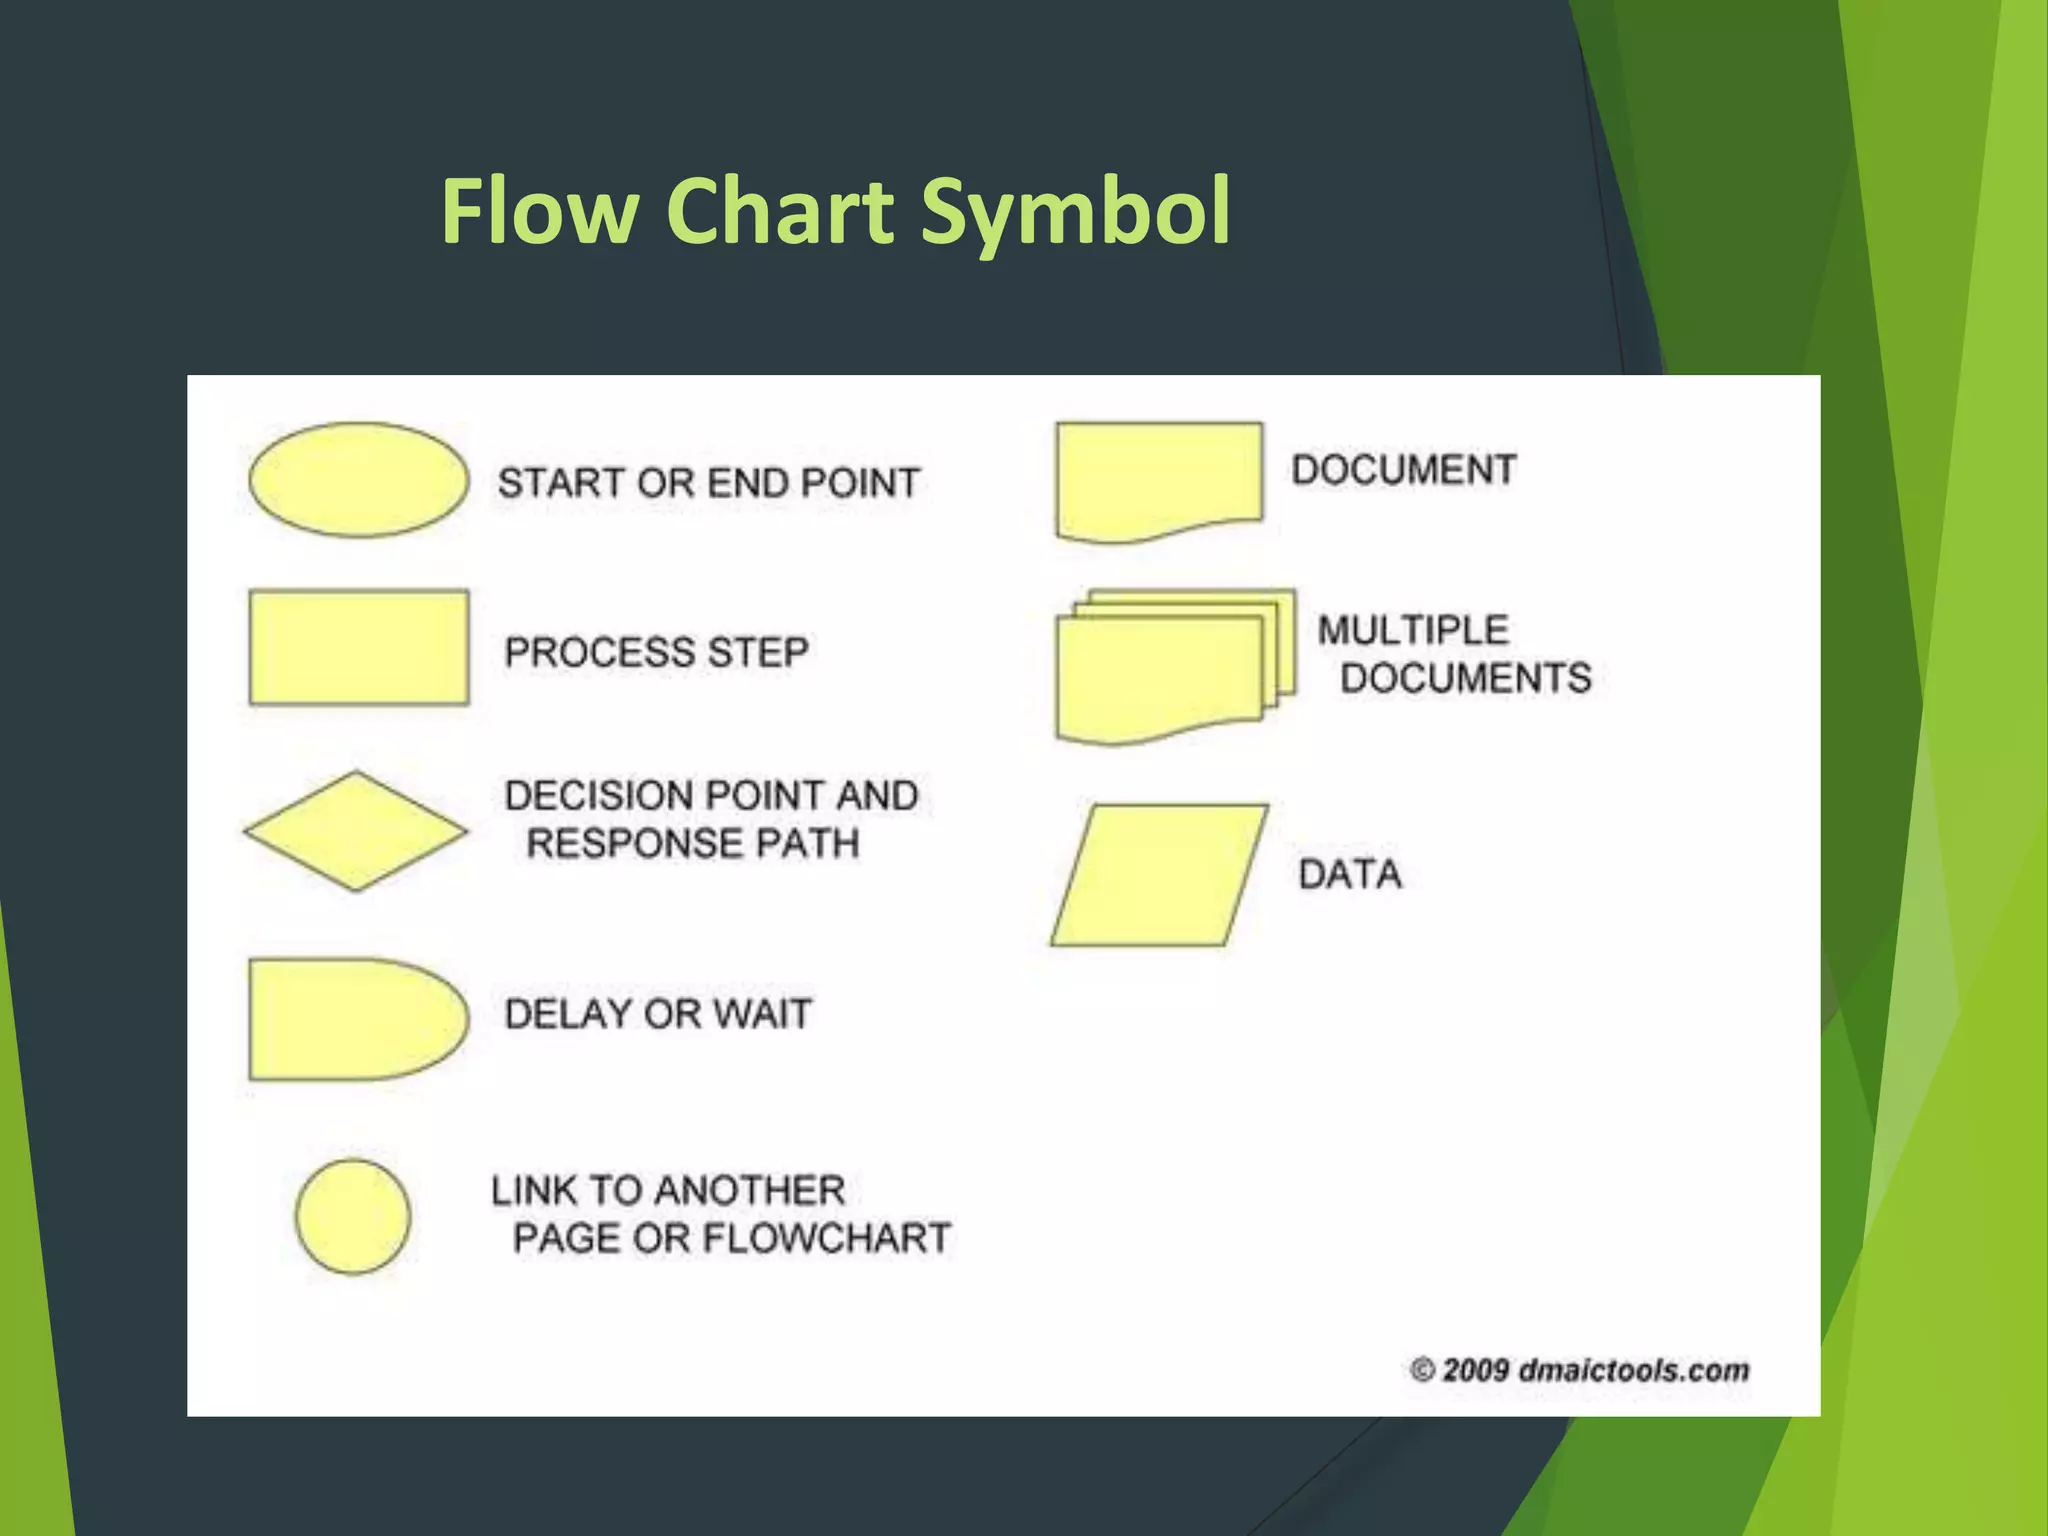
- Key Six Sigma roles include Champions, Master Black Belts, Black Belts and Green Belts. A variety of statistical tools can be used including flow charts, histograms, control charts and Pareto charts.


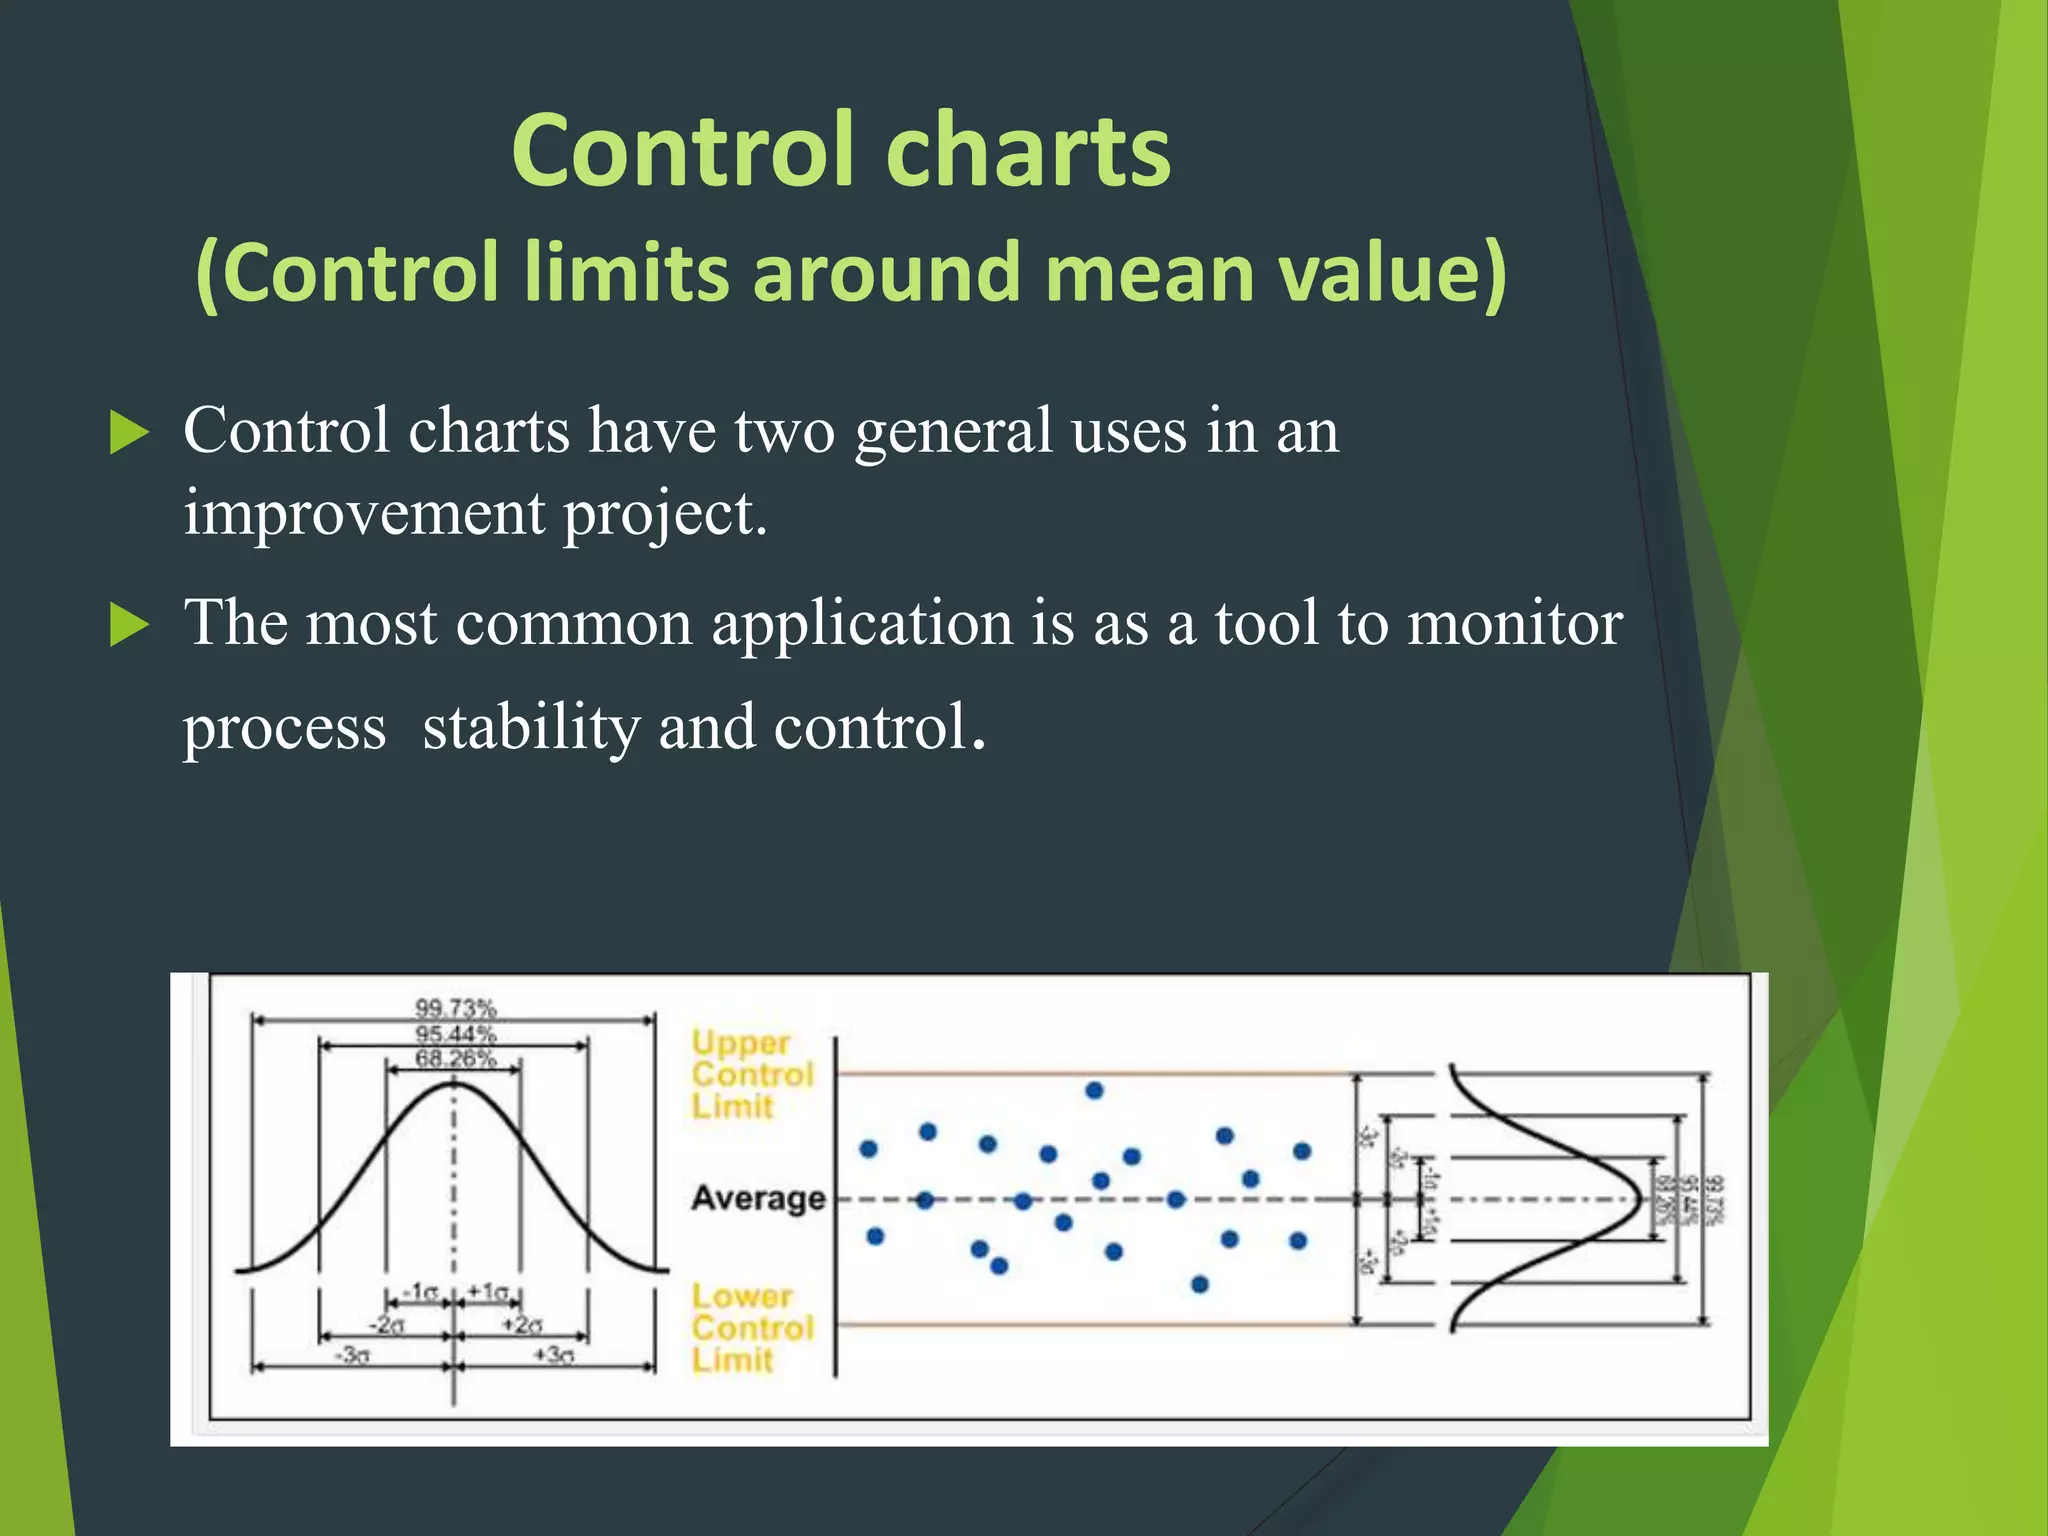


![Control Charts[1]](https://cdn.slidesharecdn.com/ss_thumbnails/controlcharts1-1226961283054520-8-thumbnail.jpg?width=640&height=640&fit=bounds)