This document chapter discusses various functions and tools in Excel including rotating text, creating month name series, formatting cells, freezing panes, inserting dates and formulas, conditional formatting with IF functions, creating sparkline and pie charts, performing what-if analysis and goal seeking. The chapter provides step-by-step instructions for utilizing these tools to build financial projection worksheets and analyze data.
The presentation is about basic statistical techniques and how statistics can be used effectively in the quality control and process control. It also presents statistical package Minitab version 16 and some of its applications in the field of statistical process control.
Describe the Excel worksheet. Enter text and numbers and use the Sum button to sum a range of cells. Copy the contents of a cell to a range of cells using the fi ll handle. Apply cell styles and format cells in a worksheet. Create an embedded chart. Change a worksheet name and worksheet tab color. Change document properties and print preview and a worksheet. Use AutoCalculate to display statistics.
اكسيل كارت الاستخدام السريع لحساب الارباح و الوارد و المنصرف لاصحاب الاعمال ...Ahmed Farahat
رَبِّ اغْفِرْ لِي وَلِوَالِدَيَّ وَلِمَن دَخَلَ بَيْتِيَ مُؤْمِنًا وَلِلْمُؤْمِنِينَ وَالْمُؤْمِنَاتِ وَلَا تَزِدِ الظَّالِمِينَ إِلَّا تَبَارًا
مع تحيات م/ احمد جاد الله فرحات
العمل الحر,
الدعايه و التصميم,
فن الاعلان,
العمل من المنزل ,
Adobe Illustrator,
الدعاية و الاعلان,
الجرفيكس ,
العمل الحر,
مشاريع قوت اليوم ,
العمل من المنزل ,
ربح المال ,
العمل الحر,
التدقيق اللغوي ,
الترجمة ,
تعليم اللغات ,
كتابة المحتوي,
Research students find it difficult to edit Word Documents since they would have not explored all avenues of systematic editing features in this desk top publishing. The slides showed herein describe systematic methodology to create a thesis template for presenting Project thesis, research thesis etc., The contents include, page setup, setting up headings, sub headings, sub-sub headings, creating tables and hyperlinking table labels, creating labels for figures and hyperlinking, automatic generation of listing of Contents, list of Figures, Tables, and more interestingly creating reference listing (bibliography) and hyperlinking with citation in the text, and overall reference management. The merging of smaller documents to create a master document in Word is another useful hint for managing Word documents with large number of pages. Students who may not like to edit thesis using Latex can comfortably make use of this slide share.
Let's dive deeper into the world of ODC! Ricardo Alves (OutSystems) will join us to tell all about the new Data Fabric. After that, Sezen de Bruijn (OutSystems) will get into the details on how to best design a sturdy architecture within ODC.
PHP Frameworks: I want to break free (IPC Berlin 2024)Ralf Eggert
In this presentation, we examine the challenges and limitations of relying too heavily on PHP frameworks in web development. We discuss the history of PHP and its frameworks to understand how this dependence has evolved. The focus will be on providing concrete tips and strategies to reduce reliance on these frameworks, based on real-world examples and practical considerations. The goal is to equip developers with the skills and knowledge to create more flexible and future-proof web applications. We'll explore the importance of maintaining autonomy in a rapidly changing tech landscape and how to make informed decisions in PHP development.
This talk is aimed at encouraging a more independent approach to using PHP frameworks, moving towards a more flexible and future-proof approach to PHP development.
Epistemic Interaction - tuning interfaces to provide information for AI supportAlan Dix
Paper presented at SYNERGY workshop at AVI 2024, Genoa, Italy. 3rd June 2024
https://alandix.com/academic/papers/synergy2024-epistemic/
As machine learning integrates deeper into human-computer interactions, the concept of epistemic interaction emerges, aiming to refine these interactions to enhance system adaptability. This approach encourages minor, intentional adjustments in user behaviour to enrich the data available for system learning. This paper introduces epistemic interaction within the context of human-system communication, illustrating how deliberate interaction design can improve system understanding and adaptation. Through concrete examples, we demonstrate the potential of epistemic interaction to significantly advance human-computer interaction by leveraging intuitive human communication strategies to inform system design and functionality, offering a novel pathway for enriching user-system engagements.
JMeter webinar - integration with InfluxDB and GrafanaRTTS
Watch this recorded webinar about real-time monitoring of application performance. See how to integrate Apache JMeter, the open-source leader in performance testing, with InfluxDB, the open-source time-series database, and Grafana, the open-source analytics and visualization application.
In this webinar, we will review the benefits of leveraging InfluxDB and Grafana when executing load tests and demonstrate how these tools are used to visualize performance metrics.
Length: 30 minutes
Session Overview
-------------------------------------------
During this webinar, we will cover the following topics while demonstrating the integrations of JMeter, InfluxDB and Grafana:
- What out-of-the-box solutions are available for real-time monitoring JMeter tests?
- What are the benefits of integrating InfluxDB and Grafana into the load testing stack?
- Which features are provided by Grafana?
- Demonstration of InfluxDB and Grafana using a practice web application
To view the webinar recording, go to:
https://www.rttsweb.com/jmeter-integration-webinar
Transcript: Selling digital books in 2024: Insights from industry leaders - T...BookNet Canada
The publishing industry has been selling digital audiobooks and ebooks for over a decade and has found its groove. What’s changed? What has stayed the same? Where do we go from here? Join a group of leading sales peers from across the industry for a conversation about the lessons learned since the popularization of digital books, best practices, digital book supply chain management, and more.
Link to video recording: https://bnctechforum.ca/sessions/selling-digital-books-in-2024-insights-from-industry-leaders/
Presented by BookNet Canada on May 28, 2024, with support from the Department of Canadian Heritage.
GraphRAG is All You need? LLM & Knowledge GraphGuy Korland
Guy Korland, CEO and Co-founder of FalkorDB, will review two articles on the integration of language models with knowledge graphs.
1. Unifying Large Language Models and Knowledge Graphs: A Roadmap.
https://arxiv.org/abs/2306.08302
2. Microsoft Research's GraphRAG paper and a review paper on various uses of knowledge graphs:
https://www.microsoft.com/en-us/research/blog/graphrag-unlocking-llm-discovery-on-narrative-private-data/
GDG Cloud Southlake #33: Boule & Rebala: Effective AppSec in SDLC using Deplo...James Anderson
Effective Application Security in Software Delivery lifecycle using Deployment Firewall and DBOM
The modern software delivery process (or the CI/CD process) includes many tools, distributed teams, open-source code, and cloud platforms. Constant focus on speed to release software to market, along with the traditional slow and manual security checks has caused gaps in continuous security as an important piece in the software supply chain. Today organizations feel more susceptible to external and internal cyber threats due to the vast attack surface in their applications supply chain and the lack of end-to-end governance and risk management.
The software team must secure its software delivery process to avoid vulnerability and security breaches. This needs to be achieved with existing tool chains and without extensive rework of the delivery processes. This talk will present strategies and techniques for providing visibility into the true risk of the existing vulnerabilities, preventing the introduction of security issues in the software, resolving vulnerabilities in production environments quickly, and capturing the deployment bill of materials (DBOM).
Speakers:
Bob Boule
Robert Boule is a technology enthusiast with PASSION for technology and making things work along with a knack for helping others understand how things work. He comes with around 20 years of solution engineering experience in application security, software continuous delivery, and SaaS platforms. He is known for his dynamic presentations in CI/CD and application security integrated in software delivery lifecycle.
Gopinath Rebala
Gopinath Rebala is the CTO of OpsMx, where he has overall responsibility for the machine learning and data processing architectures for Secure Software Delivery. Gopi also has a strong connection with our customers, leading design and architecture for strategic implementations. Gopi is a frequent speaker and well-known leader in continuous delivery and integrating security into software delivery.
Kubernetes & AI - Beauty and the Beast !?! @KCD Istanbul 2024Tobias Schneck
As AI technology is pushing into IT I was wondering myself, as an “infrastructure container kubernetes guy”, how get this fancy AI technology get managed from an infrastructure operational view? Is it possible to apply our lovely cloud native principals as well? What benefit’s both technologies could bring to each other?
Let me take this questions and provide you a short journey through existing deployment models and use cases for AI software. On practical examples, we discuss what cloud/on-premise strategy we may need for applying it to our own infrastructure to get it to work from an enterprise perspective. I want to give an overview about infrastructure requirements and technologies, what could be beneficial or limiting your AI use cases in an enterprise environment. An interactive Demo will give you some insides, what approaches I got already working for real.
Key Trends Shaping the Future of Infrastructure.pdfCheryl Hung
Keynote at DIGIT West Expo, Glasgow on 29 May 2024.
Cheryl Hung, ochery.com
Sr Director, Infrastructure Ecosystem, Arm.
The key trends across hardware, cloud and open-source; exploring how these areas are likely to mature and develop over the short and long-term, and then considering how organisations can position themselves to adapt and thrive.
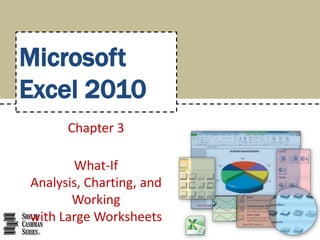
1. Microsoft
Excel 2010
Chapter 3
What-If
Analysis, Charting, and
Working
with Large Worksheets
2. Objectives
• Rotate text in a cell
• Create a series of month names
• Copy, paste, insert, and delete cells
• Format numbers using format symbols
• Freeze and unfreeze rows and columns
• Show and format the system date
• Use absolute and mixed cell references in a
formula
• Use the IF function to perform a logical test
What-If Analysis, Charting, and Working with Large Worksheets 2
3. Objectives
• Create Sparkline charts
• Use the Format Painter button to format cells
• Create a 3-D Pie chart on a separate chart sheet
• Rearrange worksheet tabs
• Change the worksheet view
• Answer what-if questions
• Goal seek to answer what-if questions
What-If Analysis, Charting, and Working with Large Worksheets 3
4. Project – Financial Projection Worksheet
with What-If Analysis and Chart
What-If Analysis, Charting, and Working with Large Worksheets 4
5. General Project Guidelines
• Plan the layout of the worksheet
• Determine the necessary formulas and functions
needed
• Specify how to best utilize Sparkline charts
• Identify how to format various elements
• Specify how charts should convey necessary
information
• Perform what-if analysis and goal seeking using
the best techniques
What-If Analysis, Charting, and Working with Large Worksheets 5
6. Rotating Text and Using the Fill Handle
to Create a Series of Month Names
• If necessary, select the Home tab and then select the cell
that will include the first month name in the series of
month names
• Type the first month in the series as the cell entry and then
click the Enter box
• Click the Format Cells: Alignment Dialog Box Launcher on
the Home tab to display the Format Cells dialog box
• Click the desired point in the Orientation area to move the
Text hand in the Orientation area and to display a new
orientation in the Degrees box
• Click the OK button to rotate the text in the active cell and
automatically increase the height of the current row to best
fit the rotated text
What-If Analysis, Charting, and Working with Large Worksheets 6
7. Rotating Text and Using the Fill Handle
to Create a Series of Month Names
• Point to the fill handle on the lower-right corner of
the cell containing the first month to display the
crosshair mouse pointer in preparation of filling the
month series
• Drag the fill handle to select the range to contain the
remainder of the series, and then release the mouse
button
• Click the Auto Fill Options button below the lower-
right corner of the fill area to display the Auto Fill
Options menu
• Click the Auto Fill Options button to hide the Auto Fill
Options menu
What-If Analysis, Charting, and Working with Large Worksheets 7
8. Rotating Text and Using the Fill Handle
to Create a Series of Month Names
What-If Analysis, Charting, and Working with Large Worksheets 8
9. Indenting Text in Cells
• Select the cell to which you want to apply the
indent
• Click the Increase Indent button on the Home tab
to increase the indentation of the text in the
selected cell
What-If Analysis, Charting, and Working with Large Worksheets 9
10. Copying a Range of Cells
to a Nonadjacent Destination Area
• Select the cell or range of cells to copy, and then
click the Copy button on the Home tab to copy
the values and formats of the selected range to
the Office Clipboard
• Click the first cell in the destination area
• Click the Paste button on the Home tab to copy
the values and formats of the last item placed on
the Office Clipboard to the destination area
What-If Analysis, Charting, and Working with Large Worksheets 10
11. Copying a Range of Cells
to a Nonadjacent Destination Area
What-If Analysis, Charting, and Working with Large Worksheets 11
12. Inserting a Row
• Right-click the row heading below where you
want to insert a row to display the shortcut menu
and the Mini toolbar
• Click Insert on the shortcut menu to insert a new
row in the worksheet by shifting the selected row
and all rows below it down one row
What-If Analysis, Charting, and Working with Large Worksheets 12
14. Entering Numbers with Format Symbols
What-If Analysis, Charting, and Working with Large Worksheets 14
15. Freezing Column and Row Titles
• Select the cell on which to freeze panes
• Display the View tab and then click the Freeze
Panes button to display the Freeze Panes gallery
• Click Freeze Panes in the Freeze Panes gallery to
freeze rows and columns to the left and above the
selected cell
What-If Analysis, Charting, and Working with Large Worksheets 15
16. Freezing Column and Row Titles
What-If Analysis, Charting, and Working with Large Worksheets 16
17. Entering the System Date
• Select the cell in which you want to insert the date,
and then click the Insert Function box in the formula
bar to display the Insert Function dialog box
• Click the ‘Or select a category’ box arrow and then
select Date & Time in the list to populate the ‘Select a
function’ list with date and time functions
• Scroll down in the ‘Select a function list’ and then
click NOW to select the function
• Click the OK button to close the Insert Function dialog
box
• Click the OK button to display the system date and
time in the selected cell
What-If Analysis, Charting, and Working with Large Worksheets 17
18. Entering the System Date
What-If Analysis, Charting, and Working with Large Worksheets 18
19. Absolute versus Relative Addressing
What-If Analysis, Charting, and Working with Large Worksheets 19
20. Absolute versus Relative Addressing
What-If Analysis, Charting, and Working with Large Worksheets 20
21. Entering an IF Function
• Click the cell to contain the formula, and then click
the Insert Function box in the formula bar to display
the Insert Function dialog box
• Click the ‘Or select a category’ box arrow and then
select Logical in the list to populate the ‘Select a
function’ list with logic functions
• Click IF in the ‘Select a function list’ to select the
required function
• Click the OK button to display the Function
Arguments dialog box
What-If Analysis, Charting, and Working with Large Worksheets 21
22. Entering an IF Function
• Enter the logical test in the Logical text box to
enter a logical test for the IF function
• Type the result of the IF function if the logical test
is true in the Value_if_true box
• Type the result of the IF function if the logical test
is false in the Value_if_false box
• Click the OK button to insert the IF function in the
selected cell
What-If Analysis, Charting, and Working with Large Worksheets 22
23. Entering an IF Function
What-If Analysis, Charting, and Working with Large Worksheets 23
24. Adding a Line Sparkline Chart
to the Worksheet
• Select the cell in which you want to insert a Sparkline
chart
• Display the Insert tab and then click Line to display
the Create Sparklines dialog box
• Drag through the range of cells of which you want to
chart, and then release the mouse button to insert
the selected range in the Data Range text box
• Click the OK button to insert a Line Sparkline chart in
the selected cell and display the Sparkline Tools
contextual tab
What-If Analysis, Charting, and Working with Large Worksheets 24
25. Adding a Line Sparkline Chart
to the Worksheet
What-If Analysis, Charting, and Working with Large Worksheets 25
26. Formatting the Sparkline Chart
• Select the cell containing the Sparkline chart, and
then click the More button on the Sparkline Tools
Design tab to display the Style gallery
• Click the desired Sparkline style to apply the style
to the Sparkline chart in the selected cell
What-If Analysis, Charting, and Working with Large Worksheets 26
27. Assigning Formats to Nonadjacent
Ranges
• Select the first range to format
• While holding down the CTRL key, select the
nonadjacent ranges
• Click the Format Cells: Number Dialog Box
Launcher on the Home tab to display the Format
Cells dialog box
• Click the desired category and style, and then click
the OK button
What-If Analysis, Charting, and Working with Large Worksheets 27
28. Assigning Formats to Nonadjacent
Ranges
What-If Analysis, Charting, and Working with Large Worksheets 28
29. Formatting the Worksheet Titles
• Select the desired cell(s) to format
• Click the Bold button on the Home tab to bold all of
the data in the selected cell(s)
• Click the Font Size box arrow on the Home tab, and
then click the desired font size
• Click the Fill Color button arrow on the Home tab,
and then click the desired color to add a background
color to the selected cell(s)
• Click the Font Color button arrow on the Home tab,
and then click the desired color to change the font
color of the selected cell(s)
What-If Analysis, Charting, and Working with Large Worksheets 29
30. Formatting the Worksheet Titles
What-If Analysis, Charting, and Working with Large Worksheets 30
31. Copying a Cell’s Format
Using the Format Painter Button
• Select the source cell for the format to paint
• Double-click the Format Painter button on the
Home tab
• Click the cell(s) to receive the format to assign the
format of the source cell to the destination cell(s)
• Press the ESC key to stop the format painter
What-If Analysis, Charting, and Working with Large Worksheets 31
32. Copying a Cell’s Format
Using the Format Painter Button
What-If Analysis, Charting, and Working with Large Worksheets 32
33. Drawing a 3-D Pie Chart
on a Separate Chart Sheet
• Select the range of cells to include in the chart
• Click the Pie button on the Insert tab to display the
Pie gallery
• Click the desired chart type in the Pie gallery
• Click the Move Chart button on the Chart Tools
Design tab to display the Move Chart dialog box
• Click New sheet, and then type the name of the sheet
tab for the chart sheet
• Click the OK button to move the chart to a new chart
sheet
What-If Analysis, Charting, and Working with Large Worksheets 33
34. Drawing a 3-D Pie Chart
on a Separate Chart Sheet
What-If Analysis, Charting, and Working with Large Worksheets 34
35. Inserting a Chart Title and Data Labels
• Click anywhere in the chart area outside the chart
to select the chart
• Click the Chart Title button on the Chart Tools
Layout tab to display the Chart Title gallery
• Click the desired option to add a chart title
• Select the text in the chart title and then type the
new chart title
• Display the Chart Tools Layout tab and then click
the Legend button to display the Legend gallery
What-If Analysis, Charting, and Working with Large Worksheets 35
36. Inserting a Chart Title and Data Labels
• Select the desired option for the legend
• Click the Data Labels button on the Layout tab and
then click the desired location for the data labels
• If necessary, right-click any data label to select all of
the data labels on the chart and to display a shortcut
menu
• Click the Format Data Labels command on the
shortcut menu to display the Format Data Labels
dialog box
• Select the desired formatting options for the data
labels, and then click the Close button to close the
Format Data Labels dialog box and display the chart
What-If Analysis, Charting, and Working with Large Worksheets 36
37. Inserting a Chart Title and Data Labels
What-If Analysis, Charting, and Working with Large Worksheets 37
38. Rotating a 3-D Pie Chart
• Select the chart, and then click the 3-D Rotation
button on the Chart Tools Layout tab to display
the Format Chart Area dialog box
• Click the Increase X Rotation button in the
Rotation area until the X rotation is at the desired
setting
• Click the Close button to close the dialog box and
display the rotated chart
What-If Analysis, Charting, and Working with Large Worksheets 38
39. Rotating a 3-D Pie Chart
What-If Analysis, Charting, and Working with Large Worksheets 39
40. Applying a 3-D Format to the Pie Chart
• Right-click the chart to display a shortcut menu
and Mini toolbar
• Click the Format Data Series command on the
shortcut menu to display the Format Data Series
dialog box and then click the 3-D Format category
on the left side of the dialog box to display the 3-
D Format panel
• Select the desired formatting options, and then
click the Close button to apply the desired
formatting to the chart
What-If Analysis, Charting, and Working with Large Worksheets 40
41. Applying a 3-D Format to the Pie Chart
What-If Analysis, Charting, and Working with Large Worksheets 41
42. Exploding the 3-D Pie Chart and
Changing the Color of a Slice
• Click the slice to explode twice (do not double-click), and then
right-click the slice to display a shortcut menu and Mini toolbar
• Click Format Data Point on the shortcut menu to display the
Format Data Point dialog box
• Drag the Point Explosion slider to the desired location to set
how far the slice in the 3-D Pie Chart should be offset from the
rest of the chart
• Click the Fill category on the left side of the dialog box to display
the Fill panel
• Click the desired fill type, and then click the Color button to
display the Color gallery
• Click the desired color in the color gallery and then click the
Close button to change the color of the selected slice and close
the dialog box
What-If Analysis, Charting, and Working with Large Worksheets 42
43. Exploding the 3-D Pie Chart and
Changing the Color of a Slice
What-If Analysis, Charting, and Working with Large Worksheets 43
44. Reordering the Sheet Tabs
• Drag the tab to reorder to the tabs
What-If Analysis, Charting, and Working with Large Worksheets 44
45. Shrinking and Magnifying the View
of a Worksheet or Chart
• Display the View tab and then click the Zoom
button to display a list of magnifications in the
Zoom dialog box
• Click the desired zoom level, and then click the OK
button
• Click the Zoom in button on the status bar until
the worksheet is displayed at the desired
magnification
What-If Analysis, Charting, and Working with Large Worksheets 45
46. Shrinking and Magnifying the View
of a Worksheet or Chart
What-If Analysis, Charting, and Working with Large Worksheets 46
47. Splitting a Window into Panes
• Click the cell at the intersection of the four
proposed panes to select the cell at which to split
the window
• Click the Split button on the View tab to divide
the window into four panes
What-If Analysis, Charting, and Working with Large Worksheets 47
48. Splitting a Window into Panes
What-If Analysis, Charting, and Working with Large Worksheets 48
49. What-If Analysis
• The automatic recalculation feature of Excel is a
powerful tool that can be used to analyze
worksheet data
• Using Excel to scrutinize the impact of changing
values in cells that are referenced by a formula in
another cell is called what-if analysis or sensitivity
analysis
What-If Analysis, Charting, and Working with Large Worksheets 49
50. Goal Seeking
• If you know the result you want a formula to
produce, you can use goal seeking to determine
the value of a cell on which the formula depends
– Goal Seek command on the Data tab
• Goal seeking assumes you can change the value of
only one cell referenced directly or indirectly to
reach a specific goal for a value in aother cell
What-If Analysis, Charting, and Working with Large Worksheets 50
53. Chapter Summary
• Rotate text in a cell
• Create a series of month names
• Copy, paste, insert, and delete cells
• Format numbers using format symbols
• Freeze and unfreeze rows and columns
• Show and format the system date
• Use absolute and mixed cell references in a
formula
• Use the IF function to perform a logical test
What-If Analysis, Charting, and Working with Large Worksheets 53
54. Chapter Summary
• Create Sparkline charts
• Use the Format Painter button to format cells
• Create a 3-D Pie chart on a separate chart sheet
• Rearrange worksheet tabs
• Change the worksheet view
• Answer what-if questions
• Goal seek to answer what-if questions
What-If Analysis, Charting, and Working with Large Worksheets 54