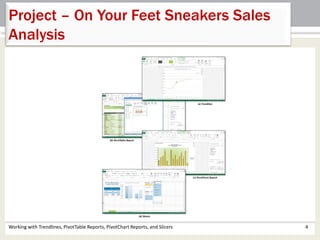
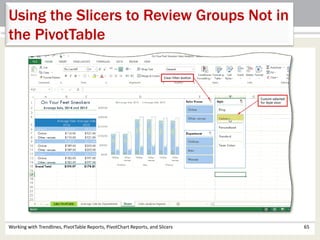
SlideShare a Scribd company logo
1 of 68
Microsoft 
Excel 2013 
Chapter 8 
Working with Trendlines, 
PivotTable Reports, 
PivotChart Reports, and 
Slicers
Objectives 
• Analyze worksheet data using a trendline 
• Create a PivotTable report 
• Format a PivotTable report 
• Apply filters to a PivotTable report 
• Create a PivotChart report 
• Format a PivotChart report 
• Apply filters to a PivotChart report 
Working with Trendlines, PivotTable Reports, PivotChart Reports, and Slicers 2
Objectives 
• Analyze worksheet data using PivotTable and 
PivotChart reports 
• Create calculated fields 
• Create slicers to filter PivotTable and PivotChart 
reports 
• Format slicers 
• Analyze PivotTable and PivotChart reports using 
slicers 
Working with Trendlines, PivotTable Reports, PivotChart Reports, and Slicers 3
Project – On Your Feet Sneakers Sales 
Analysis 
Working with Trendlines, PivotTable Reports, PivotChart Reports, and Slicers 4
Roadmap 
• Create the line chart and trendline 
• Create the PivotTable 
• Change the layout and view of the PivotTable 
• Filter the PivotTable 
• Format the PivotTable 
• Create the PivotChart 
• Change the PivotChart view and contents 
• Add slicers 
Working with Trendlines, PivotTable Reports, PivotChart Reports, and Slicers 5
Creating a 2-D Line Chart 
• Select the range of cells to be charted 
• Tap or click the Insert Line Chart button on the 
INSERT tab to display the Line Chart gallery 
• Tap or click the Line with Markers chart type in 
the 2-D Line area of the Insert Line Chart 
gallery to insert a 2-D line chart with data 
markers 
• Tap or click the Move Chart button on the 
CHART TOOLS DESIGN tab to display the Move 
Chart dialog box 
Working with Trendlines, PivotTable Reports, PivotChart Reports and Slicers 6
Creating a 2-D Line Chart 
• If necessary, double-tap or double-click the 
default text in the New sheet text box to select 
the text 
• Type the desired chart name 
• Tap or click the OK button to move the chart to 
a new sheet 
• Tap or click the default title to select it 
• Type the desired chart title and then press the 
ENTER key 
Working with Trendlines, PivotTable Reports, PivotChart Reports and Slicers 7
Creating a 2-D Line Chart 
Working with Trendlines, PivotTable Reports, PivotChart Reports and Slicers 8
Adding a Trendline to a Chart 
• Tap or click the chart to select it 
• Tap or click the Add Chart Elements button on the CHART 
TOOLS DESIGN tab to display the Add Chart Element menu 
• Tap or click the More Trendline Options to display the Format 
Trendline dialog box 
• If necessary, tap or click the Trendline Options button 
• Tap or click the desired trendline type 
• Tap or click the desired options in the Format Trendline dialog 
box 
• Tap or click the Close button to add the trendline with the 
selected options 
• Tap or click a desired theme on the PAGE LAYOUT tab 
Working with Trendlines, PivotTable Reports, PivotChart Reports, and Slicers 9
Adding a Trendline to a Chart 
Working with Trendlines, PivotTable Reports, PivotChart Reports, and Slicers 10
Changing the Format of a Data Point 
• Tap or click the desired data point twice to select the 
single point 
• Right-click or press and hold (touchscreen) the 
selected data point do display the shortcut menu 
• Tap or click Format Data Point on the shortcut menu 
to display the Format Data Point task pane 
• Tap or click the Fill & Line button, then tap or click 
MARKER 
• If necessary, tap or click MARKER OPTIONS to expand 
the section and select the desired options 
• Tap or click the Close button 
Working with Trendlines, PivotTable Reports, PivotChart Reports, and Slicers 11
Changing the Format of a Data Point 
Working with Trendlines, PivotTable Reports, PivotChart Reports, and Slicers 12
Creating a Blank PivotTable 
• Tap or click the desired cell containing the data for 
the PivotTable 
• Tap or click the PivotTable button on the INSERT tab 
to display the Create PivotTable dialog box 
• Click the OK button to create a blank PivotTable 
report on a new worksheet and display the PivotTable 
Fields task pane 
Working with Trendlines, PivotTable Reports, PivotChart Reports, and Slicers 13
Creating a Blank PivotTable 
Working with Trendlines, PivotTable Reports, PivotChart Reports, and Slicers 14
Adding Data to the PivotTable 
• Drag the desired field from the Choose fields to add 
to report area to the desired locations (rows or 
columns) 
• Drag the desired fields to the VALUES area 
Working with Trendlines, PivotTable Reports, PivotChart Reports, and Slicers 15
Adding Data to the PivotTable 
Working with Trendlines, PivotTable Reports, PivotChart Reports, and Slicers 16
Changing the Layout of a PivotTable 
• Tap or click the Report Layout button on the 
PIVOTTABLE TOOLS DESIGN tab to display the 
Report Layout 
menu 
• Click the desired 
layout 
Working with Trendlines, PivotTable Reports, PivotChart Reports, and Slicers 17
Changing the View of a PivotTable 
Report 
• Change the order of the fields in the ROWS or COLUMNS 
area to change the view 
Working with Trendlines, PivotTable Reports, PivotChart Reports, and Slicers 18
Filtering a PivotTable Report Using a 
Report Filter 
• Drag the desired field from the ‘Choose fields to add to 
report’ area to the Report Filter area in the PivotTable 
Fields task pane 
• Tap or click the field’s Filter button to display the Filter 
menu 
• Click to select the desired criterion 
• Click the OK button to update the display 
Working with Trendlines, PivotTable Reports, PivotChart Reports, and Slicers 19
Filtering a PivotTable Report Using a 
Report Filter 
Working with Trendlines, PivotTable Reports, PivotChart Reports, and Slicers 20
Filtering a PivotTable Report Using 
Multiple Selection Criteria 
• Drag the desired button from the ROWS or 
COLUMNS area to the FILTERS area 
• Drag the desired button from the FILTERS area to 
the ROWS or COLUMNS area 
• Tap or click the filter button to display the filter 
menu 
• Tap or click the desired check boxes to prepare to 
select multiple criteria 
• Tap or click the OK button 
Working with Trendlines, PivotTable Reports, PivotChart Reports, and Slicers 21
Filtering a PivotTable Report Using 
Multiple Selection Criteria 
Working with Trendlines, PivotTable Reports, PivotChart Reports, and Slicers 22
Removing a Report Filter from a 
PivotTable Report 
• Tap or click the filter button and tap or click the 
All check box to include all criteria in the 
PivotTable report 
• Tap or click the OK button 
• Drag the desired button out of the PivotTable 
Fields task pane to remove it from the report 
Working with Trendlines, PivotTable Reports, PivotChart Reports, and Slicers 23
Removing a Report Filter from a 
PivotTable Report 
Working with Trendlines, PivotTable Reports, PivotChart Reports, and Slicers 24
Filtering a PivotTable Report Using the 
Row Label Filter 
• Drag the desired button out of the ROWS area in the 
PivotTable Fields task pane to remove the field from the 
report 
• Tap or click the desired check box in the Choose fields to 
add to report list to add the desired field to the ROWS 
area 
• Tap or click the filter button to display the filter menu for 
the desired field 
• Tap or click the desired check boxes on the filter menu 
• Tap or click the OK button to update the display 
Working with Trendlines, PivotTable Reports, PivotChart Reports, and Slicers 25
Filtering a PivotTable Report Using the 
Row Label Filter 
Working with Trendlines, PivotTable Reports, PivotChart Reports, and Slicers 26
Removing a Row Label Filter from am PivotTable 
Report 
• Tap or click the Filter button to display the Filter menu 
• Tap or click the Clear Filter From command to remove the 
row label 
filter 
Working with Trendlines, PivotTable Reports, PivotChart Reports, and Slicers 27
Formatting a PivotTable Report 
• Select a cell in the PivotTable 
• Tap or click the More button in the PivotTable Styles 
gallery in the PIVOTTABLE TOOLS DESIGN tab to expand 
the gallery 
• Click the desired style 
• Format the cells as desired using the Format Cells dialog 
box 
Working with Trendlines, PivotTable Reports, PivotChart Reports, and Slicers 28
Formatting a PivotTable Report 
Working with Trendlines, PivotTable Reports, PivotChart Reports, and Slicers 29
Switching Summary Functions in a 
PivotTable 
• Press and hold or right-click the desired cell to display the 
shortcut menu and prepare for changing the summary 
function 
• Point to Summarize Values By on the shortcut menu to 
display the Summarize Values By menu 
• Click the desired command 
Working with Trendlines, PivotTable Reports, PivotChart Reports, and Slicers 30
Switching Summary Functions in a 
PivotTable 
Working with Trendlines, PivotTable Reports, PivotChart Reports, and Slicers 31
Adding a Second Value Calculation to a 
PivotTable Report 
• Drag the desired field from the PivotTable Fields 
task pane to the VALUES area 
• Tap or click the desired calculation 
• Tap or click the Value Field Settings to display the 
Value Field Settings dialog box 
• Tap or click the desired settings and then tap or 
click the OK button 
Working with Trendlines, PivotTable Reports, PivotChart Reports, and Slicers 32
Adding a Second Value Calculation to a 
PivotTable Report 
Working with Trendlines, PivotTable Reports, PivotChart Reports, and Slicers 33
Customizing the Display of the Field List and 
Field Headers in the PivotTable Report 
• Tap or click the Field list button and the Field 
Headers button on the PIVOTTABLE TOOLS 
ANALYZE tab to show or hide the fields 
• Tap or click the PivotTable Options button on the 
PIVOTTABLE TOOLS ANALYZE tab to display the 
PivotTable Options dialog box 
• Tap or click the desired settings 
• Tap or click the OK button 
Working with Trendlines, PivotTable Reports, PivotChart Reports and Slicers 34
Customizing the Display of the Field List and 
Field Headers in the PivotTable Report 
Working with Trendlines, PivotTable Reports, PivotChart Reports, and Slicers 35
Customizing the Display of the Expand and 
Collapse Buttons in a PivotTable Report 
• Tap or click the Collapse button to collapse or expand the 
desired selection 
• Press and hold or right-click the desired cell to display the 
shortcut menu and then point to Expand/Collapse to 
display the Expand/Collapse submenu 
• Tap or click the desired settings 
Working with Trendlines, PivotTable Reports, PivotChart Reports, and Slicers 36
Customizing the Display of the Expand and 
Collapse Buttons in a PivotTable Report 
Working with Trendlines, PivotTable Reports, PivotChart Reports, and Slicers 37
Updating the Contents of a PivotTable 
Report 
• Modify the contents of the desired cell on the desired 
sheet tab 
• Tap or click the desired PivotTable sheet tab to make it 
active 
• Tap or click any cell in the PivotTable report to make it 
active 
• Tap or click the Refresh button on the PIVOTTABLE TOOLS 
ANALYZE tab to update the PivotTable report 
Working with Trendlines, PivotTable Reports, PivotChart Reports, and Slicers 38
Updating the Contents of a PivotTable 
Report 
Working with Trendlines, PivotTable Reports, PivotChart Reports, and Slicers 39
Creating a PivotChart Report from an 
Existing PivotTable Report 
• Select a cell in the PivotTable report 
• Click the Field List button on the PIVOTTABLE TOOLS 
ANALYZE tab to display the PivotTable Field List pane 
• Click the PivotChart button on the PIVOTTABLE TOOLS 
ANALYZE tab to display the Insert Chart dialog box 
• Click the desired chart type 
• Click the OK button to add the chart to the worksheet 
Working with Trendlines, PivotTable Reports, PivotChart Reports, and Slicers 40
Creating a PivotChart Report from an 
Existing PivotTable Report 
Working with Trendlines, PivotTable Reports, PivotChart Reports, and Slicers 41
Changing the Location of a PivotChart 
Report and Deleting Data 
• With the chart selected, click the Move Chart button on 
the PIVOTTABLE TOOLS DESIGN tab PivotChart Tools to 
display the Move Chart dialog box 
• Tap or click the New sheet option button to select it 
• Type the desired name in the New sheet text box 
• Tap or click the OK button to move the chart to the new 
sheet 
• In the PivotTable Field List pane, drag the desired items 
out of the Values area 
Working with Trendlines, PivotTable Reports, PivotChart Reports, and Slicers 42
Changing the Location of a PivotChart 
Report and Deleting Data 
Working with Trendlines, PivotTable Reports, PivotChart Reports, and Slicers 43
Changing the PivotChart Type and 
Formatting the Chart 
• Tap or click the chart to select the data series 
• Press and hold or right-click to display the shortcut menu 
• Tap or click Format Data Series on the shortcut menu to 
open the Format Data Series task pane 
• Tap or click the desired chart type 
• Tap or click the Close button 
• Tap or click the Chart Elements arrow on the 
PIVOTCHART 
• TOOLS FORMAT tab to display the Chart Elements menu 
• Tap or click the desired formatting changes 
Working with Trendlines, PivotTable Reports, PivotChart Reports, and Slicers 44
Changing the PivotChart Type and 
Formatting the Chart 
Working with Trendlines, PivotTable Reports, PivotChart Reports, and Slicers 45
Changing the View of a PivotChart 
• If necessary, click the Field List button on the 
PIVOTCHART TOOLS ANALYZE tab to display the 
PivotTable Field List pane 
• Select and deselect the fields as desired 
• Add, delete, and reorder the desired fields in the 
AXIS area 
• Tap or click the PivotChart Report sheet tab to 
make it the active tab 
Working with Trendlines, PivotTable Reports, PivotChart Reports and Slicers 46
Changing the View of a PivotChart 
Working with Trendlines, PivotTable Reports, PivotChart Reports, and Slicers 47
Creating a PivotChart Report Directly 
from Data 
• Select a cell containing the data 
• Tap or click the PivotChart arrow on the INSERT tab to 
display the PivotChart menu 
• Tap or click the PivotChart & PivotTable on the PivotChart 
menu to display the Create PivotTable with PivotChart 
dialog box 
• If necessary, tap or click the New Worksheet option button 
• Tap or click the OK button to add a new worksheet 
containing a blank PivotTable and blank PivotChart 
• Add the desired fields to the Axis Fields and Values areas 
Working with Trendlines, PivotTable Reports, PivotChart Reports, and Slicers 48
Creating a PivotChart Report Directly 
from Data 
Working with Trendlines, PivotTable Reports, PivotChart Reports, and Slicers 49
Adding a Calculated Field to a PivotTable 
Report 
• If necessary, tap or click the PivotTable to make it 
active 
• Tap or click the Fields, Items, & Sets button on the 
PIVOTTABLE TOOLS ANALYZE tab to display the Fields, 
Items, & Sets menu 
• Tap or click the Calculated Field command on the 
Fields, Items, & Sets menu to display the Insert 
Calculated Field dialog box 
• Enter the name, and formula, and then click the Add 
button to add the calculated field to the Fields list 
• Click the OK button to close the dialog box 
Working with Trendlines, PivotTable Reports, PivotChart Reports, and Slicers 50
Adding a Calculated Field to a PivotTable 
Report 
Working with Trendlines, PivotTable Reports, PivotChart Reports, and Slicers 51
Formatting the PivotTable and PivotChart 
• Tap or click the Field List button on the 
PIVOTTABLE TOOLS ANALYZE tab to display the 
PivotTable Fields task pane 
• Tap or click DESIGN on the ribbon to display the 
PIVOTTABLE TOOLS DESIGN tab and make the 
desired formatting changes 
• Use the Field List button, the +/- Buttons button, 
and the Field Headers button on the PIVOTTABLE 
TOOLS ANALYZE to hide the field list, the 
Expand/Collapse buttons, and the field headers 
Working with Trendlines, PivotTable Reports, PivotChart Reports, and Slicers 52
Formatting the PivotTable and PivotChart 
Working with Trendlines, PivotTable Reports, PivotChart Reports, and Slicers 53
Formatting the PivotChart 
• Tap or click in the PivotChart report to select it 
• Apply the desired styles from the Chart Styles gallery 
• Use the ‘Chart Quick Colors’ button on the 
PIVOTCHART TOOLS DESIGN tab to change the colors 
• Use the ‘Add Chart Element’ button on the 
PIVOTCHART TOOLS DESIGN tab to position the 
legend 
• Tap or click the Field Buttons button on the 
PIVOTCHART TOOLS ANALYZE tab to show or hide the 
field button 
Working with Trendlines, PivotTable Reports, PivotChart Reports, and Slicers 54
Formatting the PivotChart 
Working with Trendlines, PivotTable Reports, PivotChart Reports, and Slicers 55
Copying a PivotTable and PivotChart 
• Create a copy of the worksheet 
Working with Trendlines, PivotTable Reports, PivotChart Reports, and Slicers 56
Formatting the PivotChart 
• Use the ‘Chart Quick Colors’ button on the 
PIVOTCHART DESIGN tab to apply the desired 
color 
Working with Trendlines, PivotTable Reports, PivotChart Reports, and Slicers 57
Formatting the PivotChart 
• If necessary, tap or click to make the PivotChart 
active 
• Tap or click the Insert Slicer button arrow on the 
PIVOTCHART TOOLS ANALYZE tab to display the 
Insert Slicers dialog box 
• Click the check boxes to select the desired slicers 
to insert 
• Click the OK button to display the selected slicers 
on the worksheet 
Working with Trendlines, PivotTable Reports, PivotChart Reports, and Slicers 58
Formatting the PivotChart 
Working with Trendlines, PivotTable Reports, PivotChart Reports, and Slicers 59
Formatting Slicers 
• Tap or click and then drag the desired slicer to the 
desired location 
• Hold down the ctrl key and then tap or click to 
select multiple slicers 
• Tap or click the Height box on the SLICER TOOLS 
OPTIONS tab to set the button height 
• Tap or click the desired Slicer style on the SLICER 
TOOLS OPTIONS tab to apply it to the slicers 
• Tap or click any cell to deselect the slicer 
Working with Trendlines, PivotTable Reports, PivotChart Reports, and Slicers 60
Formatting Slicers 
Working with Trendlines, PivotTable Reports, PivotChart Reports, and Slicers 61
Using the Slicers to Review Groups in the 
PivotTable 
• Hold down the CTRL key and then tap or click the 
desired slicer to remove the data from the 
PivotTable and PivotChart calculations. 
• Release the CTRL key and then tap or click the 
desired slicer to display that slicer’s data only 
• Tap or click different slicers slicer to see the data 
for those slicers only 
Working with Trendlines, PivotTable Reports, PivotChart Reports, and Slicers 62
Using the Slicers to Review Groups in the 
PivotTable 
Working with Trendlines, PivotTable Reports, PivotChart Reports, and Slicers 63
Using the Slicers to Review Groups Not in 
the PivotTable 
• Tap or click the Clear Filter button on the desired 
slicers to remove the filters and return the 
PivotTable and PivotCharts to their unfiltered 
states 
• Tap or click Custom in the desired slicer to see the 
aggregate data options 
• Tap or click different styles and combinations of 
styles to see how the aggregate data changes 
Working with Trendlines, PivotTable Reports, PivotChart Reports, and Slicers 64
Using the Slicers to Review Groups Not in 
the PivotTable 
Working with Trendlines, PivotTable Reports, PivotChart Reports, and Slicers 65
Chapter Summary 
• Analyze worksheet data using a trendline 
• Create a PivotTable report 
• Format a PivotTable report 
• Apply filters to a PivotTable report 
• Create a PivotChart report 
• Format a PivotChart report 
• Apply filters to a PivotChart report 
Working with Trendlines, PivotTable Reports, PivotChart Reports, and Slicers 66
Chapter Summary 
• Analyze worksheet data using PivotTable and 
PivotChart reports 
• Create calculated fields 
• Create slicers to filter PivotTable and PivotChart 
reports 
• Format slicers 
• Analyze PivotTable and PivotChart reports using 
slicers 
Working with Trendlines, PivotTable Reports, PivotChart Reports, and Slicers 67
Microsoft 
Excel 2013 
Chapter 8 
Complete

More Related Content

What's hot

Access Chapter 01
Access Chapter 01Access Chapter 01
Access Chapter 01xtin101
 
Excel Chapter 03
Excel Chapter 03Excel Chapter 03
Excel Chapter 03jgardne4
 
Access2013 ch03
Access2013 ch03Access2013 ch03
Access2013 ch03xtin101
 
Access Chapter 02
Access Chapter 02Access Chapter 02
Access Chapter 02xtin101
 
Creating a table in ms access
Creating a table in ms accessCreating a table in ms access
Creating a table in ms accessArunodayKatiyar
 
Excel chapter 05
Excel chapter 05Excel chapter 05
Excel chapter 05teeworthy
 
Excel Chapter 02
Excel Chapter 02Excel Chapter 02
Excel Chapter 02jgardne4
 
Excel chapter 01
Excel chapter 01Excel chapter 01
Excel chapter 01teeworthy
 
Excel chapter 01
Excel chapter 01Excel chapter 01
Excel chapter 01jgardne4
 
Office 2013 reference card
Office 2013 reference cardOffice 2013 reference card
Office 2013 reference cardShahid Husain
 
Creating charts and graphics
Creating charts and graphicsCreating charts and graphics
Creating charts and graphicsum5ashm
 
Creating charts and graphics
Creating charts and graphicsCreating charts and graphics
Creating charts and graphicsum5ashm
 
Lesson 18 Creating Pivot Tables
Lesson 18 Creating Pivot TablesLesson 18 Creating Pivot Tables
Lesson 18 Creating Pivot Tablesguevarra_2000
 
Access Chapter 02
Access Chapter 02Access Chapter 02
Access Chapter 02jgardne4
 
Excel 2007 quick reference
Excel 2007 quick referenceExcel 2007 quick reference
Excel 2007 quick referenceMostafa Al Ashery
 
Gl13 m6-c4-presentation
Gl13 m6-c4-presentationGl13 m6-c4-presentation
Gl13 m6-c4-presentationTracie King
 

What's hot (19)

Access Chapter 01
Access Chapter 01Access Chapter 01
Access Chapter 01
 
Access2013 ch04
Access2013 ch04Access2013 ch04
Access2013 ch04
 
Excel Chapter 03
Excel Chapter 03Excel Chapter 03
Excel Chapter 03
 
Access2013 ch03
Access2013 ch03Access2013 ch03
Access2013 ch03
 
Access Chapter 02
Access Chapter 02Access Chapter 02
Access Chapter 02
 
Creating a table in ms access
Creating a table in ms accessCreating a table in ms access
Creating a table in ms access
 
Access2013 ch10
Access2013 ch10Access2013 ch10
Access2013 ch10
 
Excel chapter 05
Excel chapter 05Excel chapter 05
Excel chapter 05
 
Excel Chapter 02
Excel Chapter 02Excel Chapter 02
Excel Chapter 02
 
Excel chapter 01
Excel chapter 01Excel chapter 01
Excel chapter 01
 
Excel chapter 01
Excel chapter 01Excel chapter 01
Excel chapter 01
 
Office 2013 reference card
Office 2013 reference cardOffice 2013 reference card
Office 2013 reference card
 
Creating charts and graphics
Creating charts and graphicsCreating charts and graphics
Creating charts and graphics
 
Creating charts and graphics
Creating charts and graphicsCreating charts and graphics
Creating charts and graphics
 
Lesson 18 Creating Pivot Tables
Lesson 18 Creating Pivot TablesLesson 18 Creating Pivot Tables
Lesson 18 Creating Pivot Tables
 
Excel 2007 Unit C
Excel 2007 Unit CExcel 2007 Unit C
Excel 2007 Unit C
 
Access Chapter 02
Access Chapter 02Access Chapter 02
Access Chapter 02
 
Excel 2007 quick reference
Excel 2007 quick referenceExcel 2007 quick reference
Excel 2007 quick reference
 
Gl13 m6-c4-presentation
Gl13 m6-c4-presentationGl13 m6-c4-presentation
Gl13 m6-c4-presentation
 

Viewers also liked

Viewers also liked (18)

Access2013 ch05
Access2013 ch05Access2013 ch05
Access2013 ch05
 
9780840024220 ppt ch02
9780840024220 ppt ch029780840024220 ppt ch02
9780840024220 ppt ch02
 
9780840024220 ppt ch12
9780840024220 ppt ch129780840024220 ppt ch12
9780840024220 ppt ch12
 
9780840024220 ppt ch10
9780840024220 ppt ch109780840024220 ppt ch10
9780840024220 ppt ch10
 
Access2013 ch08
Access2013 ch08Access2013 ch08
Access2013 ch08
 
Access2013 ch06
Access2013 ch06Access2013 ch06
Access2013 ch06
 
Chapter 10
Chapter 10Chapter 10
Chapter 10
 
Chapter 13
Chapter 13Chapter 13
Chapter 13
 
Access2013 ch09
Access2013 ch09Access2013 ch09
Access2013 ch09
 
9781305119215 rm, 10e ch03
9781305119215 rm, 10e ch039781305119215 rm, 10e ch03
9781305119215 rm, 10e ch03
 
Excel ch10
Excel ch10Excel ch10
Excel ch10
 
Word ch07
Word ch07Word ch07
Word ch07
 
Word ch09
Word ch09Word ch09
Word ch09
 
Word ch10
Word ch10Word ch10
Word ch10
 
Word ch11
Word ch11Word ch11
Word ch11
 
Word ch05
Word ch05Word ch05
Word ch05
 
PowerPoint Chapter 03
PowerPoint Chapter 03PowerPoint Chapter 03
PowerPoint Chapter 03
 
Excel SUMIFS Function
Excel SUMIFS FunctionExcel SUMIFS Function
Excel SUMIFS Function
 

Similar to Excel ch08

MS Excel Pivot Table Reports & Charts
MS Excel Pivot Table Reports & ChartsMS Excel Pivot Table Reports & Charts
MS Excel Pivot Table Reports & Chartsdnbakhan
 
Chapter 7 -DescriptiveStatistics and Pivot Table
Chapter 7 -DescriptiveStatistics and Pivot TableChapter 7 -DescriptiveStatistics and Pivot Table
Chapter 7 -DescriptiveStatistics and Pivot TableIzwan Nizal Mohd Shaharanee
 
Excel chapter 03
Excel chapter 03Excel chapter 03
Excel chapter 03teeworthy
 
R04 - Basics of Reporting: Report Setup Part 2
R04 - Basics of Reporting: Report Setup Part 2 R04 - Basics of Reporting: Report Setup Part 2
R04 - Basics of Reporting: Report Setup Part 2 Maintenance Connection
 
A Power Dive into Pivot Tables (Transform raw data into compelling)
A Power Dive into Pivot Tables (Transform raw data into compelling)A Power Dive into Pivot Tables (Transform raw data into compelling)
A Power Dive into Pivot Tables (Transform raw data into compelling)jahanvi52
 
PowerPoint 2013 ch04
PowerPoint 2013 ch04PowerPoint 2013 ch04
PowerPoint 2013 ch04Kristin Harrison
 
Working with Pivot Tables
Working with Pivot TablesWorking with Pivot Tables
Working with Pivot TablesKingston Tagoe
 
Excel chapter 02
Excel chapter 02Excel chapter 02
Excel chapter 02teeworthy
 
MS-Excel Working with Pivot Table
MS-Excel Working with Pivot TableMS-Excel Working with Pivot Table
MS-Excel Working with Pivot TableP. SUNDARI ARUN
 
Gl2010 m6 ex4_presentation
Gl2010 m6 ex4_presentationGl2010 m6 ex4_presentation
Gl2010 m6 ex4_presentationTracie King
 
MIS 226: Chapter 3
MIS 226: Chapter 3MIS 226: Chapter 3
MIS 226: Chapter 3macrob14
 
Excel 2007 Get Started With Pivot Table Reports
Excel 2007  Get Started With  Pivot Table ReportsExcel 2007  Get Started With  Pivot Table Reports
Excel 2007 Get Started With Pivot Table ReportsOklahoma Dept. Mental Health
 

Similar to Excel ch08 (15)

MS Excel Pivot Table Reports & Charts
MS Excel Pivot Table Reports & ChartsMS Excel Pivot Table Reports & Charts
MS Excel Pivot Table Reports & Charts
 
Chapter 7 -DescriptiveStatistics and Pivot Table
Chapter 7 -DescriptiveStatistics and Pivot TableChapter 7 -DescriptiveStatistics and Pivot Table
Chapter 7 -DescriptiveStatistics and Pivot Table
 
Excel chapter 03
Excel chapter 03Excel chapter 03
Excel chapter 03
 
R04 - Basics of Reporting: Report Setup Part 2
R04 - Basics of Reporting: Report Setup Part 2 R04 - Basics of Reporting: Report Setup Part 2
R04 - Basics of Reporting: Report Setup Part 2
 
A Power Dive into Pivot Tables (Transform raw data into compelling)
A Power Dive into Pivot Tables (Transform raw data into compelling)A Power Dive into Pivot Tables (Transform raw data into compelling)
A Power Dive into Pivot Tables (Transform raw data into compelling)
 
PowerPoint 2013 ch04
PowerPoint 2013 ch04PowerPoint 2013 ch04
PowerPoint 2013 ch04
 
Working with Pivot Tables
Working with Pivot TablesWorking with Pivot Tables
Working with Pivot Tables
 
Excel chapter 02
Excel chapter 02Excel chapter 02
Excel chapter 02
 
MS-Excel Working with Pivot Table
MS-Excel Working with Pivot TableMS-Excel Working with Pivot Table
MS-Excel Working with Pivot Table
 
Gl2010 m6 ex4_presentation
Gl2010 m6 ex4_presentationGl2010 m6 ex4_presentation
Gl2010 m6 ex4_presentation
 
Bar chart Creation
Bar chart CreationBar chart Creation
Bar chart Creation
 
Ppt2013 ch09
Ppt2013 ch09Ppt2013 ch09
Ppt2013 ch09
 
MIS 226: Chapter 3
MIS 226: Chapter 3MIS 226: Chapter 3
MIS 226: Chapter 3
 
Word Chapter 04
Word Chapter 04Word Chapter 04
Word Chapter 04
 
Excel 2007 Get Started With Pivot Table Reports
Excel 2007  Get Started With  Pivot Table ReportsExcel 2007  Get Started With  Pivot Table Reports
Excel 2007 Get Started With Pivot Table Reports
 

More from Kristin Harrison (20)

rm, 10e ch02 copy
rm, 10e ch02 copyrm, 10e ch02 copy
rm, 10e ch02 copy
 
9780840024220 ppt ch11
9780840024220 ppt ch119780840024220 ppt ch11
9780840024220 ppt ch11
 
9780840024220 ppt ch09
9780840024220 ppt ch099780840024220 ppt ch09
9780840024220 ppt ch09
 
9780840024220 ppt ch08
9780840024220 ppt ch089780840024220 ppt ch08
9780840024220 ppt ch08
 
9780840024220 ppt ch03
9780840024220 ppt ch039780840024220 ppt ch03
9780840024220 ppt ch03
 
9780840024220 ppt ch05
9780840024220 ppt ch059780840024220 ppt ch05
9780840024220 ppt ch05
 
9780840024220 ppt ch04
9780840024220 ppt ch049780840024220 ppt ch04
9780840024220 ppt ch04
 
9780840024220 ppt ch07
9780840024220 ppt ch079780840024220 ppt ch07
9780840024220 ppt ch07
 
9780840024220 ppt ch06
9780840024220 ppt ch069780840024220 ppt ch06
9780840024220 ppt ch06
 
9780840024220 ppt ch01
9780840024220 ppt ch019780840024220 ppt ch01
9780840024220 ppt ch01
 
Chapter 14
Chapter 14Chapter 14
Chapter 14
 
Chapter 12
Chapter 12Chapter 12
Chapter 12
 
Chapter 11
Chapter 11Chapter 11
Chapter 11
 
Chapter 09
Chapter 09Chapter 09
Chapter 09
 
Chapter 08
Chapter 08Chapter 08
Chapter 08
 
Chapter 07
Chapter 07Chapter 07
Chapter 07
 
Chapter 05
Chapter 05Chapter 05
Chapter 05
 
Chapter 06
Chapter 06Chapter 06
Chapter 06
 
Chapter 04
Chapter 04Chapter 04
Chapter 04
 
Chapter 01
Chapter 01Chapter 01
Chapter 01
 

Recently uploaded

Employee wellbeing at the workplace.pptx
Employee wellbeing at the workplace.pptxEmployee wellbeing at the workplace.pptx
Employee wellbeing at the workplace.pptxNirmalaLoungPoorunde1
 
SOCIAL AND HISTORICAL CONTEXT - LFTVD.pptx
SOCIAL AND HISTORICAL CONTEXT - LFTVD.pptxSOCIAL AND HISTORICAL CONTEXT - LFTVD.pptx
SOCIAL AND HISTORICAL CONTEXT - LFTVD.pptxiammrhaywood
 
Organic Name Reactions for the students and aspirants of Chemistry12th.pptx
Organic Name Reactions  for the students and aspirants of Chemistry12th.pptxOrganic Name Reactions  for the students and aspirants of Chemistry12th.pptx
Organic Name Reactions for the students and aspirants of Chemistry12th.pptxVS Mahajan Coaching Centre
 
Separation of Lanthanides/ Lanthanides and Actinides
Separation of Lanthanides/ Lanthanides and ActinidesSeparation of Lanthanides/ Lanthanides and Actinides
Separation of Lanthanides/ Lanthanides and ActinidesFatimaKhan178732
 
Introduction to ArtificiaI Intelligence in Higher Education
Introduction to ArtificiaI Intelligence in Higher EducationIntroduction to ArtificiaI Intelligence in Higher Education
Introduction to ArtificiaI Intelligence in Higher Educationpboyjonauth
 
Science 7 - LAND and SEA BREEZE and its Characteristics
Science 7 - LAND and SEA BREEZE and its CharacteristicsScience 7 - LAND and SEA BREEZE and its Characteristics
Science 7 - LAND and SEA BREEZE and its CharacteristicsKarinaGenton
 
Concept of Vouching. B.Com(Hons) /B.Compdf
Concept of Vouching. B.Com(Hons) /B.CompdfConcept of Vouching. B.Com(Hons) /B.Compdf
Concept of Vouching. B.Com(Hons) /B.CompdfUmakantAnnand
 
Interactive Powerpoint_How to Master effective communication
Interactive Powerpoint_How to Master effective communicationInteractive Powerpoint_How to Master effective communication
Interactive Powerpoint_How to Master effective communicationnomboosow
 
The Most Excellent Way | 1 Corinthians 13
The Most Excellent Way | 1 Corinthians 13The Most Excellent Way | 1 Corinthians 13
The Most Excellent Way | 1 Corinthians 13Steve Thomason
 
Class 11 Legal Studies Ch-1 Concept of State .pdf
Class 11 Legal Studies Ch-1 Concept of State .pdfClass 11 Legal Studies Ch-1 Concept of State .pdf
Class 11 Legal Studies Ch-1 Concept of State .pdfakmcokerachita
 
Software Engineering Methodologies (overview)
Software Engineering Methodologies (overview)Software Engineering Methodologies (overview)
Software Engineering Methodologies (overview)eniolaolutunde
 
_Math 4-Q4 Week 5.pptx Steps in Collecting Data
_Math 4-Q4 Week 5.pptx Steps in Collecting Data_Math 4-Q4 Week 5.pptx Steps in Collecting Data
_Math 4-Q4 Week 5.pptx Steps in Collecting DataJhengPantaleon
 
POINT- BIOCHEMISTRY SEM 2 ENZYMES UNIT 5.pptx
POINT- BIOCHEMISTRY SEM 2 ENZYMES UNIT 5.pptxPOINT- BIOCHEMISTRY SEM 2 ENZYMES UNIT 5.pptx
POINT- BIOCHEMISTRY SEM 2 ENZYMES UNIT 5.pptxSayali Powar
 
Crayon Activity Handout For the Crayon A
Crayon Activity Handout For the Crayon ACrayon Activity Handout For the Crayon A
Crayon Activity Handout For the Crayon AUnboundStockton
 
Call Girls in Dwarka Mor Delhi Contact Us 9654467111
Call Girls in Dwarka Mor Delhi Contact Us 9654467111Call Girls in Dwarka Mor Delhi Contact Us 9654467111
Call Girls in Dwarka Mor Delhi Contact Us 9654467111Sapana Sha
 

Recently uploaded (20)

Employee wellbeing at the workplace.pptx
Employee wellbeing at the workplace.pptxEmployee wellbeing at the workplace.pptx
Employee wellbeing at the workplace.pptx
 
Model Call Girl in Bikash Puri Delhi reach out to us at 🔝9953056974🔝
Model Call Girl in Bikash Puri  Delhi reach out to us at 🔝9953056974🔝Model Call Girl in Bikash Puri  Delhi reach out to us at 🔝9953056974🔝
Model Call Girl in Bikash Puri Delhi reach out to us at 🔝9953056974🔝
 
SOCIAL AND HISTORICAL CONTEXT - LFTVD.pptx
SOCIAL AND HISTORICAL CONTEXT - LFTVD.pptxSOCIAL AND HISTORICAL CONTEXT - LFTVD.pptx
SOCIAL AND HISTORICAL CONTEXT - LFTVD.pptx
 
Organic Name Reactions for the students and aspirants of Chemistry12th.pptx
Organic Name Reactions  for the students and aspirants of Chemistry12th.pptxOrganic Name Reactions  for the students and aspirants of Chemistry12th.pptx
Organic Name Reactions for the students and aspirants of Chemistry12th.pptx
 
Separation of Lanthanides/ Lanthanides and Actinides
Separation of Lanthanides/ Lanthanides and ActinidesSeparation of Lanthanides/ Lanthanides and Actinides
Separation of Lanthanides/ Lanthanides and Actinides
 
Introduction to ArtificiaI Intelligence in Higher Education
Introduction to ArtificiaI Intelligence in Higher EducationIntroduction to ArtificiaI Intelligence in Higher Education
Introduction to ArtificiaI Intelligence in Higher Education
 
Science 7 - LAND and SEA BREEZE and its Characteristics
Science 7 - LAND and SEA BREEZE and its CharacteristicsScience 7 - LAND and SEA BREEZE and its Characteristics
Science 7 - LAND and SEA BREEZE and its Characteristics
 
CĂłdigo Creativo y Arte de Software | Unidad 1
CĂłdigo Creativo y Arte de Software | Unidad 1CĂłdigo Creativo y Arte de Software | Unidad 1
CĂłdigo Creativo y Arte de Software | Unidad 1
 
Concept of Vouching. B.Com(Hons) /B.Compdf
Concept of Vouching. B.Com(Hons) /B.CompdfConcept of Vouching. B.Com(Hons) /B.Compdf
Concept of Vouching. B.Com(Hons) /B.Compdf
 
Interactive Powerpoint_How to Master effective communication
Interactive Powerpoint_How to Master effective communicationInteractive Powerpoint_How to Master effective communication
Interactive Powerpoint_How to Master effective communication
 
TataKelola dan KamSiber Kecerdasan Buatan v022.pdf
TataKelola dan KamSiber Kecerdasan Buatan v022.pdfTataKelola dan KamSiber Kecerdasan Buatan v022.pdf
TataKelola dan KamSiber Kecerdasan Buatan v022.pdf
 
The Most Excellent Way | 1 Corinthians 13
The Most Excellent Way | 1 Corinthians 13The Most Excellent Way | 1 Corinthians 13
The Most Excellent Way | 1 Corinthians 13
 
Class 11 Legal Studies Ch-1 Concept of State .pdf
Class 11 Legal Studies Ch-1 Concept of State .pdfClass 11 Legal Studies Ch-1 Concept of State .pdf
Class 11 Legal Studies Ch-1 Concept of State .pdf
 
Model Call Girl in Tilak Nagar Delhi reach out to us at 🔝9953056974🔝
Model Call Girl in Tilak Nagar Delhi reach out to us at 🔝9953056974🔝Model Call Girl in Tilak Nagar Delhi reach out to us at 🔝9953056974🔝
Model Call Girl in Tilak Nagar Delhi reach out to us at 🔝9953056974🔝
 
Software Engineering Methodologies (overview)
Software Engineering Methodologies (overview)Software Engineering Methodologies (overview)
Software Engineering Methodologies (overview)
 
_Math 4-Q4 Week 5.pptx Steps in Collecting Data
_Math 4-Q4 Week 5.pptx Steps in Collecting Data_Math 4-Q4 Week 5.pptx Steps in Collecting Data
_Math 4-Q4 Week 5.pptx Steps in Collecting Data
 
POINT- BIOCHEMISTRY SEM 2 ENZYMES UNIT 5.pptx
POINT- BIOCHEMISTRY SEM 2 ENZYMES UNIT 5.pptxPOINT- BIOCHEMISTRY SEM 2 ENZYMES UNIT 5.pptx
POINT- BIOCHEMISTRY SEM 2 ENZYMES UNIT 5.pptx
 
Crayon Activity Handout For the Crayon A
Crayon Activity Handout For the Crayon ACrayon Activity Handout For the Crayon A
Crayon Activity Handout For the Crayon A
 
Staff of Color (SOC) Retention Efforts DDSD
Staff of Color (SOC) Retention Efforts DDSDStaff of Color (SOC) Retention Efforts DDSD
Staff of Color (SOC) Retention Efforts DDSD
 
Call Girls in Dwarka Mor Delhi Contact Us 9654467111
Call Girls in Dwarka Mor Delhi Contact Us 9654467111Call Girls in Dwarka Mor Delhi Contact Us 9654467111
Call Girls in Dwarka Mor Delhi Contact Us 9654467111
 

Excel ch08

  • 1. Microsoft Excel 2013 Chapter 8 Working with Trendlines, PivotTable Reports, PivotChart Reports, and Slicers
  • 2. Objectives • Analyze worksheet data using a trendline • Create a PivotTable report • Format a PivotTable report • Apply filters to a PivotTable report • Create a PivotChart report • Format a PivotChart report • Apply filters to a PivotChart report Working with Trendlines, PivotTable Reports, PivotChart Reports, and Slicers 2
  • 3. Objectives • Analyze worksheet data using PivotTable and PivotChart reports • Create calculated fields • Create slicers to filter PivotTable and PivotChart reports • Format slicers • Analyze PivotTable and PivotChart reports using slicers Working with Trendlines, PivotTable Reports, PivotChart Reports, and Slicers 3
  • 4. Project – On Your Feet Sneakers Sales Analysis Working with Trendlines, PivotTable Reports, PivotChart Reports, and Slicers 4
  • 5. Roadmap • Create the line chart and trendline • Create the PivotTable • Change the layout and view of the PivotTable • Filter the PivotTable • Format the PivotTable • Create the PivotChart • Change the PivotChart view and contents • Add slicers Working with Trendlines, PivotTable Reports, PivotChart Reports, and Slicers 5
  • 6. Creating a 2-D Line Chart • Select the range of cells to be charted • Tap or click the Insert Line Chart button on the INSERT tab to display the Line Chart gallery • Tap or click the Line with Markers chart type in the 2-D Line area of the Insert Line Chart gallery to insert a 2-D line chart with data markers • Tap or click the Move Chart button on the CHART TOOLS DESIGN tab to display the Move Chart dialog box Working with Trendlines, PivotTable Reports, PivotChart Reports and Slicers 6
  • 7. Creating a 2-D Line Chart • If necessary, double-tap or double-click the default text in the New sheet text box to select the text • Type the desired chart name • Tap or click the OK button to move the chart to a new sheet • Tap or click the default title to select it • Type the desired chart title and then press the ENTER key Working with Trendlines, PivotTable Reports, PivotChart Reports and Slicers 7
  • 8. Creating a 2-D Line Chart Working with Trendlines, PivotTable Reports, PivotChart Reports and Slicers 8
  • 9. Adding a Trendline to a Chart • Tap or click the chart to select it • Tap or click the Add Chart Elements button on the CHART TOOLS DESIGN tab to display the Add Chart Element menu • Tap or click the More Trendline Options to display the Format Trendline dialog box • If necessary, tap or click the Trendline Options button • Tap or click the desired trendline type • Tap or click the desired options in the Format Trendline dialog box • Tap or click the Close button to add the trendline with the selected options • Tap or click a desired theme on the PAGE LAYOUT tab Working with Trendlines, PivotTable Reports, PivotChart Reports, and Slicers 9
  • 10. Adding a Trendline to a Chart Working with Trendlines, PivotTable Reports, PivotChart Reports, and Slicers 10
  • 11. Changing the Format of a Data Point • Tap or click the desired data point twice to select the single point • Right-click or press and hold (touchscreen) the selected data point do display the shortcut menu • Tap or click Format Data Point on the shortcut menu to display the Format Data Point task pane • Tap or click the Fill & Line button, then tap or click MARKER • If necessary, tap or click MARKER OPTIONS to expand the section and select the desired options • Tap or click the Close button Working with Trendlines, PivotTable Reports, PivotChart Reports, and Slicers 11
  • 12. Changing the Format of a Data Point Working with Trendlines, PivotTable Reports, PivotChart Reports, and Slicers 12
  • 13. Creating a Blank PivotTable • Tap or click the desired cell containing the data for the PivotTable • Tap or click the PivotTable button on the INSERT tab to display the Create PivotTable dialog box • Click the OK button to create a blank PivotTable report on a new worksheet and display the PivotTable Fields task pane Working with Trendlines, PivotTable Reports, PivotChart Reports, and Slicers 13
  • 14. Creating a Blank PivotTable Working with Trendlines, PivotTable Reports, PivotChart Reports, and Slicers 14
  • 15. Adding Data to the PivotTable • Drag the desired field from the Choose fields to add to report area to the desired locations (rows or columns) • Drag the desired fields to the VALUES area Working with Trendlines, PivotTable Reports, PivotChart Reports, and Slicers 15
  • 16. Adding Data to the PivotTable Working with Trendlines, PivotTable Reports, PivotChart Reports, and Slicers 16
  • 17. Changing the Layout of a PivotTable • Tap or click the Report Layout button on the PIVOTTABLE TOOLS DESIGN tab to display the Report Layout menu • Click the desired layout Working with Trendlines, PivotTable Reports, PivotChart Reports, and Slicers 17
  • 18. Changing the View of a PivotTable Report • Change the order of the fields in the ROWS or COLUMNS area to change the view Working with Trendlines, PivotTable Reports, PivotChart Reports, and Slicers 18
  • 19. Filtering a PivotTable Report Using a Report Filter • Drag the desired field from the ‘Choose fields to add to report’ area to the Report Filter area in the PivotTable Fields task pane • Tap or click the field’s Filter button to display the Filter menu • Click to select the desired criterion • Click the OK button to update the display Working with Trendlines, PivotTable Reports, PivotChart Reports, and Slicers 19
  • 20. Filtering a PivotTable Report Using a Report Filter Working with Trendlines, PivotTable Reports, PivotChart Reports, and Slicers 20
  • 21. Filtering a PivotTable Report Using Multiple Selection Criteria • Drag the desired button from the ROWS or COLUMNS area to the FILTERS area • Drag the desired button from the FILTERS area to the ROWS or COLUMNS area • Tap or click the filter button to display the filter menu • Tap or click the desired check boxes to prepare to select multiple criteria • Tap or click the OK button Working with Trendlines, PivotTable Reports, PivotChart Reports, and Slicers 21
  • 22. Filtering a PivotTable Report Using Multiple Selection Criteria Working with Trendlines, PivotTable Reports, PivotChart Reports, and Slicers 22
  • 23. Removing a Report Filter from a PivotTable Report • Tap or click the filter button and tap or click the All check box to include all criteria in the PivotTable report • Tap or click the OK button • Drag the desired button out of the PivotTable Fields task pane to remove it from the report Working with Trendlines, PivotTable Reports, PivotChart Reports, and Slicers 23
  • 24. Removing a Report Filter from a PivotTable Report Working with Trendlines, PivotTable Reports, PivotChart Reports, and Slicers 24
  • 25. Filtering a PivotTable Report Using the Row Label Filter • Drag the desired button out of the ROWS area in the PivotTable Fields task pane to remove the field from the report • Tap or click the desired check box in the Choose fields to add to report list to add the desired field to the ROWS area • Tap or click the filter button to display the filter menu for the desired field • Tap or click the desired check boxes on the filter menu • Tap or click the OK button to update the display Working with Trendlines, PivotTable Reports, PivotChart Reports, and Slicers 25
  • 26. Filtering a PivotTable Report Using the Row Label Filter Working with Trendlines, PivotTable Reports, PivotChart Reports, and Slicers 26
  • 27. Removing a Row Label Filter from am PivotTable Report • Tap or click the Filter button to display the Filter menu • Tap or click the Clear Filter From command to remove the row label filter Working with Trendlines, PivotTable Reports, PivotChart Reports, and Slicers 27
  • 28. Formatting a PivotTable Report • Select a cell in the PivotTable • Tap or click the More button in the PivotTable Styles gallery in the PIVOTTABLE TOOLS DESIGN tab to expand the gallery • Click the desired style • Format the cells as desired using the Format Cells dialog box Working with Trendlines, PivotTable Reports, PivotChart Reports, and Slicers 28
  • 29. Formatting a PivotTable Report Working with Trendlines, PivotTable Reports, PivotChart Reports, and Slicers 29
  • 30. Switching Summary Functions in a PivotTable • Press and hold or right-click the desired cell to display the shortcut menu and prepare for changing the summary function • Point to Summarize Values By on the shortcut menu to display the Summarize Values By menu • Click the desired command Working with Trendlines, PivotTable Reports, PivotChart Reports, and Slicers 30
  • 31. Switching Summary Functions in a PivotTable Working with Trendlines, PivotTable Reports, PivotChart Reports, and Slicers 31
  • 32. Adding a Second Value Calculation to a PivotTable Report • Drag the desired field from the PivotTable Fields task pane to the VALUES area • Tap or click the desired calculation • Tap or click the Value Field Settings to display the Value Field Settings dialog box • Tap or click the desired settings and then tap or click the OK button Working with Trendlines, PivotTable Reports, PivotChart Reports, and Slicers 32
  • 33. Adding a Second Value Calculation to a PivotTable Report Working with Trendlines, PivotTable Reports, PivotChart Reports, and Slicers 33
  • 34. Customizing the Display of the Field List and Field Headers in the PivotTable Report • Tap or click the Field list button and the Field Headers button on the PIVOTTABLE TOOLS ANALYZE tab to show or hide the fields • Tap or click the PivotTable Options button on the PIVOTTABLE TOOLS ANALYZE tab to display the PivotTable Options dialog box • Tap or click the desired settings • Tap or click the OK button Working with Trendlines, PivotTable Reports, PivotChart Reports and Slicers 34
  • 35. Customizing the Display of the Field List and Field Headers in the PivotTable Report Working with Trendlines, PivotTable Reports, PivotChart Reports, and Slicers 35
  • 36. Customizing the Display of the Expand and Collapse Buttons in a PivotTable Report • Tap or click the Collapse button to collapse or expand the desired selection • Press and hold or right-click the desired cell to display the shortcut menu and then point to Expand/Collapse to display the Expand/Collapse submenu • Tap or click the desired settings Working with Trendlines, PivotTable Reports, PivotChart Reports, and Slicers 36
  • 37. Customizing the Display of the Expand and Collapse Buttons in a PivotTable Report Working with Trendlines, PivotTable Reports, PivotChart Reports, and Slicers 37
  • 38. Updating the Contents of a PivotTable Report • Modify the contents of the desired cell on the desired sheet tab • Tap or click the desired PivotTable sheet tab to make it active • Tap or click any cell in the PivotTable report to make it active • Tap or click the Refresh button on the PIVOTTABLE TOOLS ANALYZE tab to update the PivotTable report Working with Trendlines, PivotTable Reports, PivotChart Reports, and Slicers 38
  • 39. Updating the Contents of a PivotTable Report Working with Trendlines, PivotTable Reports, PivotChart Reports, and Slicers 39
  • 40. Creating a PivotChart Report from an Existing PivotTable Report • Select a cell in the PivotTable report • Click the Field List button on the PIVOTTABLE TOOLS ANALYZE tab to display the PivotTable Field List pane • Click the PivotChart button on the PIVOTTABLE TOOLS ANALYZE tab to display the Insert Chart dialog box • Click the desired chart type • Click the OK button to add the chart to the worksheet Working with Trendlines, PivotTable Reports, PivotChart Reports, and Slicers 40
  • 41. Creating a PivotChart Report from an Existing PivotTable Report Working with Trendlines, PivotTable Reports, PivotChart Reports, and Slicers 41
  • 42. Changing the Location of a PivotChart Report and Deleting Data • With the chart selected, click the Move Chart button on the PIVOTTABLE TOOLS DESIGN tab PivotChart Tools to display the Move Chart dialog box • Tap or click the New sheet option button to select it • Type the desired name in the New sheet text box • Tap or click the OK button to move the chart to the new sheet • In the PivotTable Field List pane, drag the desired items out of the Values area Working with Trendlines, PivotTable Reports, PivotChart Reports, and Slicers 42
  • 43. Changing the Location of a PivotChart Report and Deleting Data Working with Trendlines, PivotTable Reports, PivotChart Reports, and Slicers 43
  • 44. Changing the PivotChart Type and Formatting the Chart • Tap or click the chart to select the data series • Press and hold or right-click to display the shortcut menu • Tap or click Format Data Series on the shortcut menu to open the Format Data Series task pane • Tap or click the desired chart type • Tap or click the Close button • Tap or click the Chart Elements arrow on the PIVOTCHART • TOOLS FORMAT tab to display the Chart Elements menu • Tap or click the desired formatting changes Working with Trendlines, PivotTable Reports, PivotChart Reports, and Slicers 44
  • 45. Changing the PivotChart Type and Formatting the Chart Working with Trendlines, PivotTable Reports, PivotChart Reports, and Slicers 45
  • 46. Changing the View of a PivotChart • If necessary, click the Field List button on the PIVOTCHART TOOLS ANALYZE tab to display the PivotTable Field List pane • Select and deselect the fields as desired • Add, delete, and reorder the desired fields in the AXIS area • Tap or click the PivotChart Report sheet tab to make it the active tab Working with Trendlines, PivotTable Reports, PivotChart Reports and Slicers 46
  • 47. Changing the View of a PivotChart Working with Trendlines, PivotTable Reports, PivotChart Reports, and Slicers 47
  • 48. Creating a PivotChart Report Directly from Data • Select a cell containing the data • Tap or click the PivotChart arrow on the INSERT tab to display the PivotChart menu • Tap or click the PivotChart & PivotTable on the PivotChart menu to display the Create PivotTable with PivotChart dialog box • If necessary, tap or click the New Worksheet option button • Tap or click the OK button to add a new worksheet containing a blank PivotTable and blank PivotChart • Add the desired fields to the Axis Fields and Values areas Working with Trendlines, PivotTable Reports, PivotChart Reports, and Slicers 48
  • 49. Creating a PivotChart Report Directly from Data Working with Trendlines, PivotTable Reports, PivotChart Reports, and Slicers 49
  • 50. Adding a Calculated Field to a PivotTable Report • If necessary, tap or click the PivotTable to make it active • Tap or click the Fields, Items, & Sets button on the PIVOTTABLE TOOLS ANALYZE tab to display the Fields, Items, & Sets menu • Tap or click the Calculated Field command on the Fields, Items, & Sets menu to display the Insert Calculated Field dialog box • Enter the name, and formula, and then click the Add button to add the calculated field to the Fields list • Click the OK button to close the dialog box Working with Trendlines, PivotTable Reports, PivotChart Reports, and Slicers 50
  • 51. Adding a Calculated Field to a PivotTable Report Working with Trendlines, PivotTable Reports, PivotChart Reports, and Slicers 51
  • 52. Formatting the PivotTable and PivotChart • Tap or click the Field List button on the PIVOTTABLE TOOLS ANALYZE tab to display the PivotTable Fields task pane • Tap or click DESIGN on the ribbon to display the PIVOTTABLE TOOLS DESIGN tab and make the desired formatting changes • Use the Field List button, the +/- Buttons button, and the Field Headers button on the PIVOTTABLE TOOLS ANALYZE to hide the field list, the Expand/Collapse buttons, and the field headers Working with Trendlines, PivotTable Reports, PivotChart Reports, and Slicers 52
  • 53. Formatting the PivotTable and PivotChart Working with Trendlines, PivotTable Reports, PivotChart Reports, and Slicers 53
  • 54. Formatting the PivotChart • Tap or click in the PivotChart report to select it • Apply the desired styles from the Chart Styles gallery • Use the ‘Chart Quick Colors’ button on the PIVOTCHART TOOLS DESIGN tab to change the colors • Use the ‘Add Chart Element’ button on the PIVOTCHART TOOLS DESIGN tab to position the legend • Tap or click the Field Buttons button on the PIVOTCHART TOOLS ANALYZE tab to show or hide the field button Working with Trendlines, PivotTable Reports, PivotChart Reports, and Slicers 54
  • 55. Formatting the PivotChart Working with Trendlines, PivotTable Reports, PivotChart Reports, and Slicers 55
  • 56. Copying a PivotTable and PivotChart • Create a copy of the worksheet Working with Trendlines, PivotTable Reports, PivotChart Reports, and Slicers 56
  • 57. Formatting the PivotChart • Use the ‘Chart Quick Colors’ button on the PIVOTCHART DESIGN tab to apply the desired color Working with Trendlines, PivotTable Reports, PivotChart Reports, and Slicers 57
  • 58. Formatting the PivotChart • If necessary, tap or click to make the PivotChart active • Tap or click the Insert Slicer button arrow on the PIVOTCHART TOOLS ANALYZE tab to display the Insert Slicers dialog box • Click the check boxes to select the desired slicers to insert • Click the OK button to display the selected slicers on the worksheet Working with Trendlines, PivotTable Reports, PivotChart Reports, and Slicers 58
  • 59. Formatting the PivotChart Working with Trendlines, PivotTable Reports, PivotChart Reports, and Slicers 59
  • 60. Formatting Slicers • Tap or click and then drag the desired slicer to the desired location • Hold down the ctrl key and then tap or click to select multiple slicers • Tap or click the Height box on the SLICER TOOLS OPTIONS tab to set the button height • Tap or click the desired Slicer style on the SLICER TOOLS OPTIONS tab to apply it to the slicers • Tap or click any cell to deselect the slicer Working with Trendlines, PivotTable Reports, PivotChart Reports, and Slicers 60
  • 61. Formatting Slicers Working with Trendlines, PivotTable Reports, PivotChart Reports, and Slicers 61
  • 62. Using the Slicers to Review Groups in the PivotTable • Hold down the CTRL key and then tap or click the desired slicer to remove the data from the PivotTable and PivotChart calculations. • Release the CTRL key and then tap or click the desired slicer to display that slicer’s data only • Tap or click different slicers slicer to see the data for those slicers only Working with Trendlines, PivotTable Reports, PivotChart Reports, and Slicers 62
  • 63. Using the Slicers to Review Groups in the PivotTable Working with Trendlines, PivotTable Reports, PivotChart Reports, and Slicers 63
  • 64. Using the Slicers to Review Groups Not in the PivotTable • Tap or click the Clear Filter button on the desired slicers to remove the filters and return the PivotTable and PivotCharts to their unfiltered states • Tap or click Custom in the desired slicer to see the aggregate data options • Tap or click different styles and combinations of styles to see how the aggregate data changes Working with Trendlines, PivotTable Reports, PivotChart Reports, and Slicers 64
  • 65. Using the Slicers to Review Groups Not in the PivotTable Working with Trendlines, PivotTable Reports, PivotChart Reports, and Slicers 65
  • 66. Chapter Summary • Analyze worksheet data using a trendline • Create a PivotTable report • Format a PivotTable report • Apply filters to a PivotTable report • Create a PivotChart report • Format a PivotChart report • Apply filters to a PivotChart report Working with Trendlines, PivotTable Reports, PivotChart Reports, and Slicers 66
  • 67. Chapter Summary • Analyze worksheet data using PivotTable and PivotChart reports • Create calculated fields • Create slicers to filter PivotTable and PivotChart reports • Format slicers • Analyze PivotTable and PivotChart reports using slicers Working with Trendlines, PivotTable Reports, PivotChart Reports, and Slicers 67
  • 68. Microsoft Excel 2013 Chapter 8 Complete