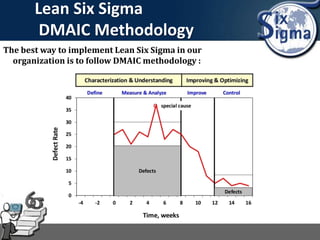
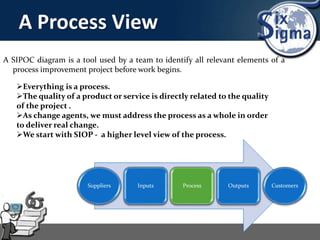
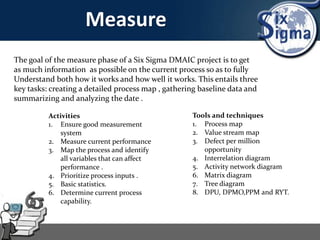
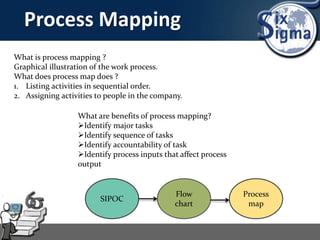
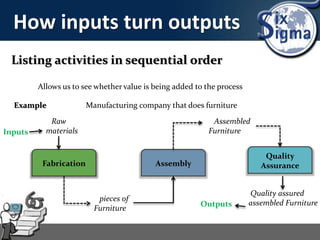
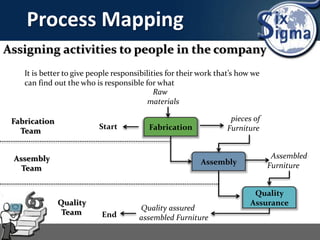
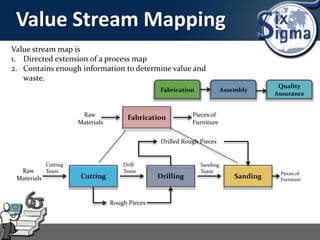
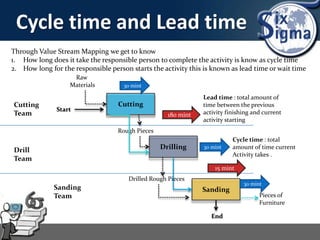
This document provides an overview of key concepts and tools used in the Measure phase of the Six Sigma DMAIC methodology. The goal of the Measure phase is to gather detailed data on the current process in order to understand how it works and its performance. Key activities include creating a detailed process map, gathering baseline data, and analyzing the data. Tools covered include process mapping, value stream mapping, and metrics for quantifying defects such as defects per unit, defects per opportunity, and defects per million opportunities. Process mapping helps identify all activities, inputs, outputs, and responsibilities while value stream mapping shows the flow of materials and information. Baseline data provides a starting point for improvement efforts.
DMAIC, which stands for Define, Measure, Analyze, Improve and Control, has provided a structure for process improvement for almost four decades. It’s an easy-to-follow five-step method that works in any industry and on any process. Tune in to this 1-hour Introductory webinar to get a primer on this how this handy model can help you in your quest to improve the world around you.
https://goleansixsigma.com/webinar-introduction-dmaic/
This Slideshare presentation is a partial preview of the full business document. To view and download the full document, please go here:
http://flevy.com/browse/business-document/kaizen-event-guide-311
A Kaizen Event is a rapid, focused application of Lean methods to reduce waste so as to improve cost, quality, delivery, speed, flexibility and responsiveness to internal/external customer needs.
This presentation guide provides a step-by-step guidance to the planning, preparation and conducting a Kaizen Event. It includes post-event follow up activites as well as templates for Kaizen charter and presentation to management and other stakeholders.
This event guide can be used together with the Kaizen training presentation.
Number of slides: 98
CONTENTS:
Introduction
- What is Kaizen?
- 10 rules of Kaizen
- What is the purpose of Kaizen?
- Value
- Types of waste
- What is a Kaizen event?
- Benefts of Kaizen and Kaizen events
[Note: This is a partial preview. To download this presentation, visit:
https://www.oeconsulting.com.sg/training-presentations]
This highly comprehensive presentation with over 470+ slides covers 30 common frameworks, models, methodologies and tools for business process improvement that are being used in manufacturing and service industries and the public sector.
A detailed summary presented in the simple what-why-how format with key concepts and principles are provided for each business process improvement framework.
The frameworks in this deck span across Strategy Deployment, Organization & Governance, Marketing & Sales, Quality Management, Change Management, and Operations.
INCLUDED FRAMEWORKS & METHODOLOGIES:
1. Business Model Canvas
2. Design Thinking
3. Customer Journey Mapping
4. Balanced Scorecard
5. Hoshin Kanri
6. Xerox Benchmarking Model
7. Kano Model
8. Cost of Quality Model
9. Total Quality Management Model
10. Baldrige Excellence Framework
11. EFQM Excellence Model
12. Shingo Model for Operational Excellence
13. ISO 9001:2015 Quality Management System
14. Business Process Reengineering
15. Six Sigma
16. 8D Problem Solving Process
17. 5S Principles
18. Visual Management
19. Kaizen
20. Eight Wastes of Lean
21. Lean Manufacturing System (TPS)
22. Value Stream Mapping
23. PDCA Problem Solving Process
24. Root Cause Analysis (RCA)
25. Standard Work
26. Total Productive Maintenance
27. Gemba Walk
28. Training Within Industry (TWI)
29. ADKAR® Model for Individual Change
30. Kotter’s Change Management Model
The level of detail varies by framework, depending on the nature of the business process improvement model. Examples and templates are provided.
Alternatively, these slides can be used to complement your in-house training materials.
Basic understanding of lean six sigma approach for improvementViral Jain
Before we start working on a project for process improvement.
It is very important to create awareness.
I made this presentation to provide basic understanding of Lean and six sigma.
Usually audience used to be SME, process owner and Higher management people.
After this training ,audience gets a roadmap/ strategy for improvement and how I will help them to improve.
I take their inputs after training and than we start with VOC, VOB and identification of problems and this is how I prefer to start.
This is an introduction for six sigma green belt program , it briefly describes the its history, adoption , and various component and tools . This presentation also include the current ASQ examination pattern .
During this 1-hour webinar recording, you will receive a basic introduction to what Lean Six Sigma is, why organizations implement it and how to get started.
You can find the rest of the webinar materials and questions from the webinar here: https://goleansixsigma.com/webinar-introduction-lean-six-sigma/
Lean Six Sigma is a process improvement methodology that relies on a collaborative team effort to improve performance by systematically removing waste, combining Lean and Six Sigma to eliminate the eight kinds of waste
Lean Six Sigma projects comprise aspects of Lean's waste elimination and the Six Sigma focus on reducing defects
This slide deck will help you appreciate the application of statistics (and now data science) in the field of Quality Management and Process Improvement. And why is there a need to produce a consistent "in spec" product at 99.9997% of the time.
In the early and mid-1980s, Motorola engineers decided that the traditional quality levels — measuring defects in thousands of opportunities – didn’t provide enough granularity. Instead, they wanted to measure the defects per million opportunities. Motorola developed this new standard and made a cultural change associated with it. Six Sigma helped Motorola realize powerful bottom-line results in their organization – in fact, they documented more than $16 Billion in savings as a result of our Six Sigma efforts.
Six Sigma has evolved over time. It’s more than just a quality system like TQM or ISO. It’s a way of doing business.
Six Sigma at many organizations simply means a measure of quality that strives for near perfection. Six Sigma is a disciplined, data-driven approach and methodology for eliminating defects (driving toward six standard deviations between the mean and the nearest specification limit) in any process – from manufacturing to transactional and from product to service. A Six Sigma defect is defined as anything outside of customer specifications.
A Six Sigma opportunity is then the total quantity of chances for a defect.
Six Sigma (Quality Management System)
Six Sigma seeks to improve the quality of process outputs by identifying and removing the causes of defects.
Six sigma process is one in which 99.9999966% of the products manufactured are statistically expected to be free of defects.
Six sigma is a very clever way of branding and packaging many aspects of TOTAL QUALITY MANAGEMENT.
B.pharm 7th sem Six Sigma ppt.
Six Sigma concept, objectives, methodologies, differences, implementation, roles, application, hurdles, advantages and disadvantages. of the Six Sigma concept.
It has a great impact on industries to achieve profit. Improve business processes and reduce defects.
Did you know? Over the years, enterprises have achieved 65% of higher project savings by adhering to Six Sigma methodology.
Leadership is a critical element in the success of both implementing and using Six Sigma Techniques and Tool to support process change and delivering value in conducting Six Sigma Projects. Having the role of Leadership defined and the necessary knowledge of the methods that will set the expectation of change within processes can inspire teams to stay focused and deliver timely results.
Areas covered in the webinar
- The WHO in Leadership supporting Six Sigma
- The WHY as it relates to the Business Goals and Objectives
- The EXPECTATION or VISION for change to deliver value
- The INVOLVEMENT and participation of leadership
- The SUPPORT and resources needed
- The AUTHORITY to make change happen
- The RECOGNITION of all who contributed to delivering the value
- The MOMENTUM to build on success and continuous improvement
For more details click here - https://www.invensislearning.com/webinar/leading-the-way-in-six-sigma
#sixsigma #leansixsigma #sixsigmablackbelt #sixsigmayellowbelt #sixsigmagreenbelt #sixsigmamethodlogy #sixsigmaprocess #sixsigmacourse #sixsigmavideo #sixsigmamanagement #leansixsigmamethod #SixSigmaTraining
About Invensis Learning
Invensis Learning is a leading training and professional development solutions provider. We deliver globally-recognized training and certifications to individuals and enterprises to aid key business transformations and help to stay relevant by closing skill gaps and cultivate an environment that fosters continuous learning. We have trained 10000+ professionals over wide portfolio of training and certification courses. We are a trusted partner of many Fortune 500 companies for training and development
For more details please visit: https://www.invensislearning.com/
State of ICS and IoT Cyber Threat Landscape Report 2024 previewPrayukth K V
The IoT and OT threat landscape report has been prepared by the Threat Research Team at Sectrio using data from Sectrio, cyber threat intelligence farming facilities spread across over 85 cities around the world. In addition, Sectrio also runs AI-based advanced threat and payload engagement facilities that serve as sinks to attract and engage sophisticated threat actors, and newer malware including new variants and latent threats that are at an earlier stage of development.
The latest edition of the OT/ICS and IoT security Threat Landscape Report 2024 also covers:
State of global ICS asset and network exposure
Sectoral targets and attacks as well as the cost of ransom
Global APT activity, AI usage, actor and tactic profiles, and implications
Rise in volumes of AI-powered cyberattacks
Major cyber events in 2024
Malware and malicious payload trends
Cyberattack types and targets
Vulnerability exploit attempts on CVEs
Attacks on counties – USA
Expansion of bot farms – how, where, and why
In-depth analysis of the cyber threat landscape across North America, South America, Europe, APAC, and the Middle East
Why are attacks on smart factories rising?
Cyber risk predictions
Axis of attacks – Europe
Systemic attacks in the Middle East
Download the full report from here:
https://sectrio.com/resources/ot-threat-landscape-reports/sectrio-releases-ot-ics-and-iot-security-threat-landscape-report-2024/
The Art of the Pitch: WordPress Relationships and SalesLaura Byrne
Clients don’t know what they don’t know. What web solutions are right for them? How does WordPress come into the picture? How do you make sure you understand scope and timeline? What do you do if sometime changes?
All these questions and more will be explored as we talk about matching clients’ needs with what your agency offers without pulling teeth or pulling your hair out. Practical tips, and strategies for successful relationship building that leads to closing the deal.
Transcript: Selling digital books in 2024: Insights from industry leaders - T...BookNet Canada
The publishing industry has been selling digital audiobooks and ebooks for over a decade and has found its groove. What’s changed? What has stayed the same? Where do we go from here? Join a group of leading sales peers from across the industry for a conversation about the lessons learned since the popularization of digital books, best practices, digital book supply chain management, and more.
Link to video recording: https://bnctechforum.ca/sessions/selling-digital-books-in-2024-insights-from-industry-leaders/
Presented by BookNet Canada on May 28, 2024, with support from the Department of Canadian Heritage.
Software Delivery At the Speed of AI: Inflectra Invests In AI-Powered QualityInflectra
In this insightful webinar, Inflectra explores how artificial intelligence (AI) is transforming software development and testing. Discover how AI-powered tools are revolutionizing every stage of the software development lifecycle (SDLC), from design and prototyping to testing, deployment, and monitoring.
Learn about:
• The Future of Testing: How AI is shifting testing towards verification, analysis, and higher-level skills, while reducing repetitive tasks.
• Test Automation: How AI-powered test case generation, optimization, and self-healing tests are making testing more efficient and effective.
• Visual Testing: Explore the emerging capabilities of AI in visual testing and how it's set to revolutionize UI verification.
• Inflectra's AI Solutions: See demonstrations of Inflectra's cutting-edge AI tools like the ChatGPT plugin and Azure Open AI platform, designed to streamline your testing process.
Whether you're a developer, tester, or QA professional, this webinar will give you valuable insights into how AI is shaping the future of software delivery.
Epistemic Interaction - tuning interfaces to provide information for AI supportAlan Dix
Paper presented at SYNERGY workshop at AVI 2024, Genoa, Italy. 3rd June 2024
https://alandix.com/academic/papers/synergy2024-epistemic/
As machine learning integrates deeper into human-computer interactions, the concept of epistemic interaction emerges, aiming to refine these interactions to enhance system adaptability. This approach encourages minor, intentional adjustments in user behaviour to enrich the data available for system learning. This paper introduces epistemic interaction within the context of human-system communication, illustrating how deliberate interaction design can improve system understanding and adaptation. Through concrete examples, we demonstrate the potential of epistemic interaction to significantly advance human-computer interaction by leveraging intuitive human communication strategies to inform system design and functionality, offering a novel pathway for enriching user-system engagements.
PHP Frameworks: I want to break free (IPC Berlin 2024)Ralf Eggert
In this presentation, we examine the challenges and limitations of relying too heavily on PHP frameworks in web development. We discuss the history of PHP and its frameworks to understand how this dependence has evolved. The focus will be on providing concrete tips and strategies to reduce reliance on these frameworks, based on real-world examples and practical considerations. The goal is to equip developers with the skills and knowledge to create more flexible and future-proof web applications. We'll explore the importance of maintaining autonomy in a rapidly changing tech landscape and how to make informed decisions in PHP development.
This talk is aimed at encouraging a more independent approach to using PHP frameworks, moving towards a more flexible and future-proof approach to PHP development.
"Impact of front-end architecture on development cost", Viktor TurskyiFwdays
I have heard many times that architecture is not important for the front-end. Also, many times I have seen how developers implement features on the front-end just following the standard rules for a framework and think that this is enough to successfully launch the project, and then the project fails. How to prevent this and what approach to choose? I have launched dozens of complex projects and during the talk we will analyze which approaches have worked for me and which have not.
Smart TV Buyer Insights Survey 2024 by 91mobiles.pdf91mobiles
91mobiles recently conducted a Smart TV Buyer Insights Survey in which we asked over 3,000 respondents about the TV they own, aspects they look at on a new TV, and their TV buying preferences.
LF Energy Webinar: Electrical Grid Modelling and Simulation Through PowSyBl -...DanBrown980551
Do you want to learn how to model and simulate an electrical network from scratch in under an hour?
Then welcome to this PowSyBl workshop, hosted by Rte, the French Transmission System Operator (TSO)!
During the webinar, you will discover the PowSyBl ecosystem as well as handle and study an electrical network through an interactive Python notebook.
PowSyBl is an open source project hosted by LF Energy, which offers a comprehensive set of features for electrical grid modelling and simulation. Among other advanced features, PowSyBl provides:
- A fully editable and extendable library for grid component modelling;
- Visualization tools to display your network;
- Grid simulation tools, such as power flows, security analyses (with or without remedial actions) and sensitivity analyses;
The framework is mostly written in Java, with a Python binding so that Python developers can access PowSyBl functionalities as well.
What you will learn during the webinar:
- For beginners: discover PowSyBl's functionalities through a quick general presentation and the notebook, without needing any expert coding skills;
- For advanced developers: master the skills to efficiently apply PowSyBl functionalities to your real-world scenarios.
UiPath Test Automation using UiPath Test Suite series, part 4DianaGray10
Welcome to UiPath Test Automation using UiPath Test Suite series part 4. In this session, we will cover Test Manager overview along with SAP heatmap.
The UiPath Test Manager overview with SAP heatmap webinar offers a concise yet comprehensive exploration of the role of a Test Manager within SAP environments, coupled with the utilization of heatmaps for effective testing strategies.
Participants will gain insights into the responsibilities, challenges, and best practices associated with test management in SAP projects. Additionally, the webinar delves into the significance of heatmaps as a visual aid for identifying testing priorities, areas of risk, and resource allocation within SAP landscapes. Through this session, attendees can expect to enhance their understanding of test management principles while learning practical approaches to optimize testing processes in SAP environments using heatmap visualization techniques
What will you get from this session?
1. Insights into SAP testing best practices
2. Heatmap utilization for testing
3. Optimization of testing processes
4. Demo
Topics covered:
Execution from the test manager
Orchestrator execution result
Defect reporting
SAP heatmap example with demo
Speaker:
Deepak Rai, Automation Practice Lead, Boundaryless Group and UiPath MVP
2. It is a quality
philosophy and
a management
technique.
It is a
methodology for
continuous
improvement
It is a methodology for
creating products
processes that perform
at high standards.
It is a set of
statistical and other
quality tools
arranged in unique
way.
It is a way of
knowing where you
are and where you
could be
4. Six Sigma at GE
Jack Welch (former CEO of General
Electric) launched six sigma at GE, in Jan,
1996.
1998-1999 green belt exam certification
became the criteria for management
promotions.
2002-2003 green belt certification become
the criteria for promotion to management
roles.
--- Saved $750 million by the end of 1998
--- Cut invoice defects and disputed by 98 percent, speeding
payment, and creating better productivity.
5. Definition – Six Sigma
Six Sigma is a disciplined , data-driven methodology
focused on eliminating defects. Defects mean anything
that falls outside of a customer’s Specification . It refers to
3.4 defects per million opportunities.
6. 1.Ensuring all
outputs meet
customer
specification .
2.Understanding
customer needs.
1. Identifying
input, process
and output areas
for improvement.
1. A methodology for defect
definition ,
measurement , analysis,
improvement and
control must be utilized
to standardize
improvement processes
and maximize business
productivity.
7. Getting 6 Sigma through
eliminating defects
6 sigma process output
= 3.4 Defects per million
opportunities
Process output
(Variation)
Sigma DPMO Yield
1 691,462 30.8538%
2 308,538 69.1462%
3 66,807 93.3193%
4 6,210 99.3790%
5 233 99.976%
6 3.4 99.9997%
DPMO = Defects per million opportunity
Opportunities Variation / Defects
8. Common Cause of Variation
Reasons behind
the variations in
a process
10. Overview of Six Sigma
It is a philosophy
1. Anything less than ideal is an
opportunity for improvement
2. Defects costs money
3.Understanding processes and
improving them is the most
efficient way to achieve lasting
result.
It is a Process
1. To achieve this level of
performance you need to :
Define, Measure, Analyze,
Improve and Control
It is Statistics
1. 6 Sigma processes will
produce less than 3.4
defects per million
opportunities.
12. Which business function needs it
As long as there is a
process that produces
an output, whether it
is a manufactured
product, data, an
invoice, etc…, we can
apply the six sigma
breakthrough
strategy.
13. What is Lean?
Lean is a structured approach focusing on
simplifying processes by eliminating the tasks
that do not bring value for the end customer.
This approach was mostly derived form the Toyota
Production System in the beginning of the 20th century and
identified as “Lean” only in the 1990s.
14. Principles of Lean
Specify value
by offering
Integrate the
value stream
Make the
offering flow
At the pull of
the customer
In pursuit of
perfection
Understanding and specify what adds value for the
perspective of the customer.
Identify steps in the whole value stream to
highlight waste.
Create a continuous flow of activities along
The value stream
Only carried out activities in response
t0 pull from the customer
Strive for perfection by continually
Creating value and removing
Successive layers of waste
15. Unnecessary movements
Of products and materials
Defects
Making more than is
Immediately required
Over Production
WaitingTransport Inventory Motion
Over processing Skills
Unnecessary movements
By People
Waiting for the previous
Step in the process to
complete
Storing parts, pieces,
Documentation ahead
Of requirements
Performing any activities
That is not necessary
Making mistakes that
Cause products to fail
Customer requirements
Not utilizing human
Talent within the
Workforce
Lean Manufacturing Eliminating the waste
16. Lean Six Sigma definition
Lean
• A structure approach
focusing on simplifying
processes
Six sigma
• A structured
approach focusing on
improving process
reliability in order to
eliminate the defects
in products and
services
Lean six sigma
• A performance
improvement
methodology
focusing on
simplifying
processes and
improving process
reliability.
=+
21. Continue….
1. Define : high-level project goals and the current process.
2. Measure : Key aspects of the current process ad collect relevant data.
3. Analysis : the data to verify cause and effect relationships. Determine
what the relationships are, and attempt to ensure that all factors have
considered.
4. Improve : optimize the process based upon data analysis using
various tools.
5. Control : to ensure that any deviations from target are corrected
before they result in defects.
23. CONTINUE…
Define design goals that are consistent with customer demands and the
Enterprise strategy.
Measure and identify CTQs(characteristics that critical to quality),
Product capabilities, production process capability and risks.
Analysis to develop and design alternatives, create a high-level design and
evaluate design capability to select the best design.
Design details, optimize the design, and plan for design verification . This
phase may require simulations.
Verify the design, set up pilot runs, implement the production process and
hand it over to the process owners.
24. Lean Six Sigma
DMAIC Methodology
The best way to implement Lean Six Sigma in our
organization is to follow DMAIC methodology :
26. Define
Without define, we spin our wheels and waste time
and money.
Activities Tools and techniques
1. Identify the vital few
2. Bound the problem
3. Understand customer requirements
4. Prioritize customer requirements
5. Identify project stakeholders
6. Complete project charter.
1. Pareto analysis
2. A process view (SIPOC)
3. KANO model
4. Voice of the customer
5. Affinity diagram
6. Critical to quality path
7. Stakeholders analysis
8. Complete project
charter
27. Pareto Analysis
•Villferdo Pareto was an Italian engineer,
sociologist, economist and philosopher.
•Observed that 80% of the land in ITALY was owned
by 20% of the population.
1858-1923
Focus on the vital few
The vital few
The Trivial Many
29. A Process View
A SIPOC diagram is a tool used by a team to identify all relevant elements of a
process improvement project before work begins.
Everything is a process.
The quality of a product or service is directly related to the quality
of the project .
As change agents, we must address the process as a whole in order
to deliver real change.
We start with SIOP - a higher level view of the process.
Suppliers Inputs Process Outputs Customers
31. Understanding
Customers Need
KANO model for analyzing customer
needs and product requirements
because
1. We need to satisfy the customer and
2. Not all needs are equal
Developed by Noriaki Kano and
team in 1984 to :
-Categorize and prioritize customer
needs
-Guide product development
- enhance customer satisfaction
32. KANO Model
Delighted
Done
Very
Well
Disgusted
Done
poorly
Basic needs
“Must be”
Performance needs
Stated, more is better
Attractive needs
(delighters)
Unspoken , not
expected
Include these in your
product
requirements.
No choice
Choose the right set
at the right level to
ensure an attractive
competitive product.
Pick 1-2 for customer
delight and
competitive
differentiation
33. Voice Of Customer
The voice of the customer is a Six Sigma strategy used to capture
requirements and feedback from the customer and to meet their
requirements.
There are two approaches we gather Voice of Customer
Reactive Approach
• Looks at historical data to
determine issues, unmet
needs, problems and interests
of former customers.
oCustomer complaints
oCustomer service calls
oProduct return information
oWarranty claims
oWeb page activity
Proactive Approach
•Verify conclusions of reactive
research.
•Determine interests and
unmet needs of future
customers
oSurveys
oInterviews
oMarket research
oBenchmarking
oObserve customer
35. Affinity Diagram
An affinity diagram is an analytical tool used to
organize many ideas into subgroups with common
themes or common relationships. This method was
developed by a noted Japanese anthropologist in the
1950s called Jiro Kawakita.
Step 1
First, write down the
problem. Then quietly
put ideas, data, etc. on
cards. This is not like a
typical brainstorming
session where people are
very vocal about their
ideas.
36. Affinity Diagram
Step 2
Quietly put into
homogeneous groupings
Step 3
Develop affinity heading
cards. For example, there
is a homogeneous
grouping for human
resources related items.
Step 4
Put the groupings into
the order of the process.
For example , employees
get hired, they first start
off with human
resources
37. Critical to quality
A Critical to quality is a specific measurable characteristic of a
product or service that fulfils the expressed requirement of the
customer. CTQ performance must exceed specifications to satisfy the
customer.
Taste
Rich 1.1<TDS>1.3
Not acidic Extractions> 18%
Not bitter Extractions<22%
Customer wants
"Good Coffee
Temperature
Optimum Drinking
Temperature
>140 *F
<176*F
Cost
Price tk.120
We need to Translate VOC to CTQs
Hard to Measure
Need
Drivers Easy to
Measure
Specific
ation
CTQ
38. Why Stakeholder Analysis?
Stakeholders : anyone impacted by our project.
Stakeholders can be inside and outside the
organization .
•Provide resources
•Give advice
•‘Lobby’ for your cause
•Break down barriers
•Accelerate and improve results.
•Withhold resources.
•Withhold expertise
•Create barriers
•Delay and sabotage
•Convince others to withhold
support
For
Against
40. Project Charter
In the Define phases of DMAIC we need to have all the team
members are agreed to the project and the approval and sponsor
from the top management.
We do put all the
details of the project
and planning for the
project in the
project charter
which shows the
overall activities at a
glance.
Project Charter is a good executive communication tool
41. Measure
The goal of the measure phase of a Six Sigma DMAIC project is to get
as much information as possible on the current process so as to fully
Understand both how it works and how well it works. This entails three
key tasks: creating a detailed process map , gathering baseline data and
summarizing and analyzing the date .
Activities
1. Ensure good measurement
system
2. Measure current performance
3. Map the process and identify
all variables that can affect
performance .
4. Prioritize process inputs .
5. Basic statistics.
6. Determine current process
capability.
Tools and techniques
1. Process map
2. Value stream map
3. Defect per million
opportunity
4. Interrelation diagram
5. Activity network diagram
6. Matrix diagram
7. Tree diagram
8. DPU, DPMO,PPM and RYT.
42. Process Mapping
What is process mapping ?
Graphical illustration of the work process.
What does process map does ?
1. Listing activities in sequential order.
2. Assigning activities to people in the company.
What are benefits of process mapping?
Identify major tasks
Identify sequence of tasks
Identify accountability of task
Identify process inputs that affect process
output
SIPOC
Flow
chart
Process
map
43. How inputs turn outputs
Listing activities in sequential order
Allows us to see whether value is being added to the process
Example Manufacturing company that does furniture
Fabrication Assembly
Quality
Assurance
Raw
materials
pieces of
Furniture
Assembled
Furniture
Quality assured
assembled Furniture
Inputs
Outputs
44. Process Mapping
Assigning activities to people in the company
It is better to give people responsibilities for their work that’s how we
can find out the who is responsible for what
Fabrication
Assembly
Quality
Assurance
Raw
materials
pieces of
Furniture
Assembled
Furniture
Quality assured
assembled Furniture
Start
End
Fabrication
Team
Assembly
Team
Quality
Team
45. Value Stream Mapping
Value stream map is
1. Directed extension of a process map
2. Contains enough information to determine value and
waste.
Fabrication Assembly
Quality
Assurance
Fabrication
Cutting Drilling Sanding
Raw
Materials
Pieces of
Furniture
Raw
Materials
Cutting
Team
Drill
Team
Sanding
Team
Rough Pieces
Drilled Rough Pieces
Pieces of
Furniture
46. Cycle time and Lead time
Through Value Stream Mapping we get to know
1. How long does it take the responsible person to complete the activity is know as cycle time
2. How long for the responsible person starts the activity this is known as lead time or wait time
Lead time : total amount of
time between the previous
activity finishing and current
activity starting
Cycle time : total
amount of time current
Activity takes .
Cutting
Drilling
Sanding
Raw
Materials
Rough Pieces
Drilled Rough Pieces
Pieces of
Furniture
Start
End
Cutting
Team
Drill
Team
Sanding
Team
30 mint
30 mint
30 mint
180 mint
15 mint
47. Scaling Defects
Defects per Units (DPU), Defects per Opportunity(DPO) and
Defects per million Opportunity(DPMO) are metrics that express
how our products or process is performing , based on the number
of defects. Choosing the appropriate quality metric helps us
address performance against customer expectations..
Defects per Units(DPU) : Defects per unit(DPU) is the number of
defects in a sample divided by the number of units samples.
Defects per Opportunity (DPO) : Defects per opportunity is the
number of defects in a sample divided by the total number of
defect opportunity.
Defects per million Opportunity (DPMO) : Defects per million
opportunities is the number of defects in a sample divided by the
total number of defect opportunities multiplied by 1 million.
48. Defects Per Unit
How to calculate defects per Units
For example:
We are producing mango juice for customers. Lets say , each order is considered a unit.
Fifty orders are randomly selected and inspected and the following defects are found.
1. Two orders are incomplete.
2. One order is both damaged ad incorrect.
3. Three orders have wrong way labeled.
So , we get like , six of the orders have problems and there are a total of 7 defects our of
the 50 order sample.
Therefore ,
DPU= Number of Defects in a sample 7
Number of Units 50
= 0.14
Each unit of production on average contains this number of
defects.
49. Defects per Opportunity
How to calculate Defects per Opportunity
For example
For each number of mango juice there could have four defects – Damage,
incorrect, incomplete and wrong way labeled. Therefore , each order has
four opportunity . Fifty orders are randomly selected and inspected ad the
following are found .
1. Two orders are incomplete.
2. One order is both damaged ad incorrect.
3. Three orders have wrong way labeled.
Six of the orders have problems, and therefore there are a total of 7 defects out of
the 200 opportunities(50*4). Therefore
DPO = Total number of Defects 7
Total number of opportunities 200
= 0.035
50. Defects Per Million Opportunities
How to calculate Defects per Million Opportunity
For example
For each number of mango juice there could have four defects – Damage,
incorrect, incomplete and wrong way labeled. Therefore , each order has
four opportunity . Fifty orders are randomly selected and inspected ad the
following are found .
1. Two orders are incomplete.
2. One order is both damaged ad incorrect.
3. Three orders have wrong way labeled.
Six of the orders have problems, and therefore there are a total of 7 defects out of
the 200 opportunities(50*4). Therefore
DPMO= Total number of Defects 7
Total number of opportunities 200
= 35,000* 1 Million
For every 1 million production we will have 35,000 defects
51. Rolled Throughput Yield
Rolled throughput yield is the probability that a single unit can pass through
a series of process steps free of defects.
It is a traditional practice for organization to judge the effectiveness of their
processes by calculating rate at the end of the process .
For example : if 100 items and of those 100 items 99% pass inspection that
does not mean it is at a level of Six Sigma . Lets have a look at the processes
Step 1 Step 2 Step 3 Step 4 Step 5
Yield 97% Yield 82% Yield 91% Yield 82% Yield 99%
Now we have stage 5 has got 99% but this is not the real case , the rolled
throughput yield is not an average of the yields of steps 1 through
5.instead, to get the actual yield, we multiply all of the yields together.
0.97 * 0.82 * 0.91 * 0.82 * 0.99 = 0.57 * 100 = 57% RTY
52. How It Breaks Down
Step 1 : 97% yield. That means that 97 of the 100 move to step 2
Step 2 : of those 97, only 79 (82%) go to step 3
Step 3 : of those 79, only 71 (91%) go on to step 4
Step 4 : of those 71, only 58 (82%) go to step 5
Step 5 : of those 58, only 57 (99%) go to the shipping department .
The worker in the shipping department, who is not aware of the failures
upstream, is likely to report that the process is producing at 99% effectiveness;
when in reality, the rolled throughput yield is only 57% and as such
opportunities are missed.
0.97 * 0.82 * 0.91 * 0.82 * 0.99 = 0.57 * 100 = 57% RTY
53. Activity Network Diagram
An activity network diagram is a diagram of project activities that shows
the sequential relationships of activities using arrows and nodes.
Suppose the team is tasked with improving
the process of building a house . The team
lists the major steps involved- everything
from the excavation step through the
landscaping step
Now :
Define Activities
Excavate , Frame, Roof,
Exterior Interior,
Electricity Masonry
Landscape, Foundation
Sequence Activities
A. Excavate
B. Foundation
C. Frame
D. Electrical
E. Roof
F. Masonry
G. Interior
H. Exterior
I. Landscape
Estimate Activity
Duration
A. Excavate 5 days
B. Foundation 2 days
C. Frame 12 days
D. Electrical 9 days
E. Roof 5 days
F. Masonry 8 days
G. Interior 10 days
H. Exterior 7 days
I. Landscape 5 days
Estimate Activity
resources
1. What kind of effort
are we thinking
about
2. How man people do
we think we need
3. What skills level are
you looking for.
54. We can develop a Gantt Chat to develop schedule for
the project management where everyone will have
the visibility of total work progress.
The schedule pulls all of the
information together to measure the
expected project end date.
55. Interrelationship Diagram
An interrelationship diagram shows graphically the cause-and-effect
relationships that exist among a group of items , issues, problems or
opportunities .
A local physicians
group is
experiencing a
relatively high
number of patient
complaints regard
the lack of returned
phone calls .
“overly optimistic promise dates” for follow-up calls” is a key issue and would cause patient
to expect a phone call faster that the group believes it can deliver it.
56. Example of Interrelationship Diagram
The basic idea is to count the number of “in” and “out” arrows to and from a
particular issue and to use these counts to assist us in prioritizing the issues.
What factors contribute to student success?
57. Analyzing
In the analyze phase, data collected during the measure phase is reviewed.
Both the data and the process are analyzed , in a n effort to narrow down and
verify the root causes of waste and defects.
Activities
1. Define performance objectives
2. Identify value/non-value added
process steps
3. Identify source of variation
4. Determine root causes
5. Identify significant process
inputs.
Tools and techniques
1. Histogram
2. Root cause analysis (fishbone
diagram )
3. 5 whys
4. 5w’s and H method
5. Regression analysis
6. Hypothesis analysis
7. Run chart
8. ANOVA analysis
9. Fault tree diagram
58. Root Cause Analysis
Root cause analysis is a useful process for understanding and solving a problem,. Figure
out what negative events are occurring. Then, look at the complex systems around those
problems, and identify key points of failure. Finally, determine solution to address
those key points, or root causes.
59. Cause and Effect Diagram
A cause effect diagram is a graphical tool for displaying a list of
causes associated with a specific effect. It is also known as a
fishbone diagram or an Ishikawa diagram(created by Dr. Kaoru
Ishikawa, an influential quality management innovator).
Man Machine Material
Method Measurement
Mother
Nature
Causes Effect
Causes are usually grouped into major categories to identify these
sources of variation. The categories typically include:
1. Man 2. Machine 3. Material
4. Method 5. Measurement 6. Mother Nature
60. Fishbone Diagram
From the example we can
see that ,
There are many reasons
for missing the bus we did
the fishbone analysis to
find out the possible
reasons behind the effects
and we know the causes of
missing bus.
This is how we can find
out the reasons behind the
effects.
62. Pareto Chart Analysis
0%
20%
40%
60%
80%
100%
120%
0
200
400
600
800
1000
1200
1400
Amount
Cumulative Pct
Series2
Expense Amount Cumulativ
e pct
Rent 1200 47%
Car Payment 500 66%
Groceries 400 82%
Gas 300 93%
Mobile Phone 100 97%
Cable 70 100%
We are already know the history of Pareto chart. It helps to find
out the 20% factors that cause 80% problems. Through the Pareto
chart we can focus on that 20% factors and can improve the
process.
63. 5 Whys Analysis
To solve a problem effectively , we need to drill down to identify
the underline cause so Sakichi Toyoda 5 why’s techniques is the
simple but very powerful tool for quickly uncovering the root of
a problem.
Sakichi Toyoda, one of the fathers of the Japanese
industrial revolution, developed the technique in
the 1930s. He was an industrialist, inventor and
founder of Toyota Industries. His technique
became popular in the 1970s and Toyota still
uses it to solve problems today.
Sakichi Toyoda
64. 5 Why’s Example
To use it we start with the problem we are facing then keep
asking why until we discover the root cause .
Why ?
Forget to
replace
them
65. 5WH Analysis
5WH Analysis is a problem definition technique which works by asking 6
questions about a defect or any other problem.
What : create adequate precise description.
Who : individuals associated with the problem?
When : at what moment, frequency?
Where : locations of the problem ?
Why : already known explanations contributing to the problem?
How : mode, situation , procedure of the problem?
What
Concept
Who
People
When
Situation
Where
Business
Practice
How
Method
Why
Objectives
Problem Statement
66. Improve Phase
The goal of the DMAIC improve Phase is to indentify a solution
to the problem that the project aims to address. In this phase we
will be trying to look for solution of the problem that was
identified in the analysis phase.
Activities
1. Consolidate our analysis.
2. Generate solutions
3. Create an implementation plan.
4. Implement the solutions.
Tools and Techniques
1. Brainstorming
2. Kaizen
3. 5s
4. Mistake proving Poke Yoke
5. Failure mood and effects
analysis (FEME).
67. Brainstorming
Brainstorming is group creativity technique by which
efforts are made to find a conclusion for a specific
problem by gathering a list of ideas spontaneously
contributed by its members.
Effective Brainstorming includes
Collect as many ideas as possible.
All ideas are welcome no matter how silly it is.
No Discussion during Brainstorming
Do not criticize or judge . Do not even groan, frown , or laugh
Do “Piggyback” or build on other ideas.
Go for quantity over quality- the ore creative ideas the better.
68. 5S Improvement System
5s is the name of a workplace organization method that uses a list of
five Japanese words: seiri, seiton, seiso, seiketsu, and shitsuke.
Better visual management
Improved safety
Improved quality
Improved Productivity
Boosted Morale
Improved Company Image
69. 5S Explanation
It is a system to reduce waste and optimize productivity through maintaining
an orderly workplace and using visual cues to achieve more consistent
operational results.
Sort Straighten Shine Standardize Sustain
Eliminate
Unnecess
ary
Items
from the
workplace
Arrange
items so
that they
are easy
to use,
find and
put away
Keep the
items and
work area
neat and
clean
Create a
consistent
approach
to tasks
and
procedures
Make a
habit of
maintainin
g the
correct
procedures
70. Kaizen (Continuous Improvement)
Kaizen is a Japanese philosophy that focuses on continual improvement
throughout all aspects of life. Kaizen aims to eliminate waste in all systems
of an organization through improving standardized activities and
processes.
The continuous cycle of Kaizen activities has seven phases
1. Identify an opportunity
2. Analyze the process
3. Develop an optimal
solution
4. Implement the solution
5. Study the results
6. Standardize the solution
7. Plan for the future
72. 14 Rules of Kaizen
1. Keep an open mind to change
2. Maintain a positive attitude
3. Create a blameless environment
4. Encourage non judgmental thinking.
5. Be aware of multiple alternatives
6. Treat other as you would want to be treated.
7. Respect and involve all team members
8. one person, one vote.
9. Create a team environment
10.No such thing as a dumb question
11. Create a bias for action
12. Creativity before capital .
13. Never leave in silent agreement
14. Have fun doing it
73. Kaizen Example
Before Kaizen
After Kaizen
One office that processes expense reports for a company held a
day-long Kaizen event to analyze and improve the cycle time.
The analysis showed hat expense reports spent most of their tie in
“queue” just waiting for someone to sigh them . Then we apply
Kaizen .
74. Zero Defect Policy
The goal is to understand like concept and practice of zero
defects and how to develop Poke – Yoke to eliminate these
defects .
Typically defect rates are tracked by
1. The point at which defect is discovered
2. The point at which defect occurred.
Attitude toward defects should be
1. I do not accept defects
2. I do not make defects
3. I do not pass on defects.
75. Poka-yoke Technique
Poke-yoke is a technique for avoiding simple human error in the
workplace. It is also know as mistake-proofing and fail-safe work
methods. Poka-yoke helps preventing errors obviously improves
quality, but it also plays a major role in improving productivity with
no rework, and easier production, cycle times and lead times both
become much shorter. And, of course, faster production with fewer
defects means lower cost.
Potential Benefits for using Poka-yoke
1. Elimination of set-up errors and improved quality.
2. Simplified and improved housekeeping
3. Increased safety.
4. Lower costs
5. Lower skill requirements
6. Increased production flexibility .
7. Improved operator attitudes .
77. Failure Modes and Effects Analysis
Goals :
1. Reduce risk of failure
2. Ensure failures are detectible
3. Prevent failure from happing
Failure Mode and Effects Analysis (FMEA) is a structured approach
to discovering potential failures that may exist within the design of
a product or process. Failure Mode and Effects Analysis is designed
to identify, prioritize and limit these failure modes.
Why?
Keep track of potential failure and
countermeasures to reduce the risk
78. Failure Mood and Effect Analysis Process
Identify modes of failure (Example car will not stop).
Identify consequences and related systems for each mode.
Rate the severity of each effect.
Identify potential root causes for each failure mode.
Rate the probability of occurrence of each root cause.
Identify process controls and indicators.
Rate detectability of each mode.
Calculate risk priority and criticality .
Design to mitigate high risk or highly critical failure and reassess to ensure
goals have been achieved.
p
r
o
c
e
s
s
79. Example of FMEA
Mode of
Failure
Cause Effects Frequency Severity Detection RPN
Card
Printed
incorrectly
Incorrect
informatio
n provided
Card must
be reissued
3 8 5 120
Informatio
n
incorrectly
entered in
database
Card must
be reissued
5 8 5 200
A professional association is concerned about he process it uses to issue
membership cards. They decide to conduct an FMEA of the process and
part of the FMEA is given below.
The frequency shows how likely this cause is to occur.
The severity value shows how significant the impact is.
The detection value measures how likely this mistake is to be detected.
The Risk
Priority
Number(R
PN)
indicates
which one
should be
given
priority for
action.
80. Control Phase
The control phase is the final phase of
lean six sigma. The team focuses on how
to sustain newly achieved improvements
by passing it onto other employees .
Activities Tools and techniques
•process control plan
•Monitoring and response plan
•Documentation and story board.
•Integrate and manage solutions in
daily work processes
•Integrate lessons learned
•Control chart
•Standard operating procedures
•Visual process control
•Total productive management
•Lean accounting
81. Standard Operating procedures
A standard operating procedure is a set of writing instructions that
document a routine activity that is to be followed by member of an
organization .standard operating procedures are essential parts of good
quality systems .
For example :
SOPs for
washing Hands
Inadequate SOP
1. Wet hand and forearms.
2. Thoroughly apply the soap
3. Lather the hands and forearms
4. Continue to lather and scrub
5. thoroughly rinse forearms and hands
6. Dry hands and forearms thoroughly
82. Better SOPs
1. Wet hands and forearms whit warm, running water (temperature should be 100
F)
2. Thoroughly apply the soap from the forearms to the hands
3. Lather the hands and forearms. Be sure to get soap under fingernails and between
fingers.
4. Continue to lather and scrub for at lease 10 seconds.
5. Thoroughly rinse forearms and hands with clean water. No remaining soap
should be visible on the forearms, hands or under nails .
6. Dry hands and forearms thoroughly with single-use paper towels
7. Use the paper towel to turn off the water and use the same paper towel to open
the door as you exits the restroom
This SOP provides more specification.
83. What is Run Chart
A run chart is used to monitor the behavior of a variable over time for a
process or system. Run charts graphically display cycles, trends, shifts, or
non-random patterns in behavior over time.
Date
What does a run chart do?
•Monitor processes
•Compare
•Focus attention
•Track information
Run charts can help identify problems and the time when a problem occurred, or
monitor progress when solutions are implemented.
86. Background of Control Chart
Control charts, also know as Shewhart Chart or process-behavior
charts , in statistical process control are tools used to determine if a
manufacturing or business process is in a state of statistical control
Walter A, Shewhatt
Walter Andrew Shewhart (1891-1967) was an Americal Physicist,
engineer and statistician, sometimes known as the father of
statistical quality control and also related to the Shewhart cycle.
87. Control chart
A control chart represents a picture of a process over time. To effectively use
control chart, we must be able to interpret the picture. Through the control
chart we will be able to find out whether our process is stable or out of
control.
Three characteristics of a process
that is in control are :
1. Most points are near the
average
2. A few points are near the
control limits
3. No points are beyond the
control limits
88. Control Chart interpret
Points beyond the control limits
A special cause is present in the process if
any points fall above the upper control
limit or below the lower control limit.
Settings the zone
The first steps is divide the control chart
into zones. this is done by dividing the
area between the average and the upper
control limit into three equally spaced
areas. This is then repeated for the area
between the average and the lower
control limit.
89. Continue
Setting the zone A
A special cause exists if two out of
three consecutive points fall in zone a
or beyond. The test is applied for the
zone a above the average and then for
the zone a below the average.
Setting the zone B
A special cause exist if four out five
consecutive points fall in zone B or beyond.
Setting the zone C
A special cause exists if seven consecutive
points fall in zone c or beyond.
90. Stratification test
Stratification (a special cause)
exists if fifteen or more
consecutive points fall in zone
C either above or below the
average. The points tend to hug
the centerline.
Test for Mixtures
A mixture (a special cause ) is present if
eight or more consecutive points lie on both
sides of the average with none of the points
in zone c.
91. Rule of Seven Test
The following test state that an out of control situation is present if
one of the following conditions is true.
1. Seven points in a
row above the
average
2. Seven points in a
row below the
average
3. Seven points in a
row trending up or
4. Seven points in a
row trending
down.
93. By interpreting the control chart we will be able to find out the
problem in the work process and able to look for the solution.
Summary of Control Chart
Common cause Variation
Special Cause
Variation
Upper control
Limit
Lower control
Limit
Average /
Mean
94. Total Quality Management
TQM is a comprehensive and structured approach to organizational
management that seeks to improve the quality of products and
service through refinements in response to continuous feedback.
Planning
and
organiza
tion
Team
work and
involvem
ent
Working
Together
Training,
tools and
techniqu
es
Measuri
ng and
feedback
Top
Manage
ment
support
TQM
Approach
TQM can be a powerful
technique for
unleashing employee
creativity and potential,
reducing bureaucracy
and costs, and
improving service to
clients and the
community.
95. Total Productive Maintenance
It is a company wide, team based effort to improve output
quality through equipment care and to improve overall
equipment effectiveness.
Total : All employees are involved
and it aims to eliminate all
accidents , defects and
breakdown.
Productive : actions
performed during production
and troubles for productions are
minimized .
Maintenance : keep in good condition and improve overall
equipment effectiveness.
96. Total Productive Maintenance
Goal
Maximize overall equipment effectiveness (OEE) by
minimizing equipment related losses.
Provide a system of comprehensive maintenance for
the life cycle of equipment.
Involve departments that plan , design use, and
maintain the equipment
TPM is proactive
1. preventive Maintenance
2. predictive Maintenance
97. House of Quality
(Quality Function Deployment)
The house of quality is the first matrix in four-phase Quality Function
Deployment(QFD) process. It is called the house of quality because if the
correlation matrix that is roof shaped and sits on top of the main body of
the matrix
Benefits of House of quality
1. Service offerings are built and
prioritized on objective
customer needs and
requirements
2. Increased customer
satisfactions and loyalty
3. Increased customer
utilization , sales and share of
wallet
98. Quality Function Deployment
Example
How to use
Step 1. determine
customer
requirements.
Step 5.
Complete the house
of quality with the
conflicts and
synergies matrix.
Step 4. complete the
correlation matrix.
Step 3. prioritize
customer requirements
using the following
point scale : high/strong,
medium/moderate and
low / weak .
Step 2. determine
the fictional
requirements.
A local bank is interested in improving the training
of its teller then we get data from critical-to-quality
tree and establish House of quality
99. Lean Accounting
Lean accounting is the general terms used for the change required
to a company’s accounting, control, measurement, and
management processes to support lean manufacturing and lean
thinking.
Lean accounting attempts
to provide opportunities
to correctly capture the
value of improvements
resulting from lean
activities and projects.
Rolled Throughput Yield (RTY) is the probability that a single unit can pass through a series of process steps free of defects.
Next we will turn our attention to a Rolled Throughput Yield example. If you will remember, the First Time Yield calculation we did (FTY) considered only what went into a process step and what went out. Rolled Throughput Yield adds the consideration of rework. Using the previous example:
Process A = 100 units in and 90 out Process B = 90 in and 80 out Process C = 80 in and 75 out Process D = 75 in and 70 out.
If in order to get the yield out of each step we had to do some rework (which we probably did) then it really looks more like this:
Process A = 100 units, 10 scrapped and 5 reworked to get the 90. The calculation becomes [100-(10+5)]/100 = 85/100 = .85 This is the true yield when you consider rework and scrap.
Process B = 90 units in, 10 scrapped and 7 reworked to get the 80. [90-(10+7)]/90 = .81
Process C = 80 units in, 5 scrapped and 3 reworked to get the 75. [80-(5+3)]/80 = .9
Process D = 75 units in, 5 scrapped and 10 reworked to get the 70. [75-(5+10)]/75 = .8
Now to get the true Rolled Throughput Yield (Considering BOTH scrap and the rework necessary to attain what we thought was first time throughput yield) we find that the true yield has gone down significantly:
.85*.81*.9*.8 = .49572 or Rounded to the nearest digit, 50% yield. A substantially worse and substantially truer measurement of the process capability. An Assumption is made in the preceeding example that there are no spilled opportunities after each process step.
Failure Modes and Effects Analysis (FMEA) is a systematic, proactive method for evaluating a process to identify where and how it might fail and to assess the relative impact of different failures, in order to identify the parts of the process that are most in need of change. FMEA includes review of the following:
Steps in the process
Failure modes (What could go wrong?)
Failure causes (Why would the failure happen?)
Failure effects (What would be the consequences of each failure?)
Teams use FMEA to evaluate processes for possible failures and to prevent them by correcting the processes proactively rather than reacting to adverse events after failures have occurred. This emphasis on prevention may reduce risk of harm to both patients and staff. FMEA is particularly useful in evaluating a new process prior to implementation and in assessing the impact of a proposed change to an existing process
Process Steps:
Identify modes of failure (Example car will not stop).
Identify consequences and related systems for each mode.
Rate the severity of each effect.
Identify potential root causes for each failure mode.
Rate the probability of occurrence of each root cause.
Identify process controls and indicators.
Rate detectability of each mode.
Calculate risk priority and criticality .
Design to mitigate high risk or highly critical failure and reassess to ensure goals have been achieved.
A control chart represents a picture of a process over time. To effectively use control charts, one must be able to interpret the picture. What is this control chart telling me about my process? Is this picture telling me that everything is all right and I can relax? Is this picture telling me that something is wrong and I should get up and find out what has happened? A control chart tells you if your process is in statistical control. The chart above is an example of a stable (in statistical control) process.
This pattern is typical of processes that are stable. Three characteristics of a process that is in control are:
Most points are near the average
A few points are near the control limits
No points are beyond the control limits
If a control chart does not look similar to the one above, there is probably a special cause present. Various tests for determining if a special cause is present are given below.
Points Beyond the Control Limits
A special cause is present in the process if any points fall above the upper control limit or below the lower control limit. Action should be taken to find the special cause and permanently remove it from the process. If there is a point beyond the control limits, there is no need to apply the other tests for out of control situations. Points on the control limits are not considered to be out of statistical control.
Zone Tests: Setting the Zones and Zone A
The zone tests are valuable tests for enhancing the ability of control charts to detect small shifts quickly. The first step in using these tests is to divide the control chart into zones. This is done by dividing the area between the average and the upper control limit into three equally spaced areas. This is then repeated for the area between the average and the lower control limit.
The zones are called zones A, B, and C. There is a zone A for the top half of the chart and a zone A for the bottom half of the chart. The same is true for zones B and C. Control charts are based on 3 sigma limits of the variable being plotted. Thus, each zone is one standard deviation in width. For example, considering the top half of the chart, zone C is the region from the average to the average plus one standard deviation. Zone B is the region between the average plus one standard deviation and the average plus two standard deviations. Zone A is the region between the average plus two standard deviations and the average plus three standard deviations.
A special cause exists if two out of three consecutive points fall in zone A or beyond. The figure below shows an example of this test. The test is applied for the zone A above the average and then for the zone A below the average.
This test, like those below, is applied to both halves of the chart. However, only one half is considered at a time. For example, if one point falls in the zone A above the average and the next point falls in zone A below the average, this is not two out of three consecutive points in zone A or beyond. The two points in zone A must be on the same side of the average.
Zone Tests: Zones B and C
A special cause exists if four out five consecutive points fall in zone B or beyond. The figure below shows an example of this test. This test is applied for zone B above the average and then for zone B below the average.
A special cause exists if seven consecutive points fall in zone C or beyond. An example of this test is shown below. The test should be applied for the zone C above the average and then for the zone C below the average.
Test for Stratification
Stratification occurs if two or more processes (distributions) are being sampled systematically. For example, stratification can occur if samples are taken once a shift and a subgroup size of 3 is formed based on the results from three shifts. It is possible that the shifts are operating at a different average or variability. Stratification (a special cause) exists if fifteen or more consecutive points fall in zone C either above or below the average. The figure below is an example of this test. Note that the points tend to hug the centerline. This test involves the use of the zones but is applied to the entire chart and not one-half of the chart at a time. If stratification is occurring, a histogram of the individual measurements will probably be bimodal.
Test for Mixtures
A mixture exists when there is more than one process present but sampling is done for each process separately. For example, suppose you take three samples per shift and form a subgroup based on these three samples. If different shifts are operating at different averages, a mixture can occur. A mixture (a special cause) is present if eight or more consecutive points lie on both sides of the average with none of the points in zone C. The figure below shows an example of this test. Note the absence of points in zone C. This test is applied to the entire chart.
Rule of Seven Tests
These tests are often taught initially to employees as the method for interpreting control charts (along with points beyond the limits). The tests state that an out of control situation is present if one of the following conditions is true: 1) Seven points in a row above the average, 2) Seven points in a row below the average, 3) Seven points in a row trending up, or 4) Seven points in a row trending down. These four conditions are shown in the figure below.
Quality function deployment (QFD) integrates customer requirements (voice of the customer, or VOC) into the design and delivery of a service offering. The primary tool used in QFD is known as the “house of quality,” which helps facilitate group decision-making.
In service industries, QFD is primarily used to determine the priorities of customer requirements in order to target the focus of service offerings and delivery. Since the scope of QFD is broad, this discussion will focus on explaining the house of quality.
Benefits
Service offerings are built and prioritized on objective customer needs and requirements
Increased customer satisfaction and loyalty
Increased customer utilization, sales, and share of wallet
How to Use
Step 1. Determine customer requirements.
Step 2. Determine the functional or “critical to customer” (CTC) requirements. CTCs must be measurable.
Step 3. Prioritize customer requirements using the following point scale: high/strong (9), medium/moderate (3), and low/weak (1).
Step 4. Complete the correlation matrix (see sample below).
Step 5. Complete the house of quality with the conflicts and synergies matrix.
Relevant Definitions
Voice of the customer (VOC): A method of gathering and incorporating the customer’s expectations, aversions, and preferences related to service delivery.
Critical to customer: The requirements the customer must have for service to meet expectations.