Download as PDF, PPTX
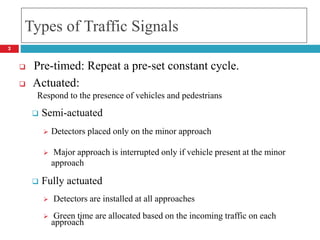
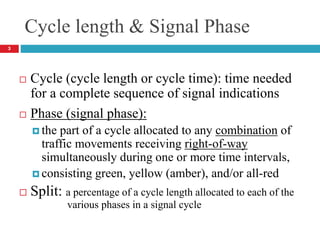
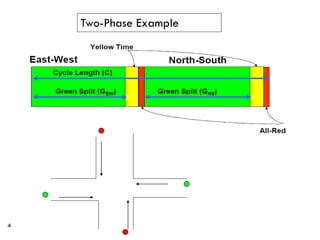
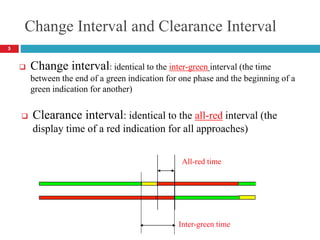
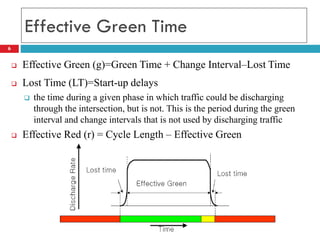
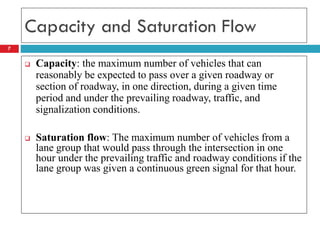
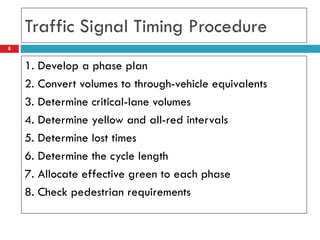
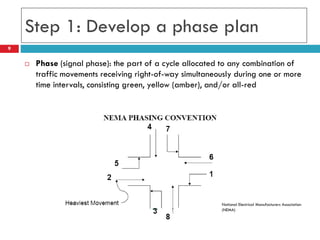
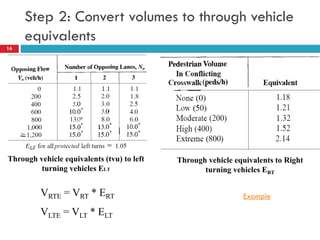
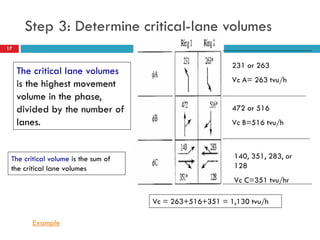
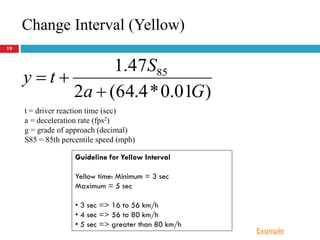
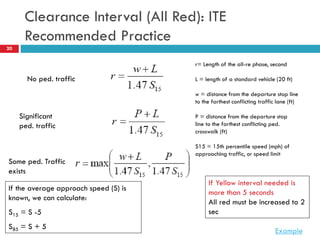
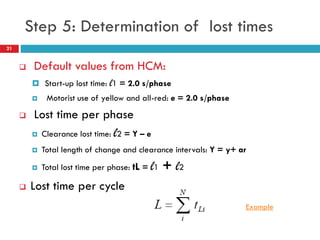
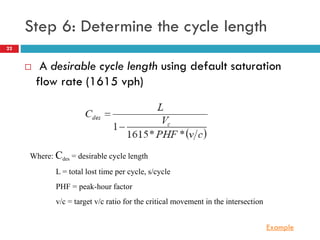

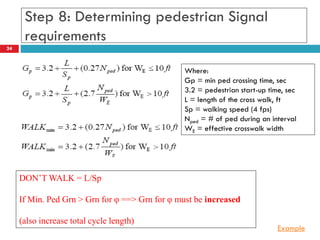
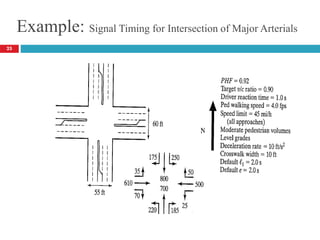
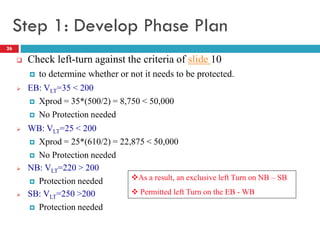
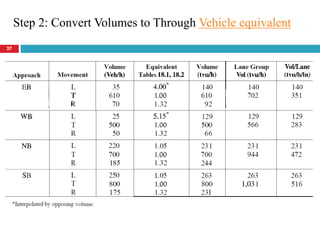
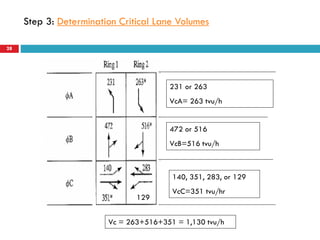
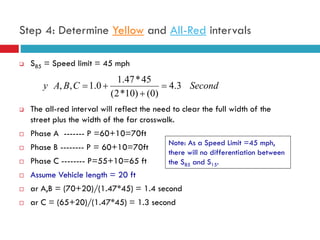
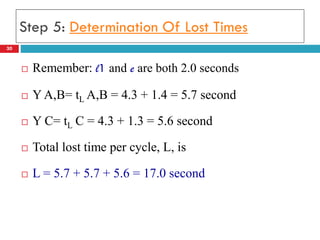

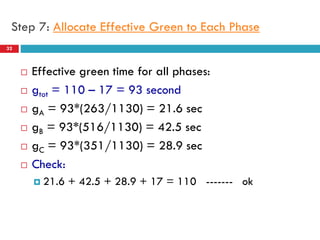
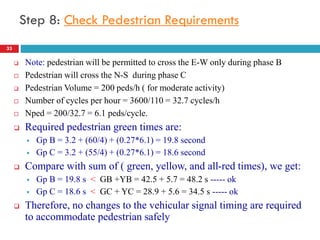
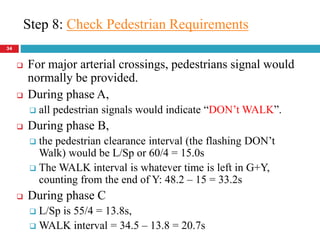

This document discusses types of traffic signals and signal timing procedures. It describes pre-timed and actuated signals, and defines key terms like cycle length, phase, split, effective green time, and lost time. It provides a step-by-step procedure for developing signal timing plans, including determining critical lane volumes, yellow and red intervals, cycle length, effective green allocation to phases, and checking pedestrian requirements. An example application of the timing procedure to an intersection of major arterials is presented over multiple slides.


![11 Geometric Design of Railway Track [Vertical Alignment] (Railway Engineerin...](https://cdn.slidesharecdn.com/ss_thumbnails/geometricdesignofrailwaytrack-ii-200415172410-thumbnail.jpg?width=640&height=640&fit=bounds)
![10 Geometric Design of Railway Track [Horizontal Alignment] (Railway Engineer...](https://cdn.slidesharecdn.com/ss_thumbnails/geometricdesignofrailwaytrack-i-200415171932-thumbnail.jpg?width=640&height=640&fit=bounds)


