Downloaded 206 times


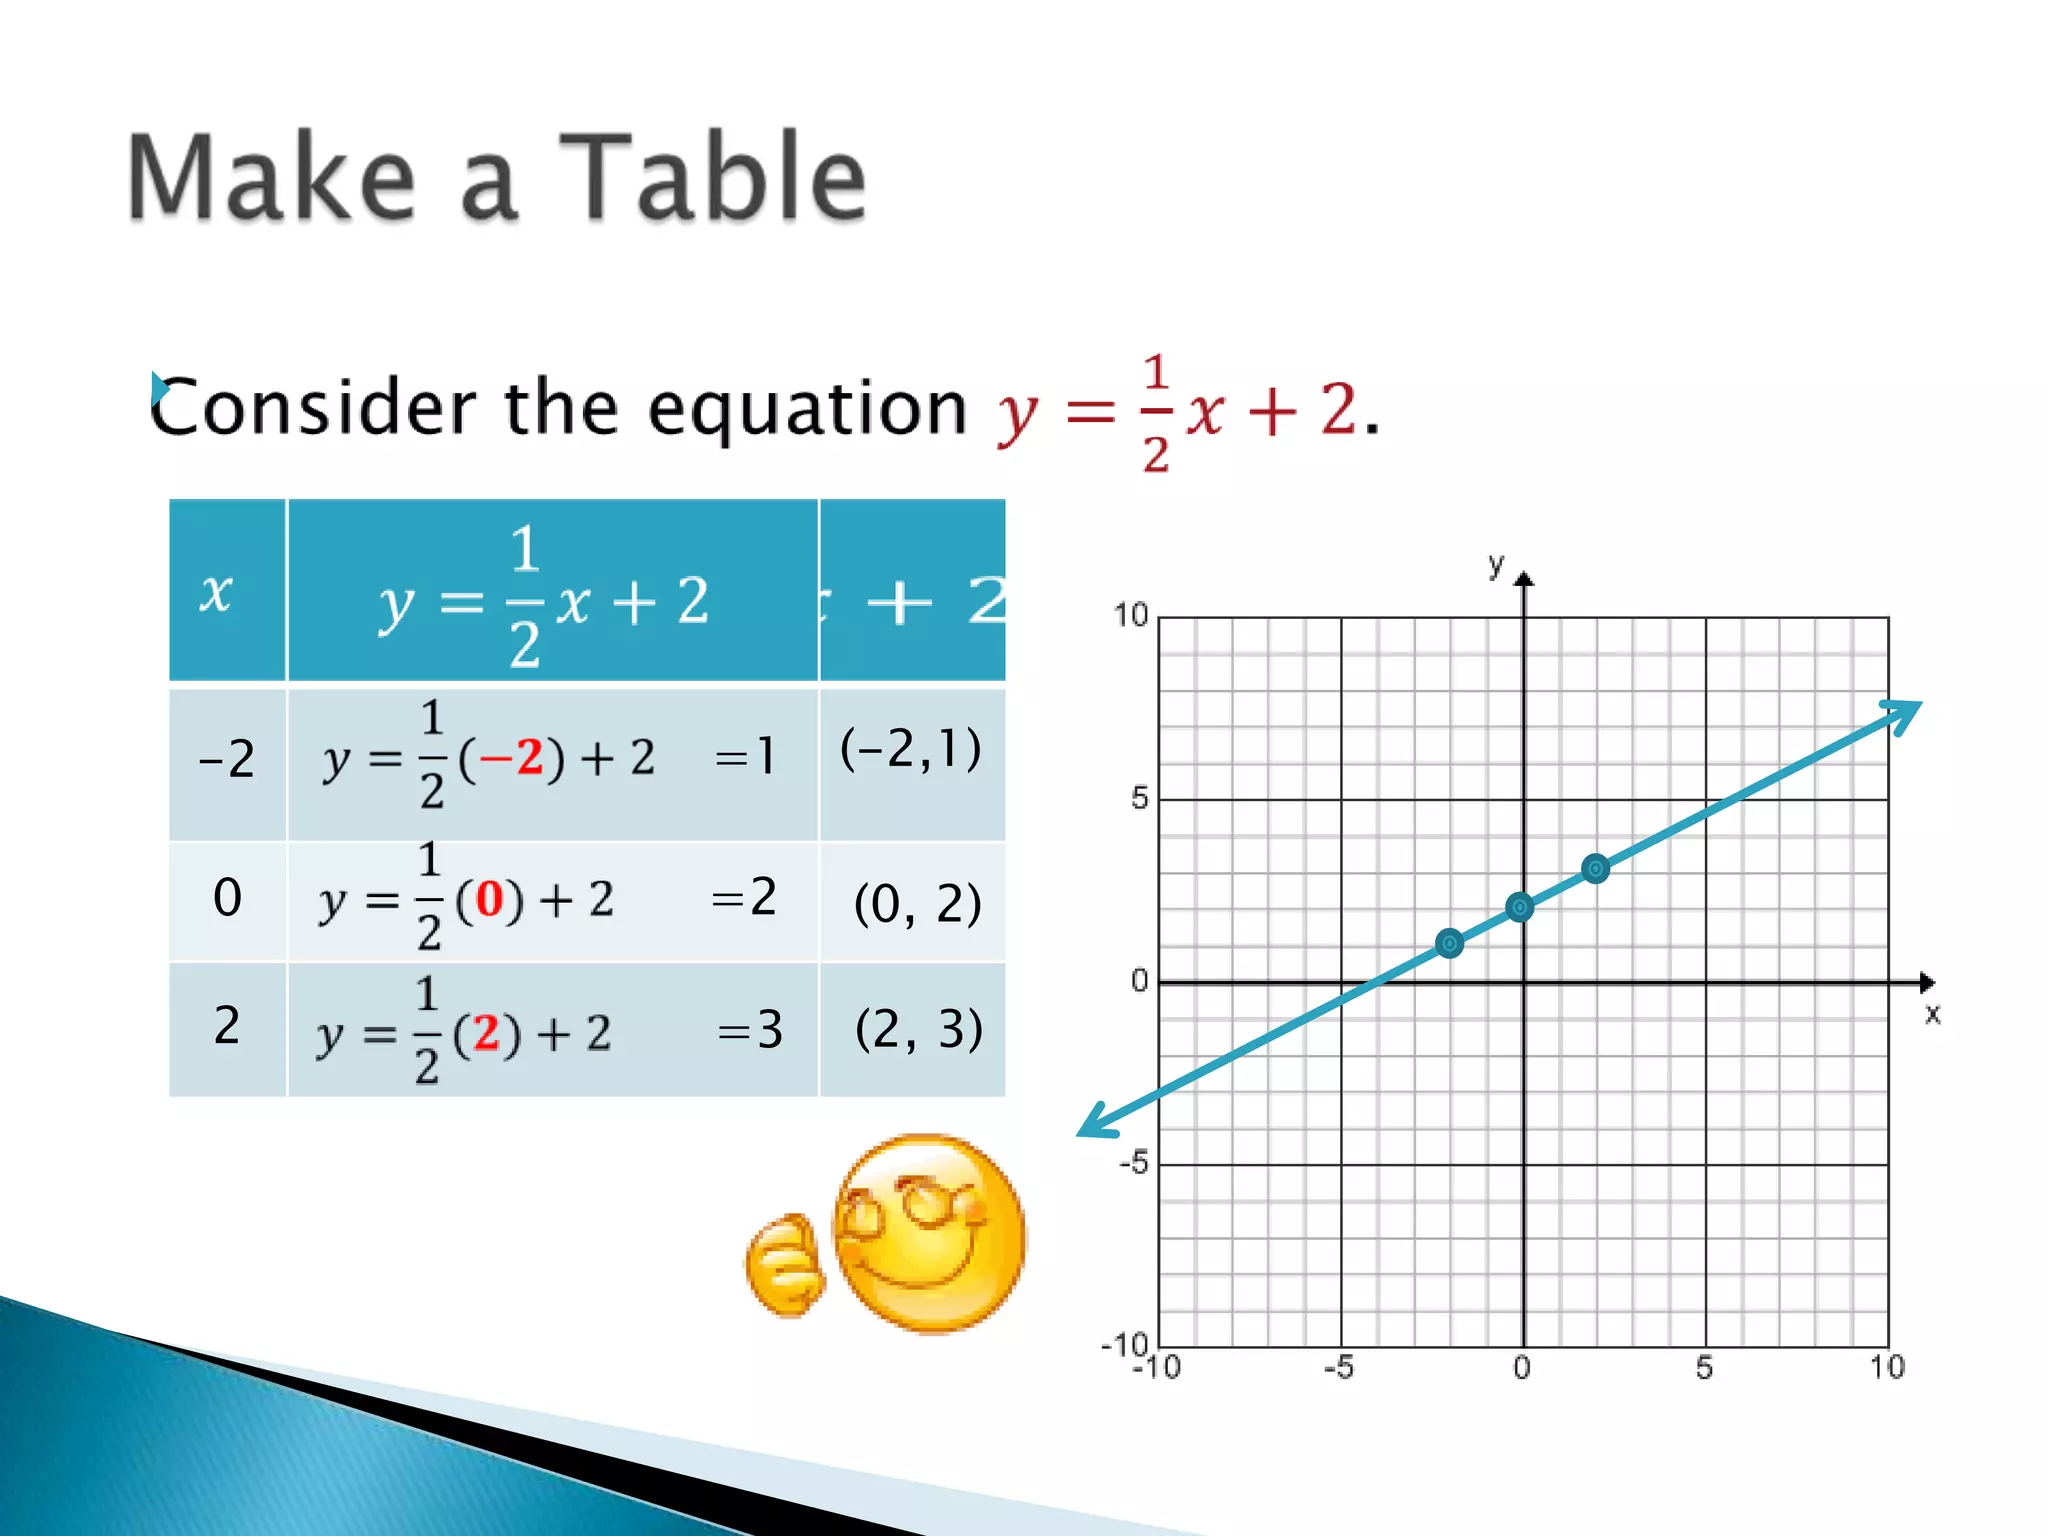

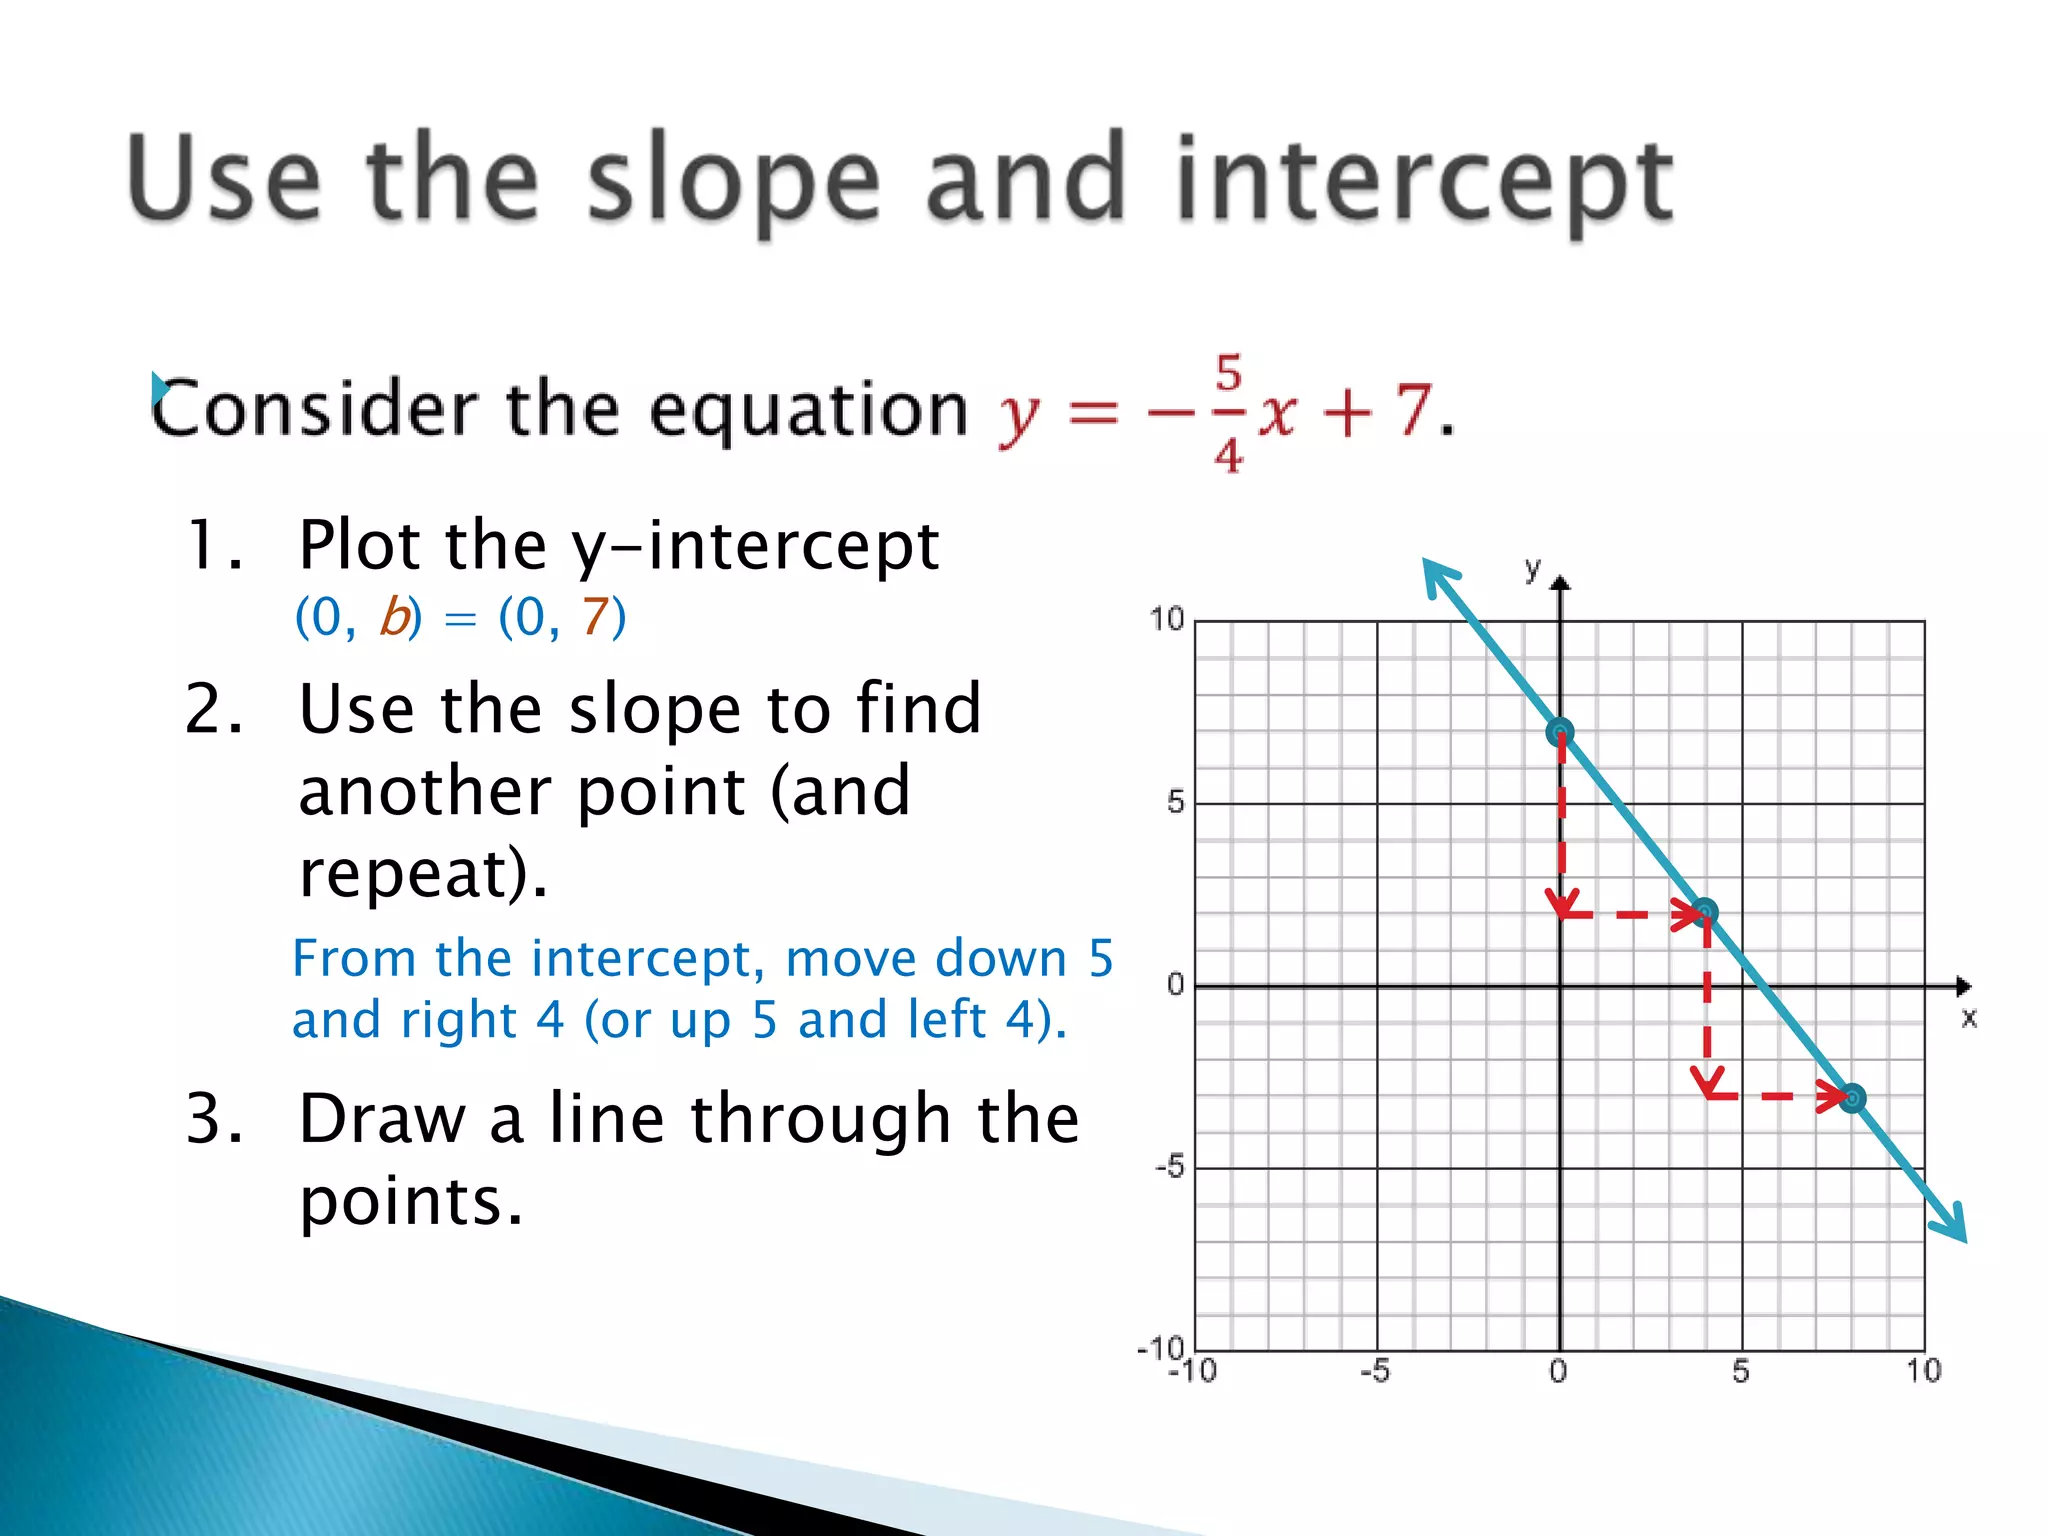

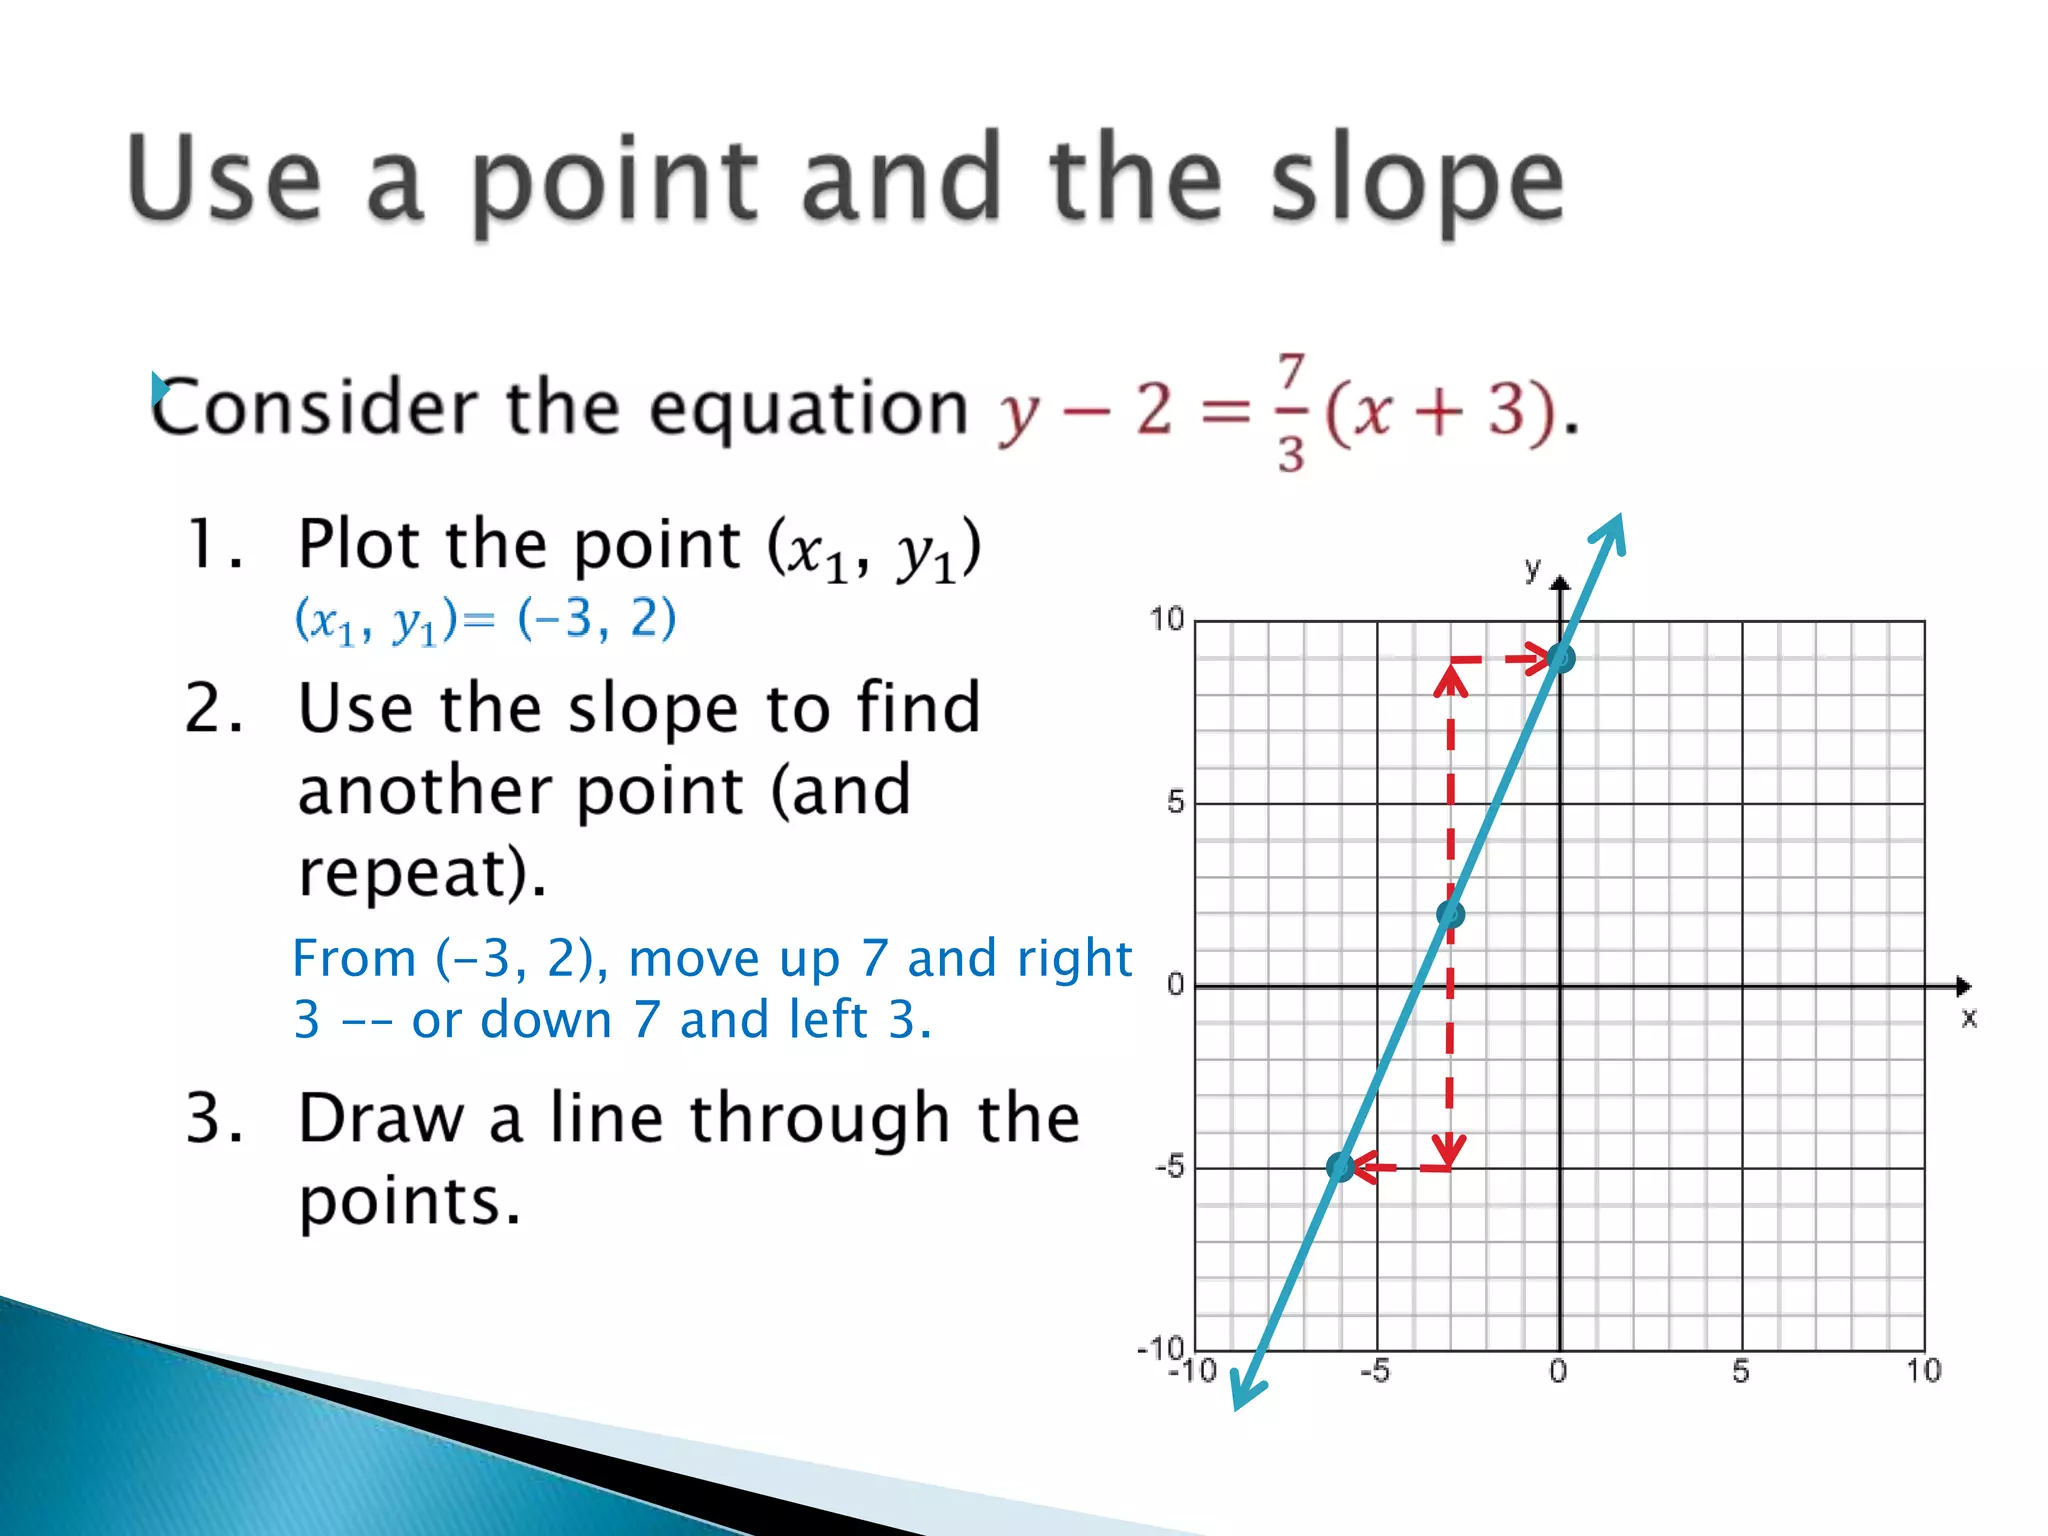

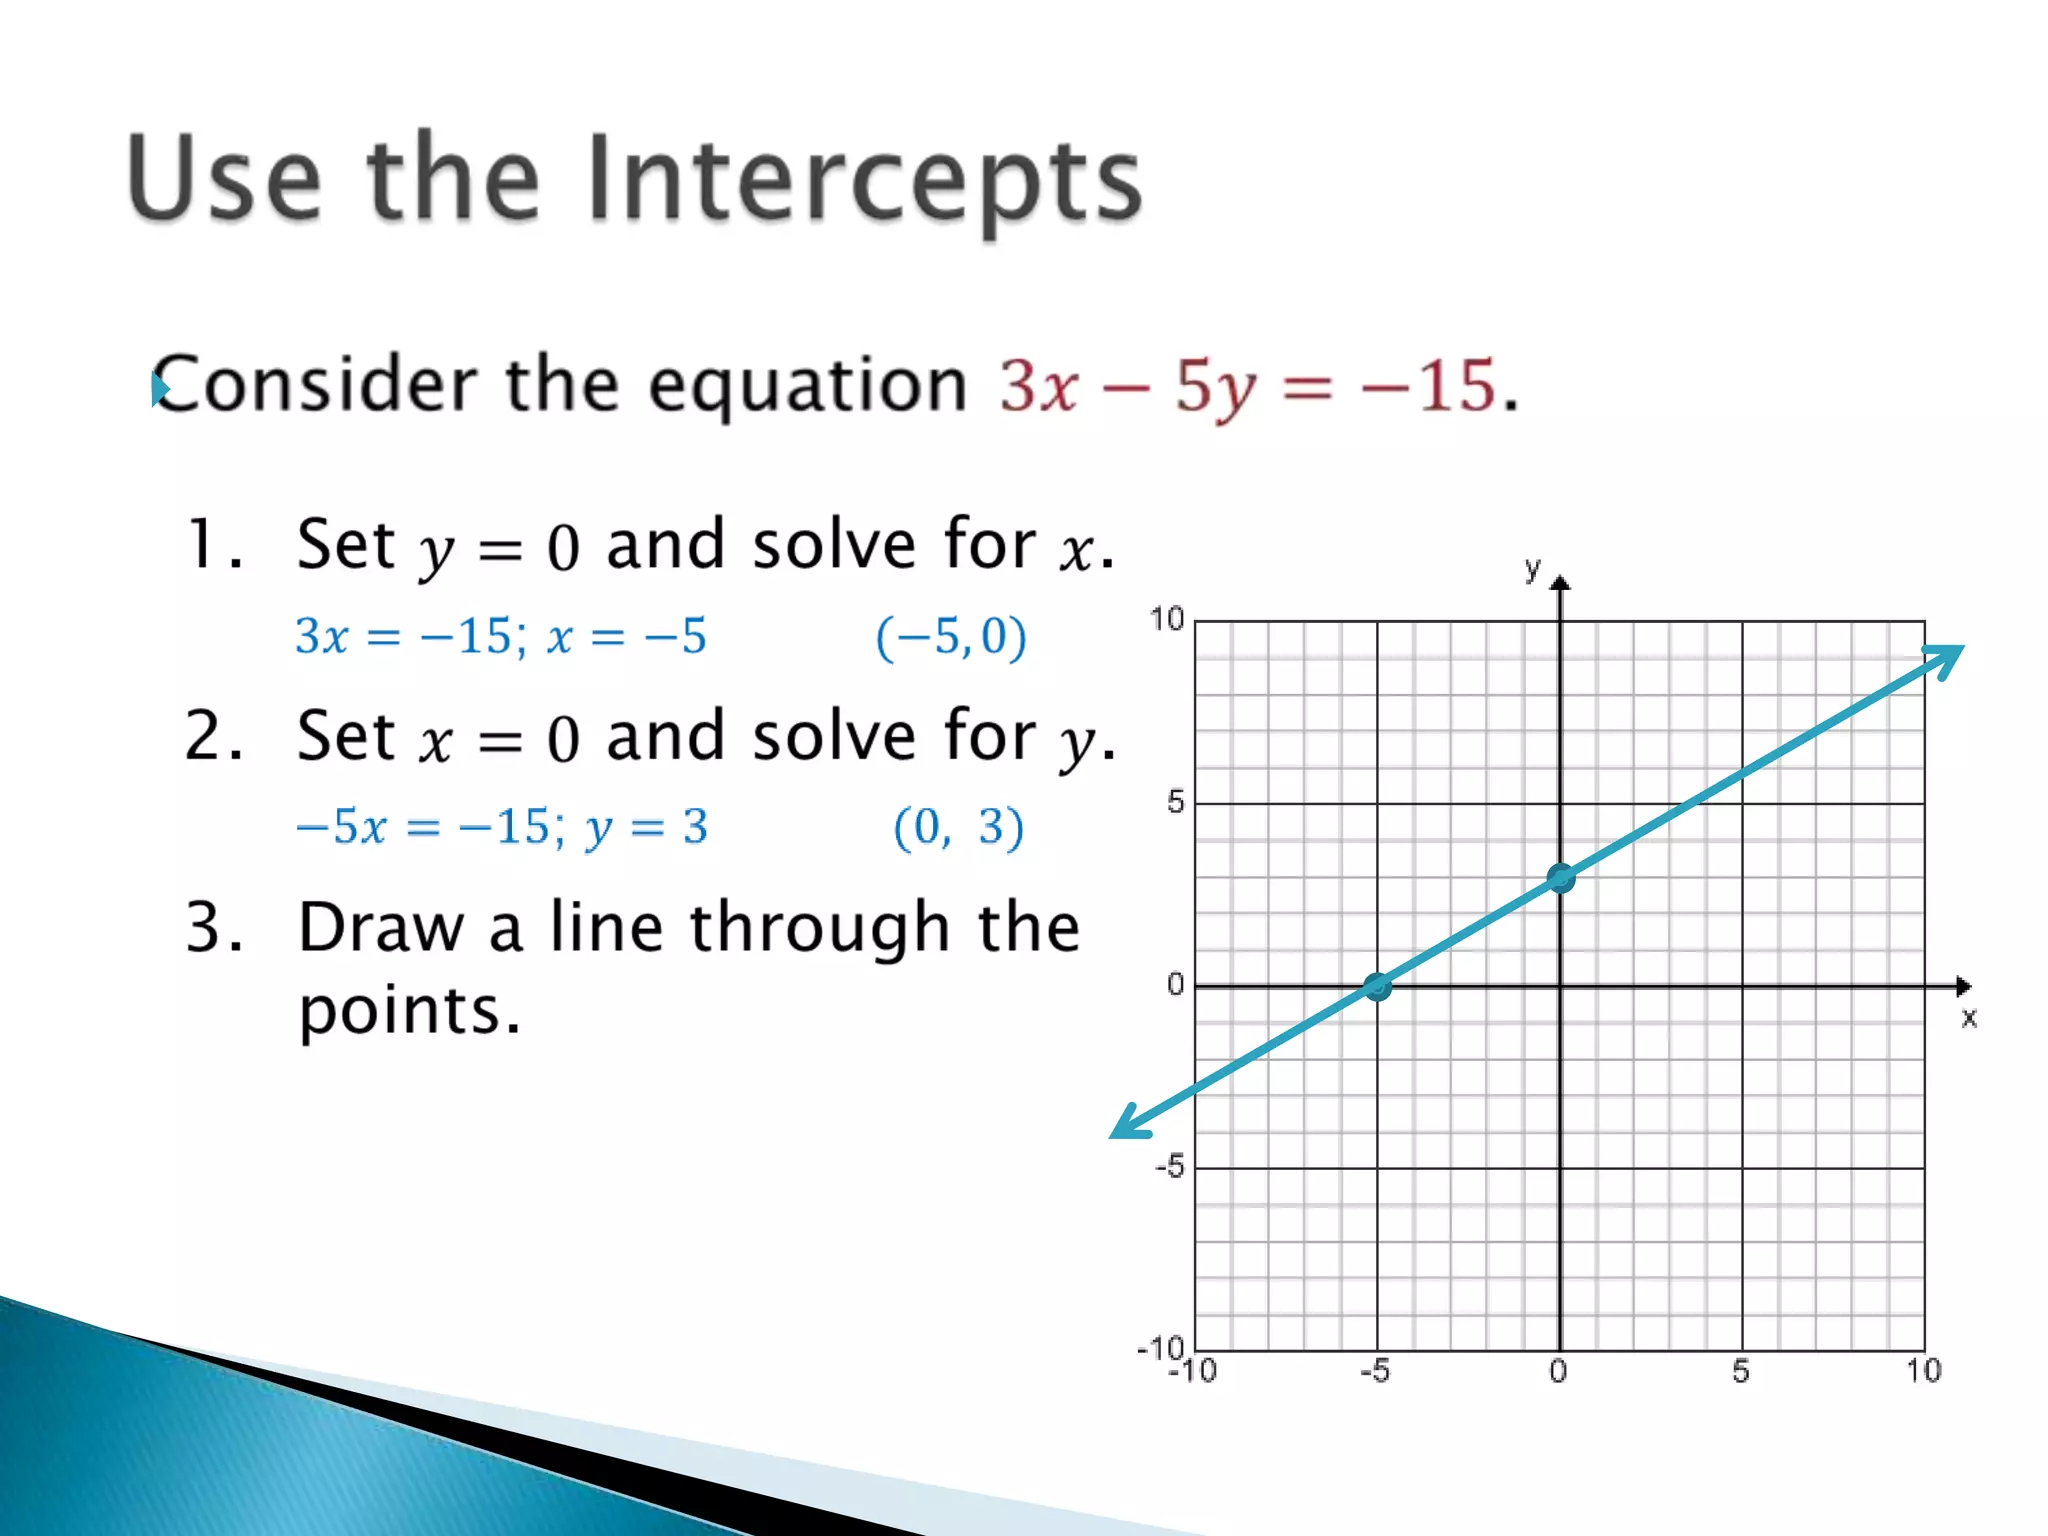

There are three main forms for writing linear equations: slope-intercept form (y=mx+b), point-slope form (y-y1=m(x-x1)), and standard form (Ax + By = C). Each form can be used to graph the line by finding ordered pairs that satisfy the equation and plotting those points. For slope-intercept form, a table of x-values with their corresponding y-values is made to find the points. For point-slope form and standard form, the given point and slope or intercepts are used to find another point which are then plotted and connected with a line.


![Introduction_to_Linear_Equation[1].pdf Algebra 1](https://cdn.slidesharecdn.com/ss_thumbnails/introductiontolinearequation1-241214102404-e9b93535-thumbnail.jpg?width=640&height=640&fit=bounds)


