Download to read offline

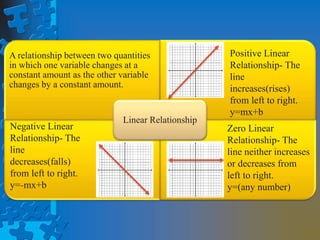


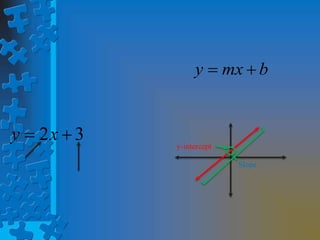


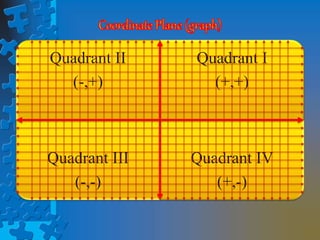
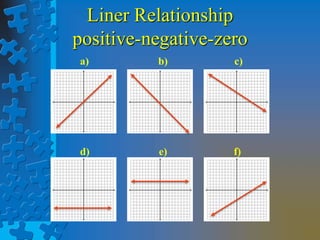
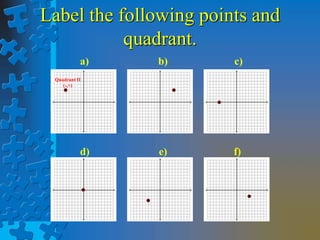

Linear equations describe relationships where one variable changes at a constant rate as the other changes. There are three types of linear relationships: positive, where the line increases from left to right; negative, where the line decreases; and zero, where the line is flat. Key aspects of linear equations include the slope, which measures the rate of change; the y-intercept, which is the point where the line crosses the y-axis; and the x and y axes which form the coordinate plane with four quadrants used to locate points.