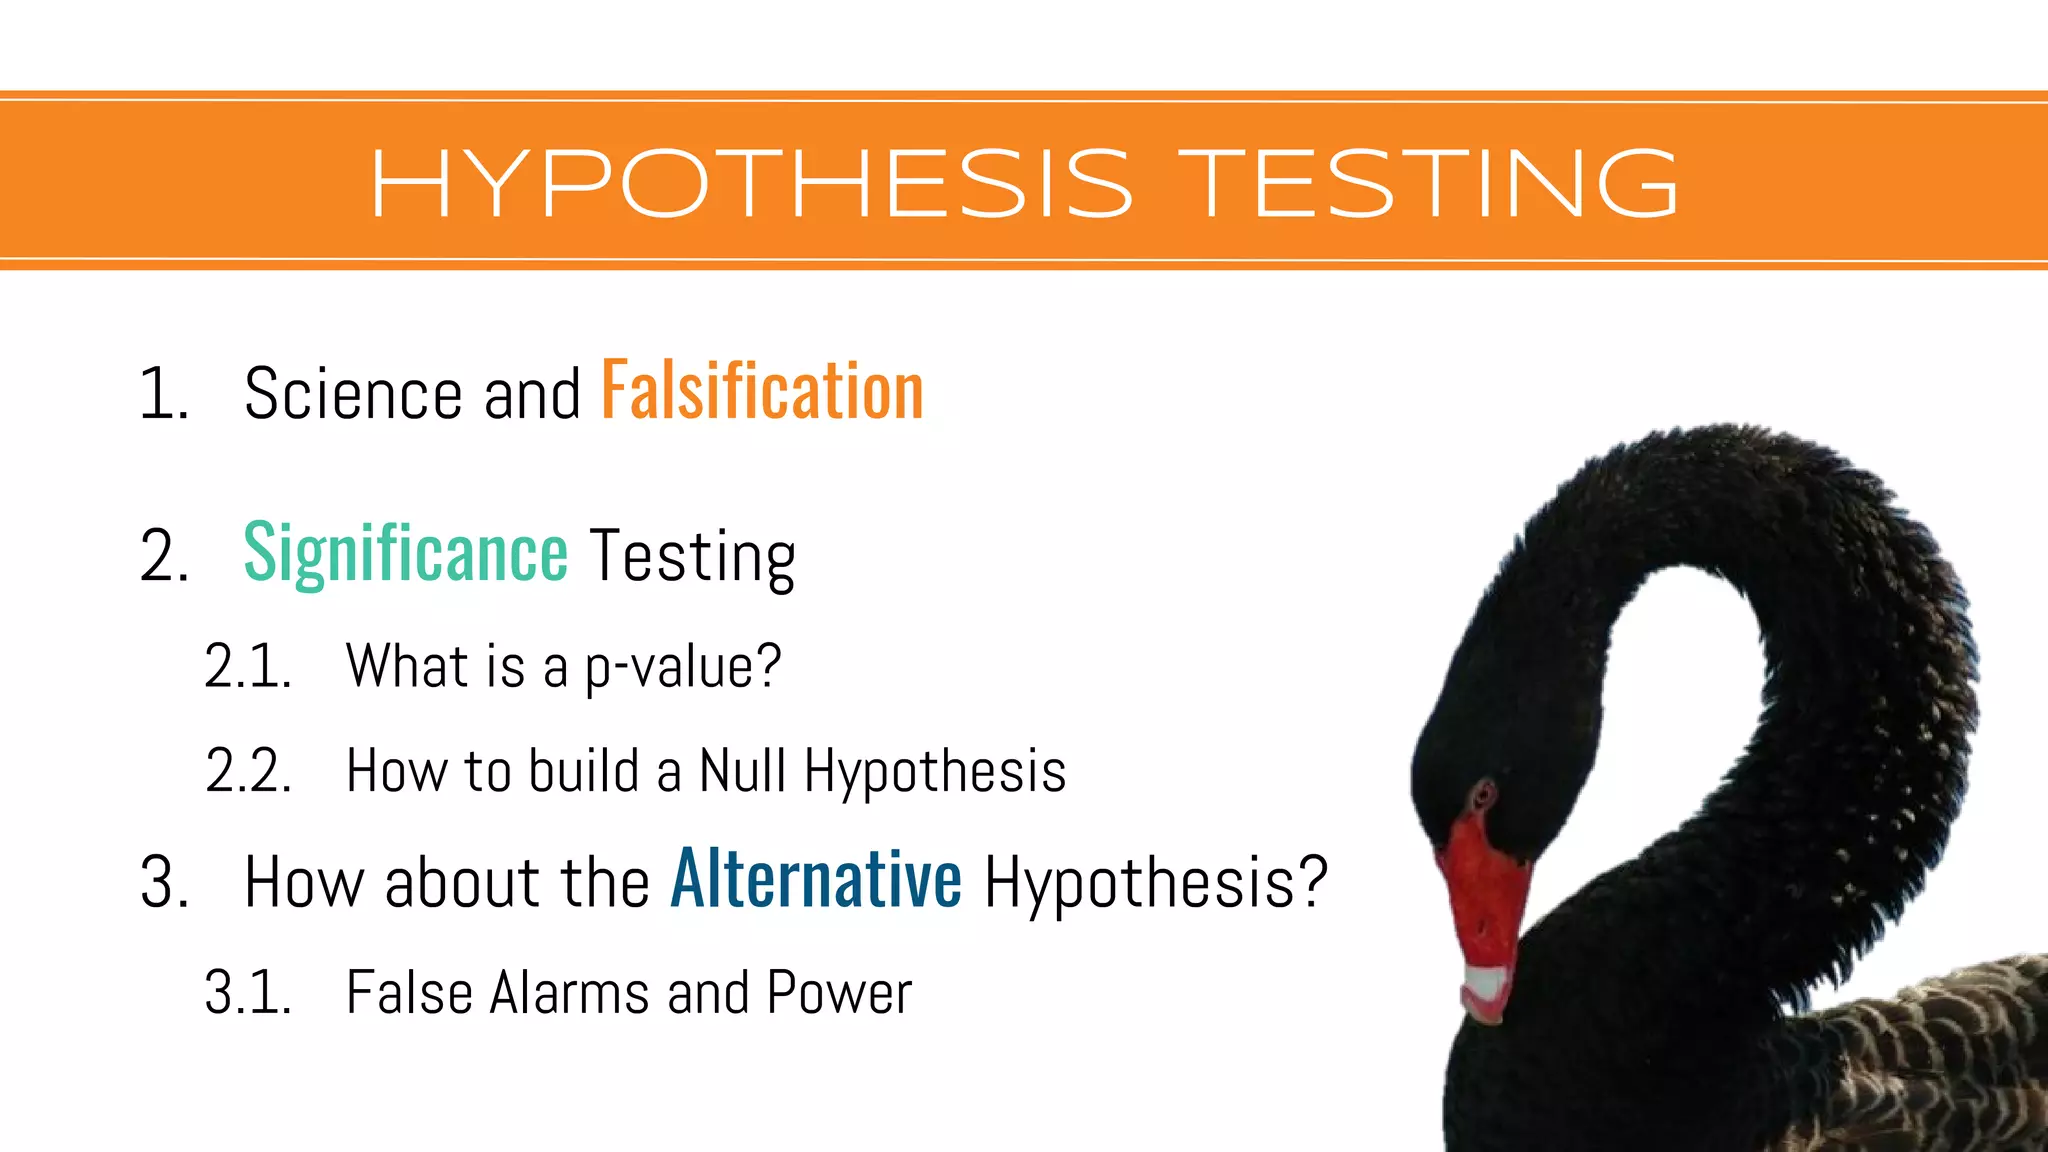
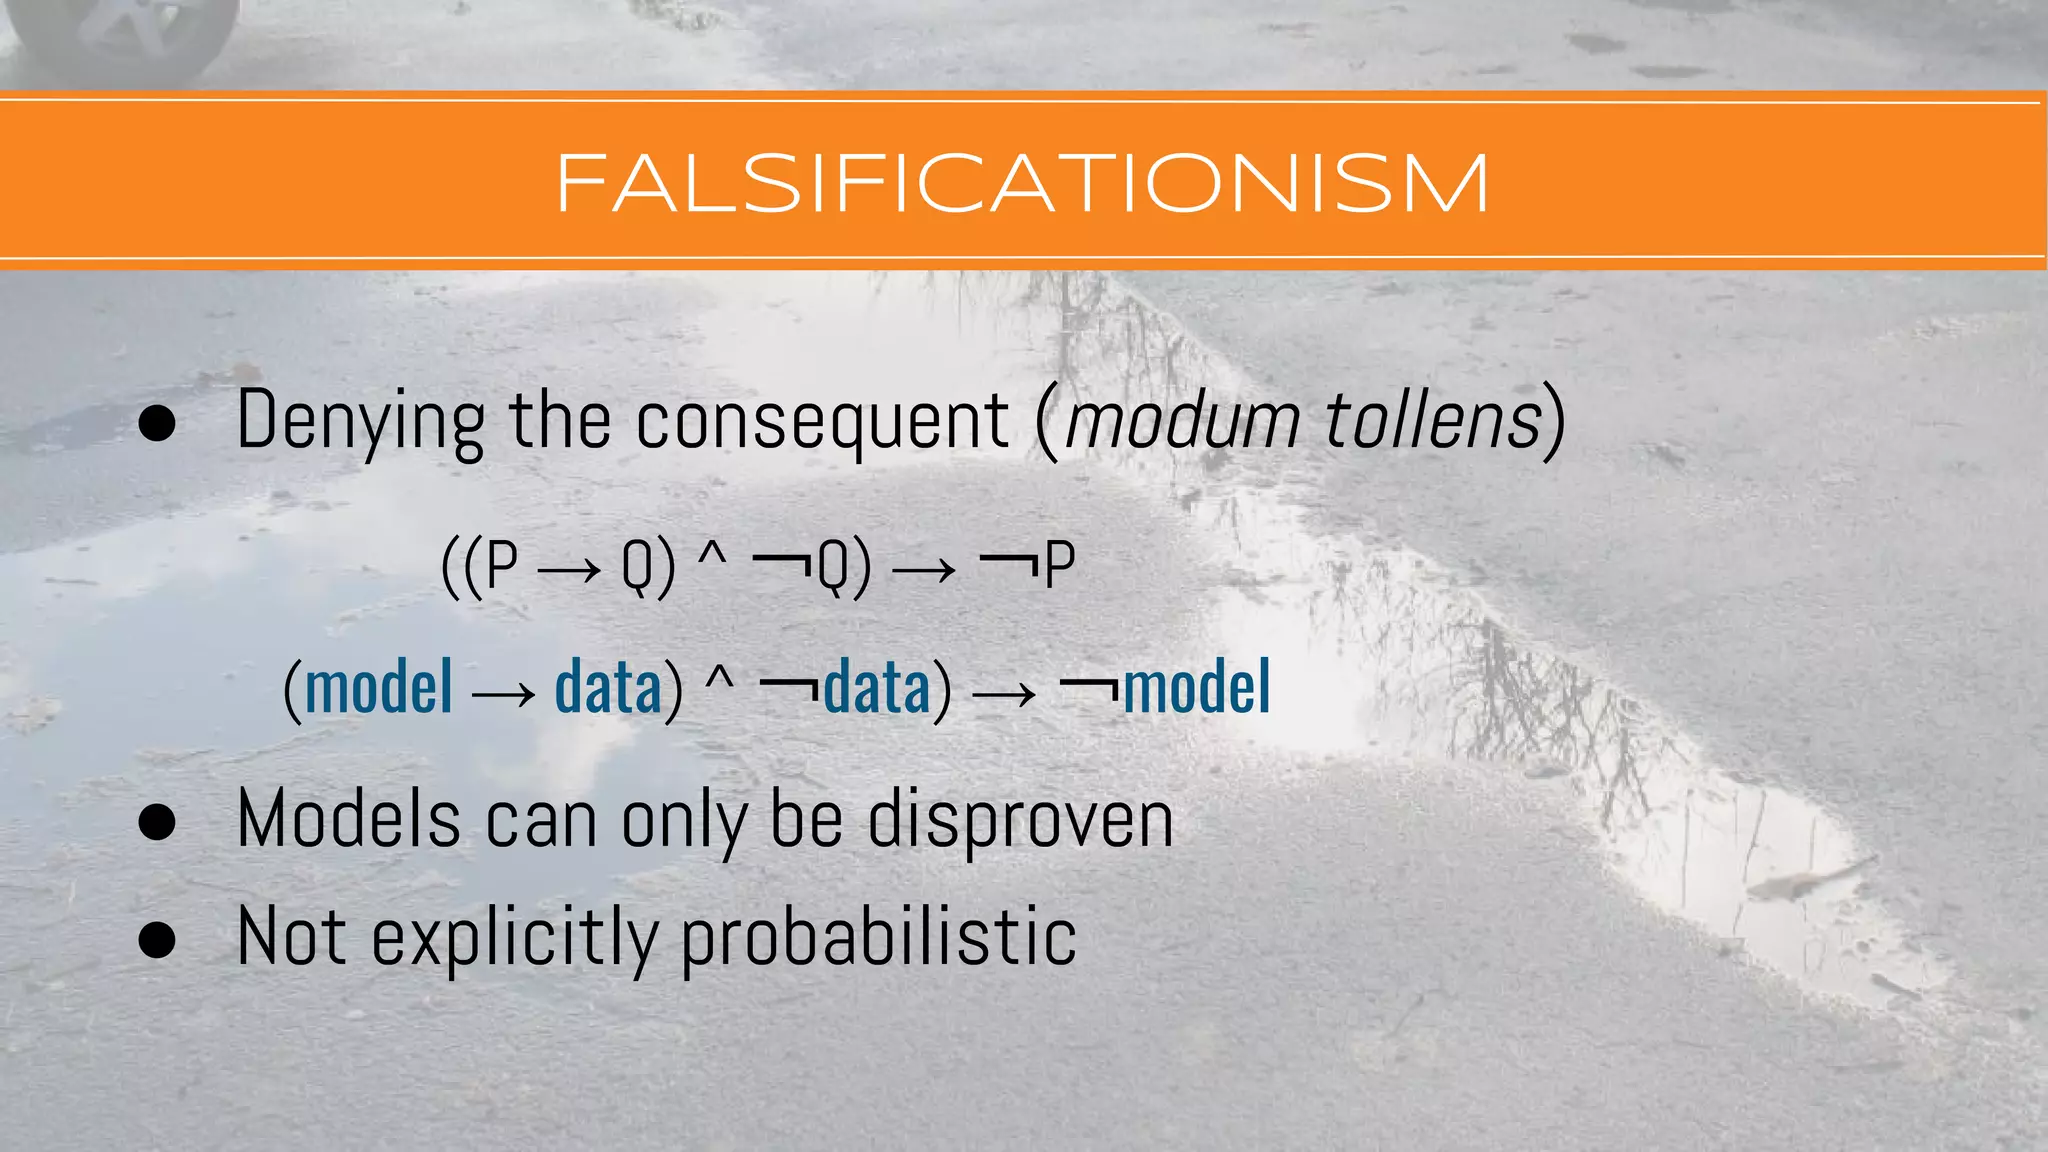
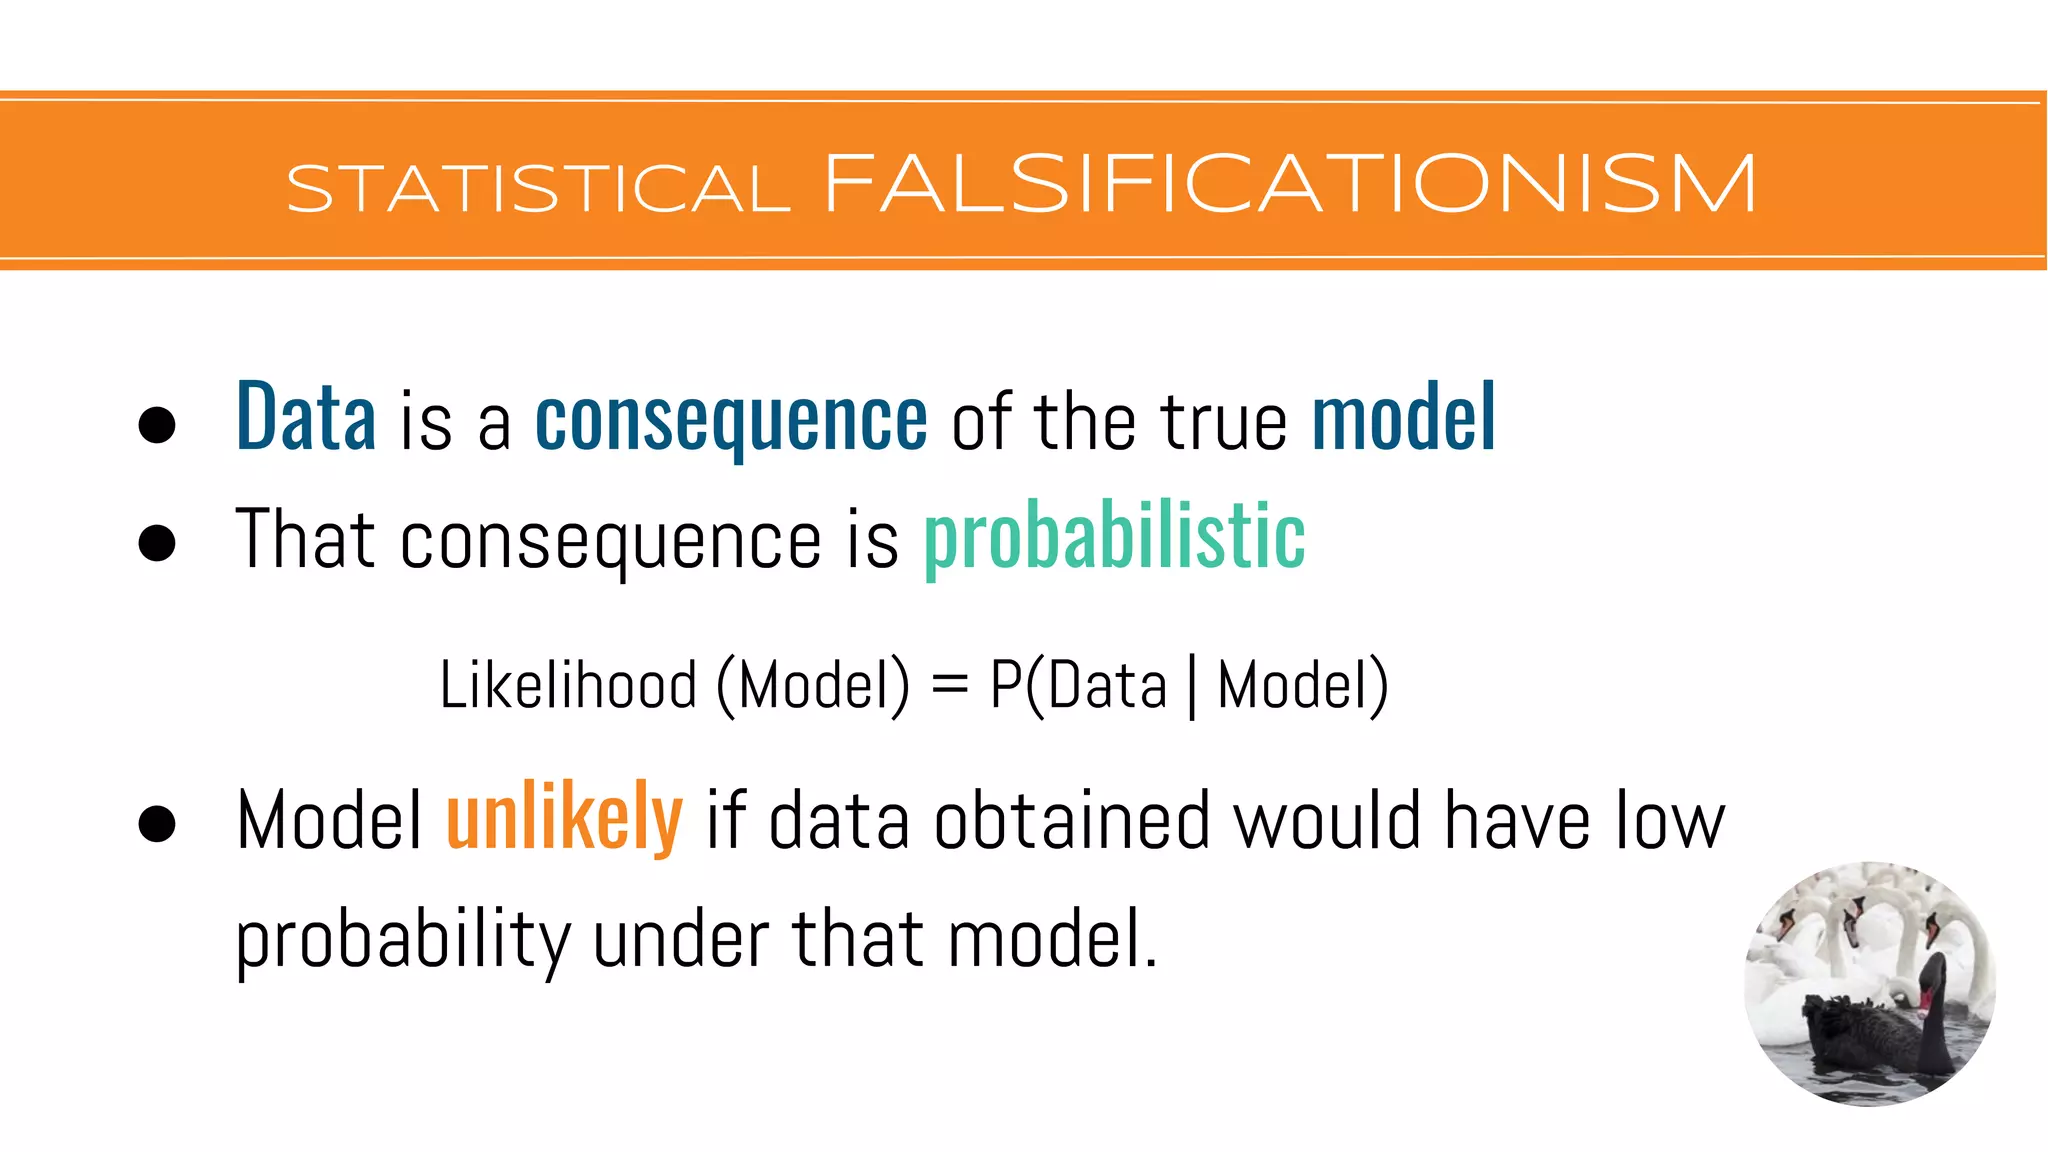
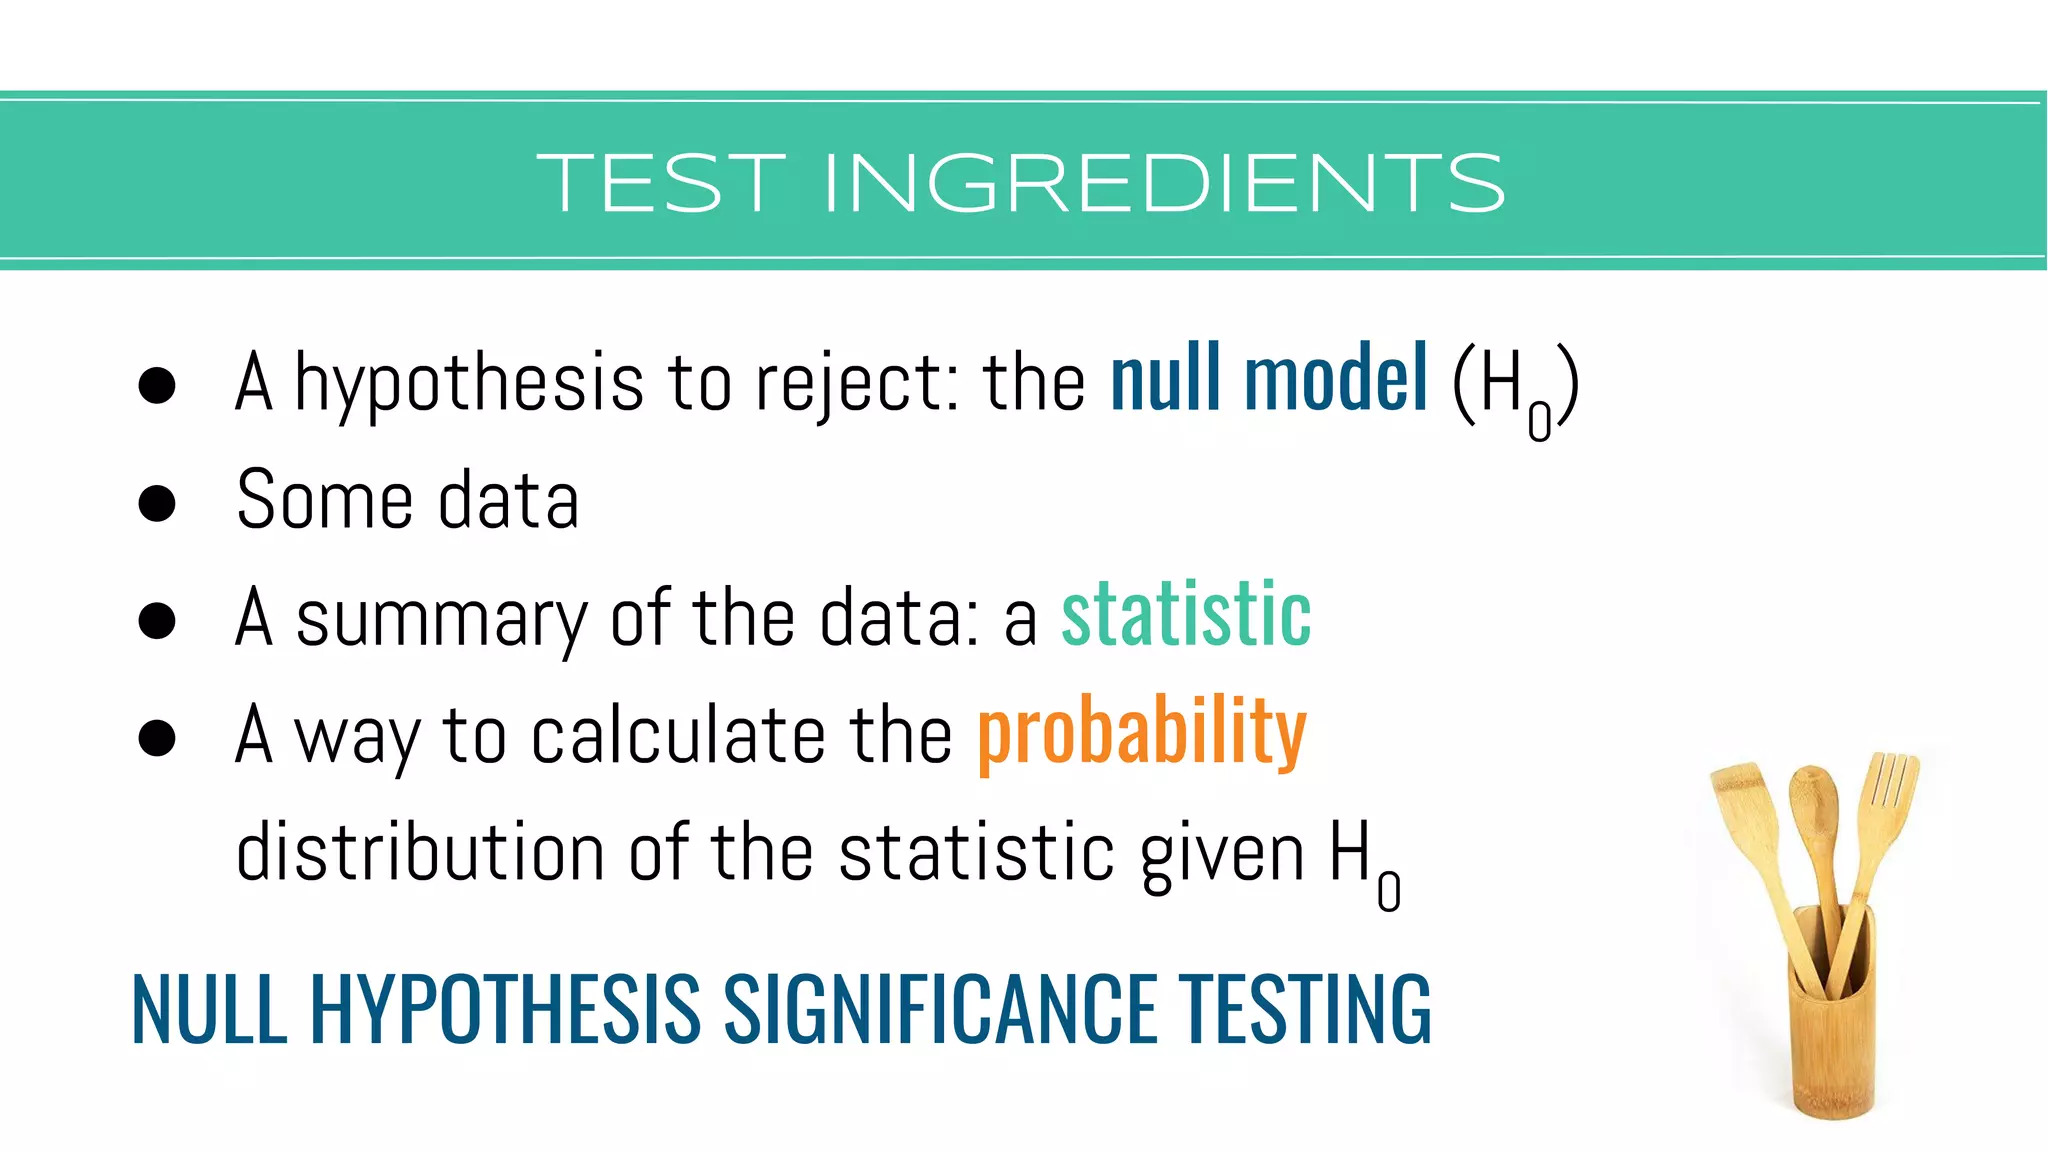
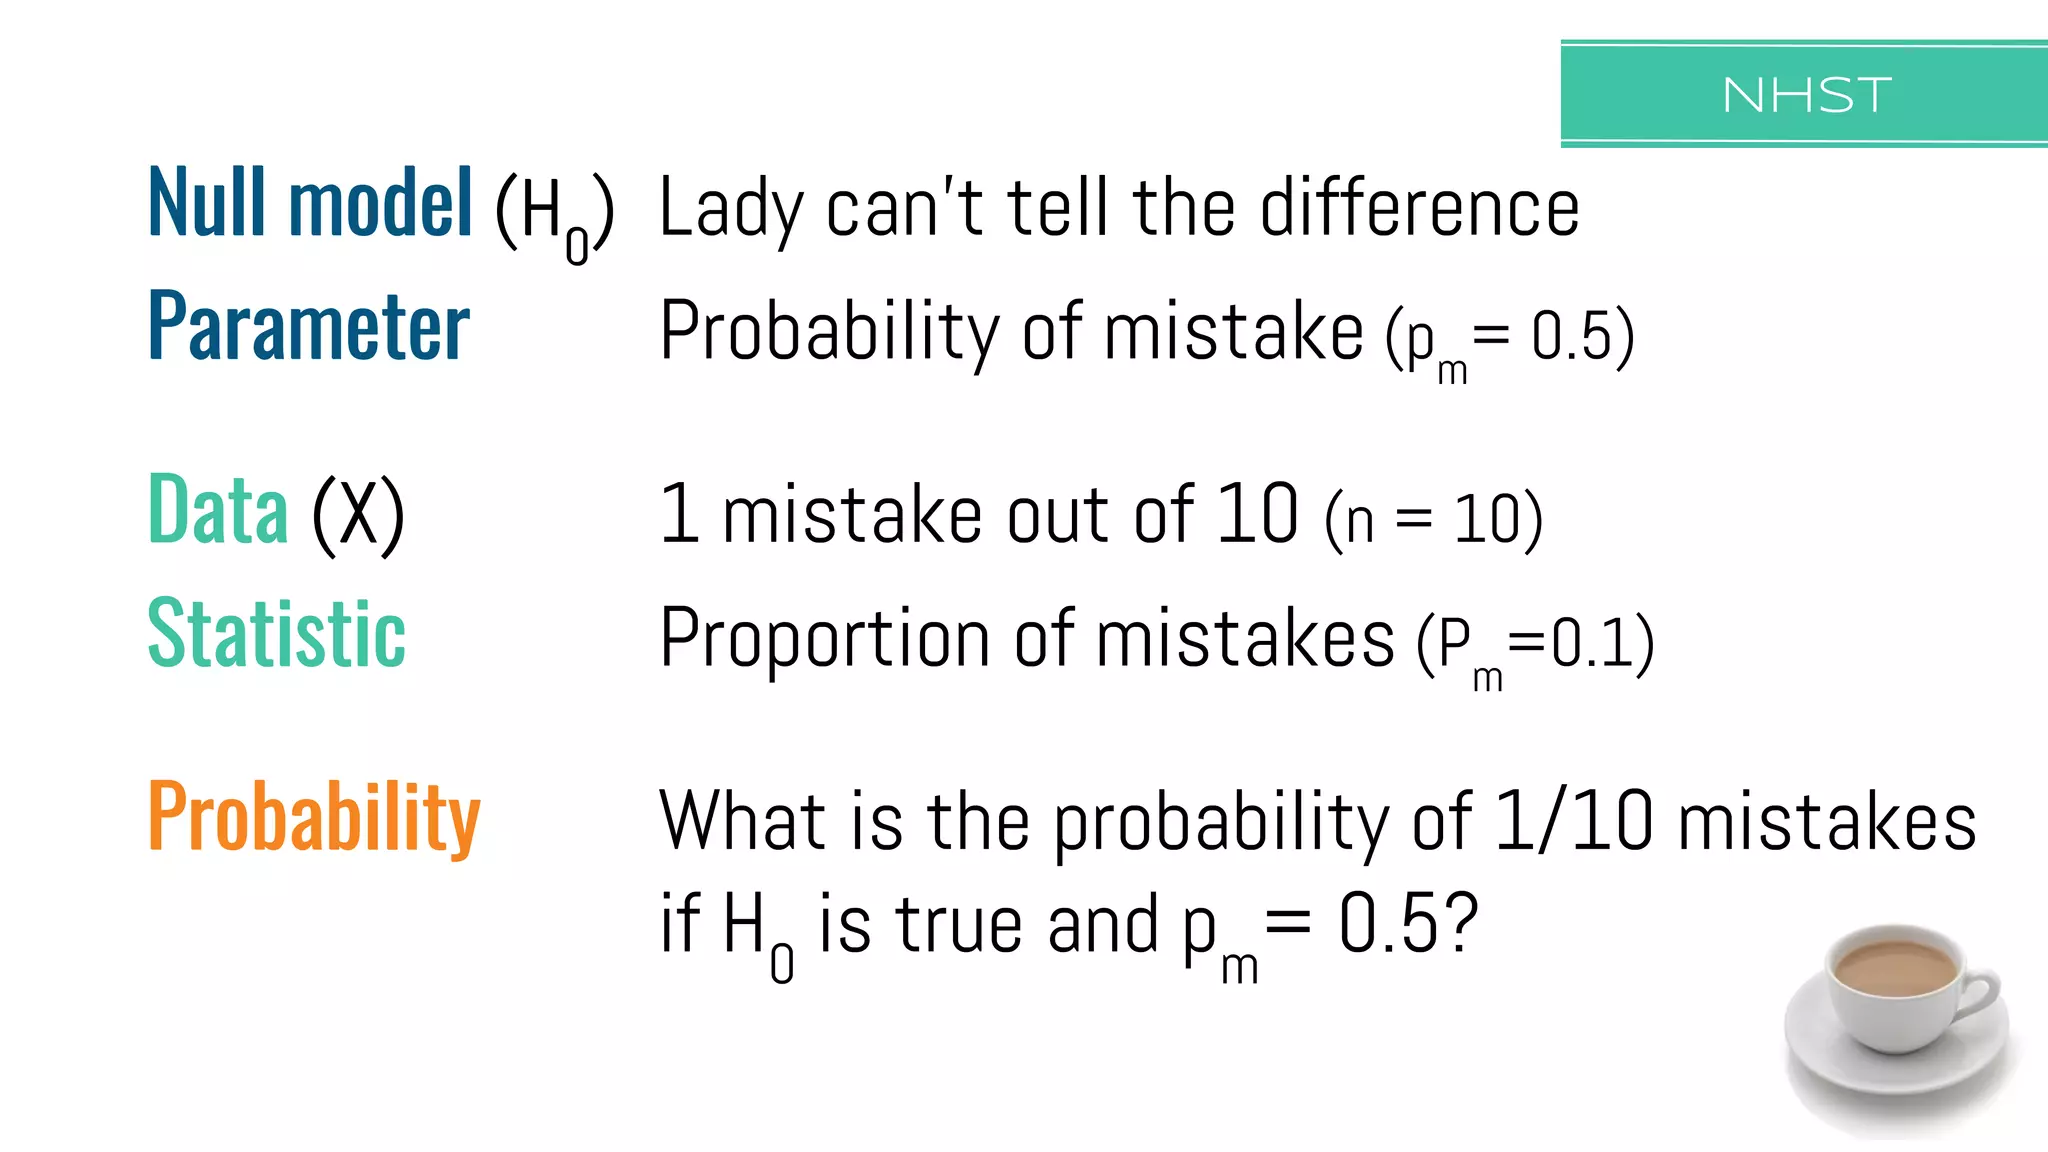
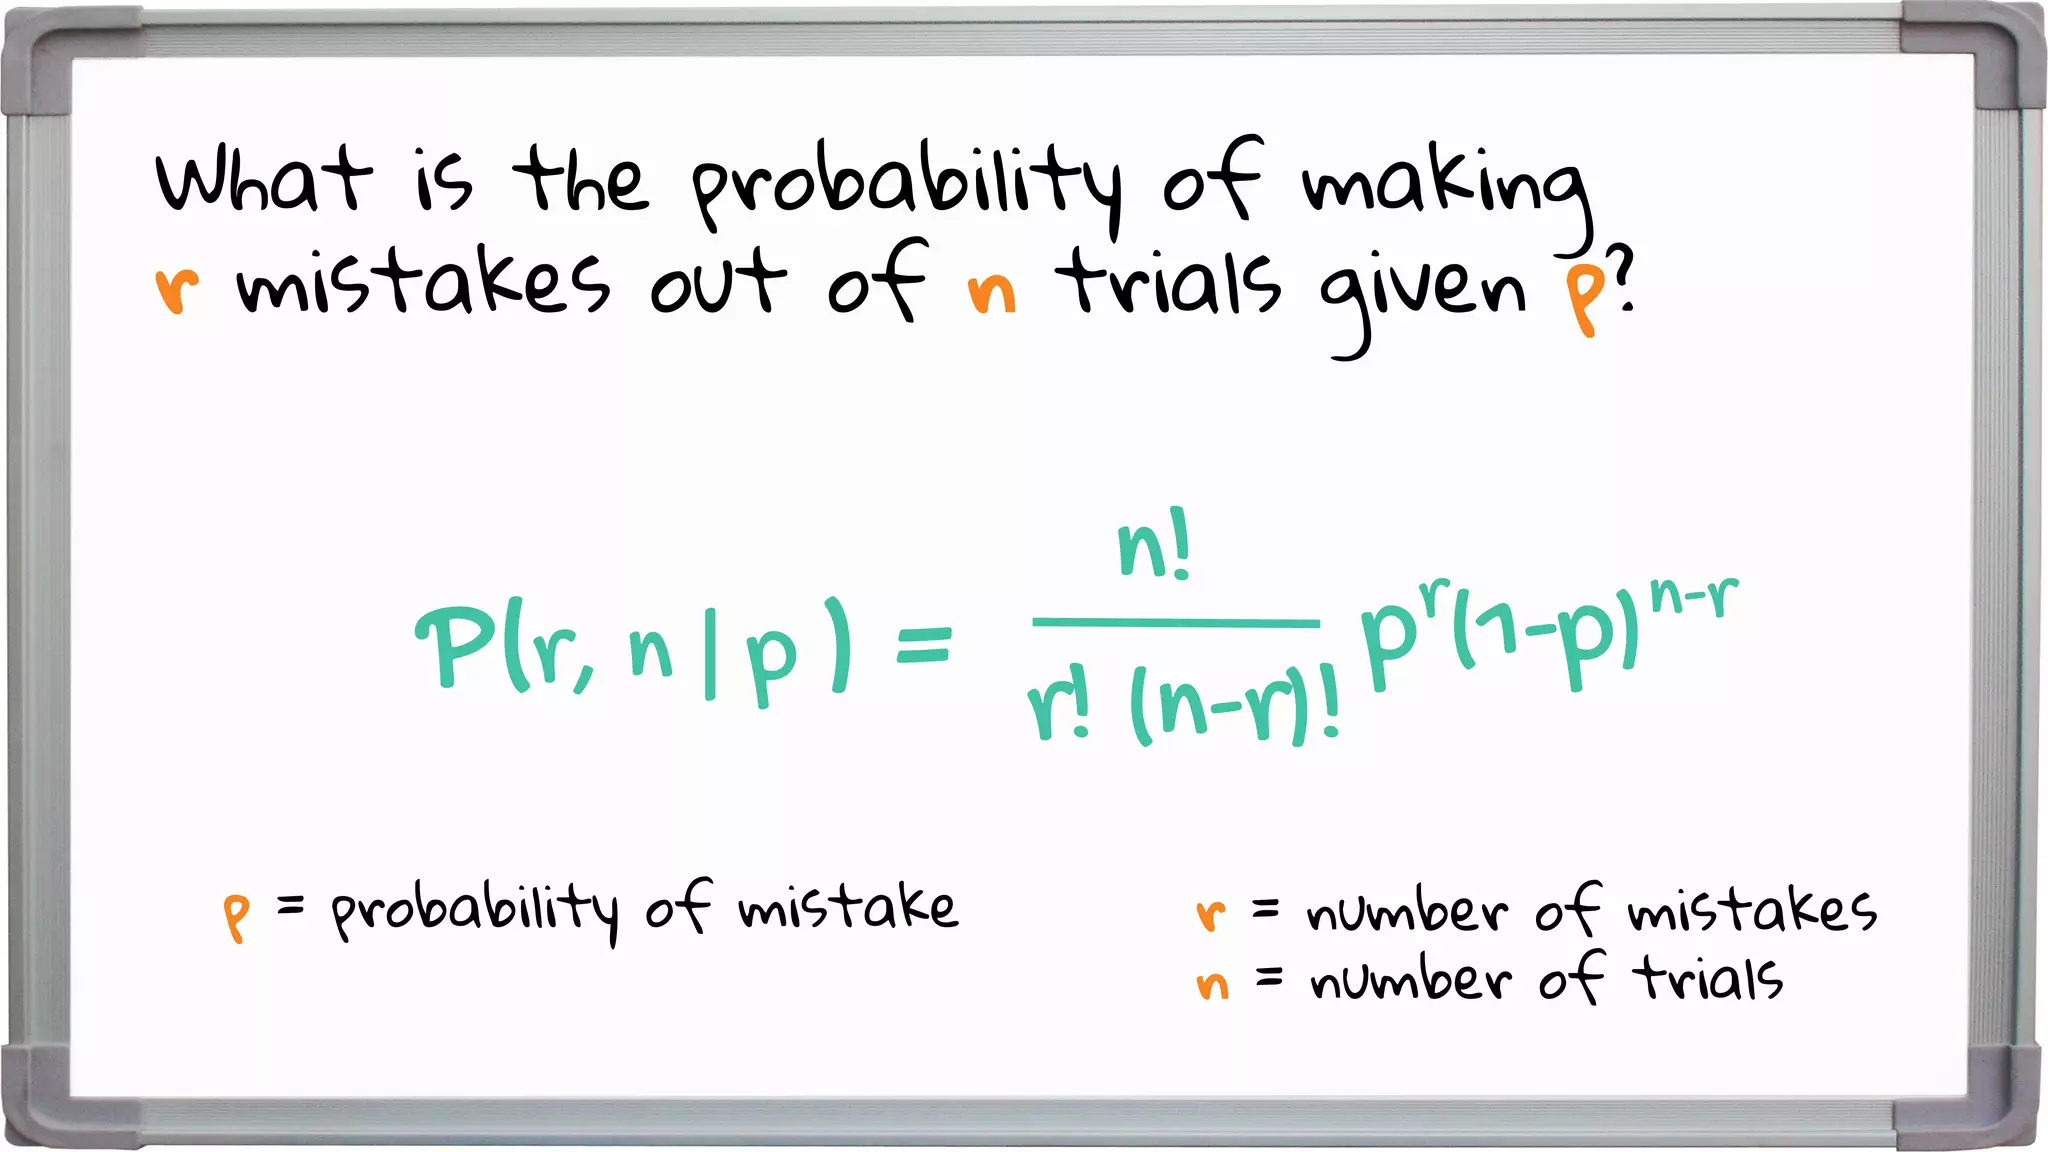
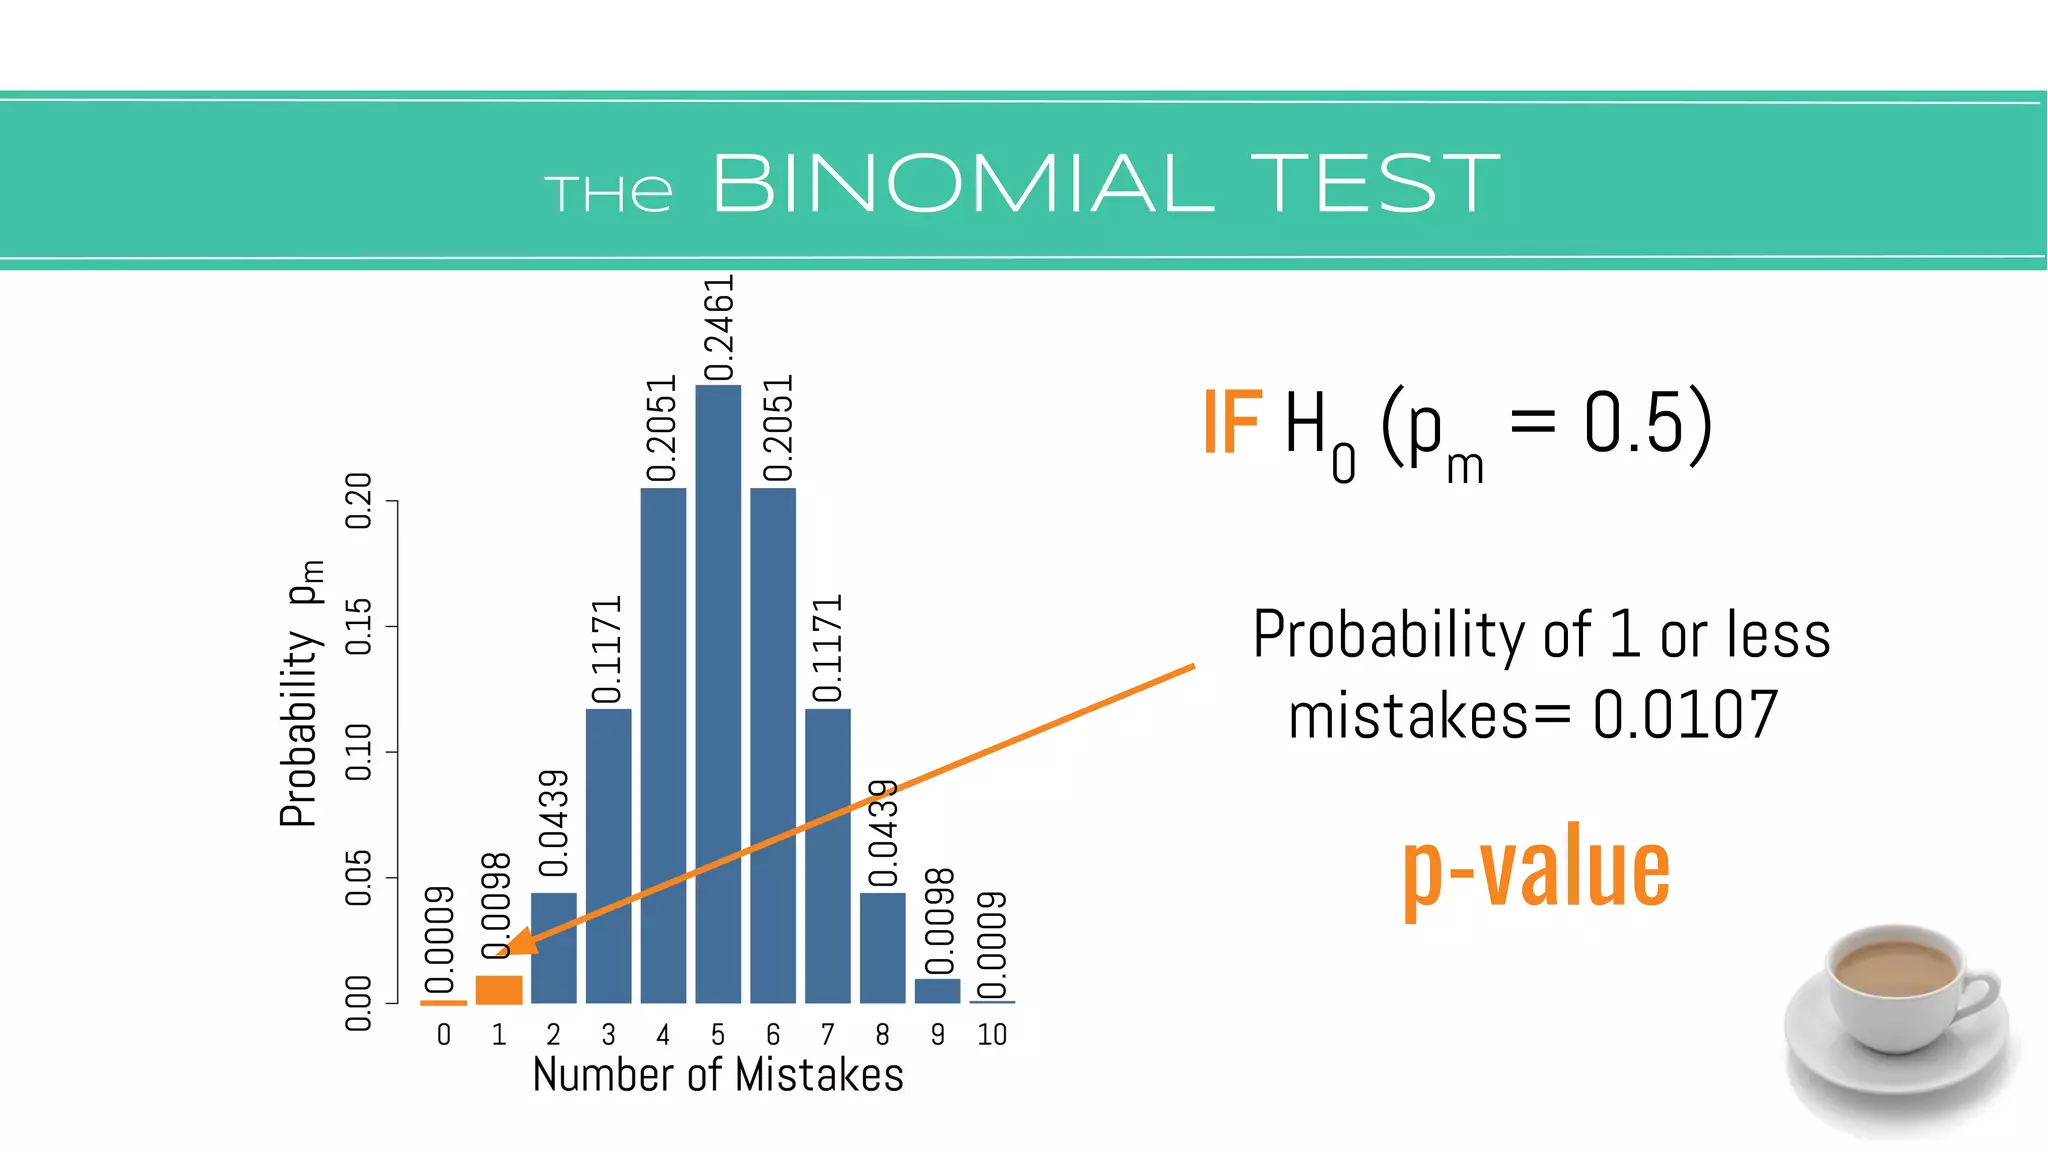
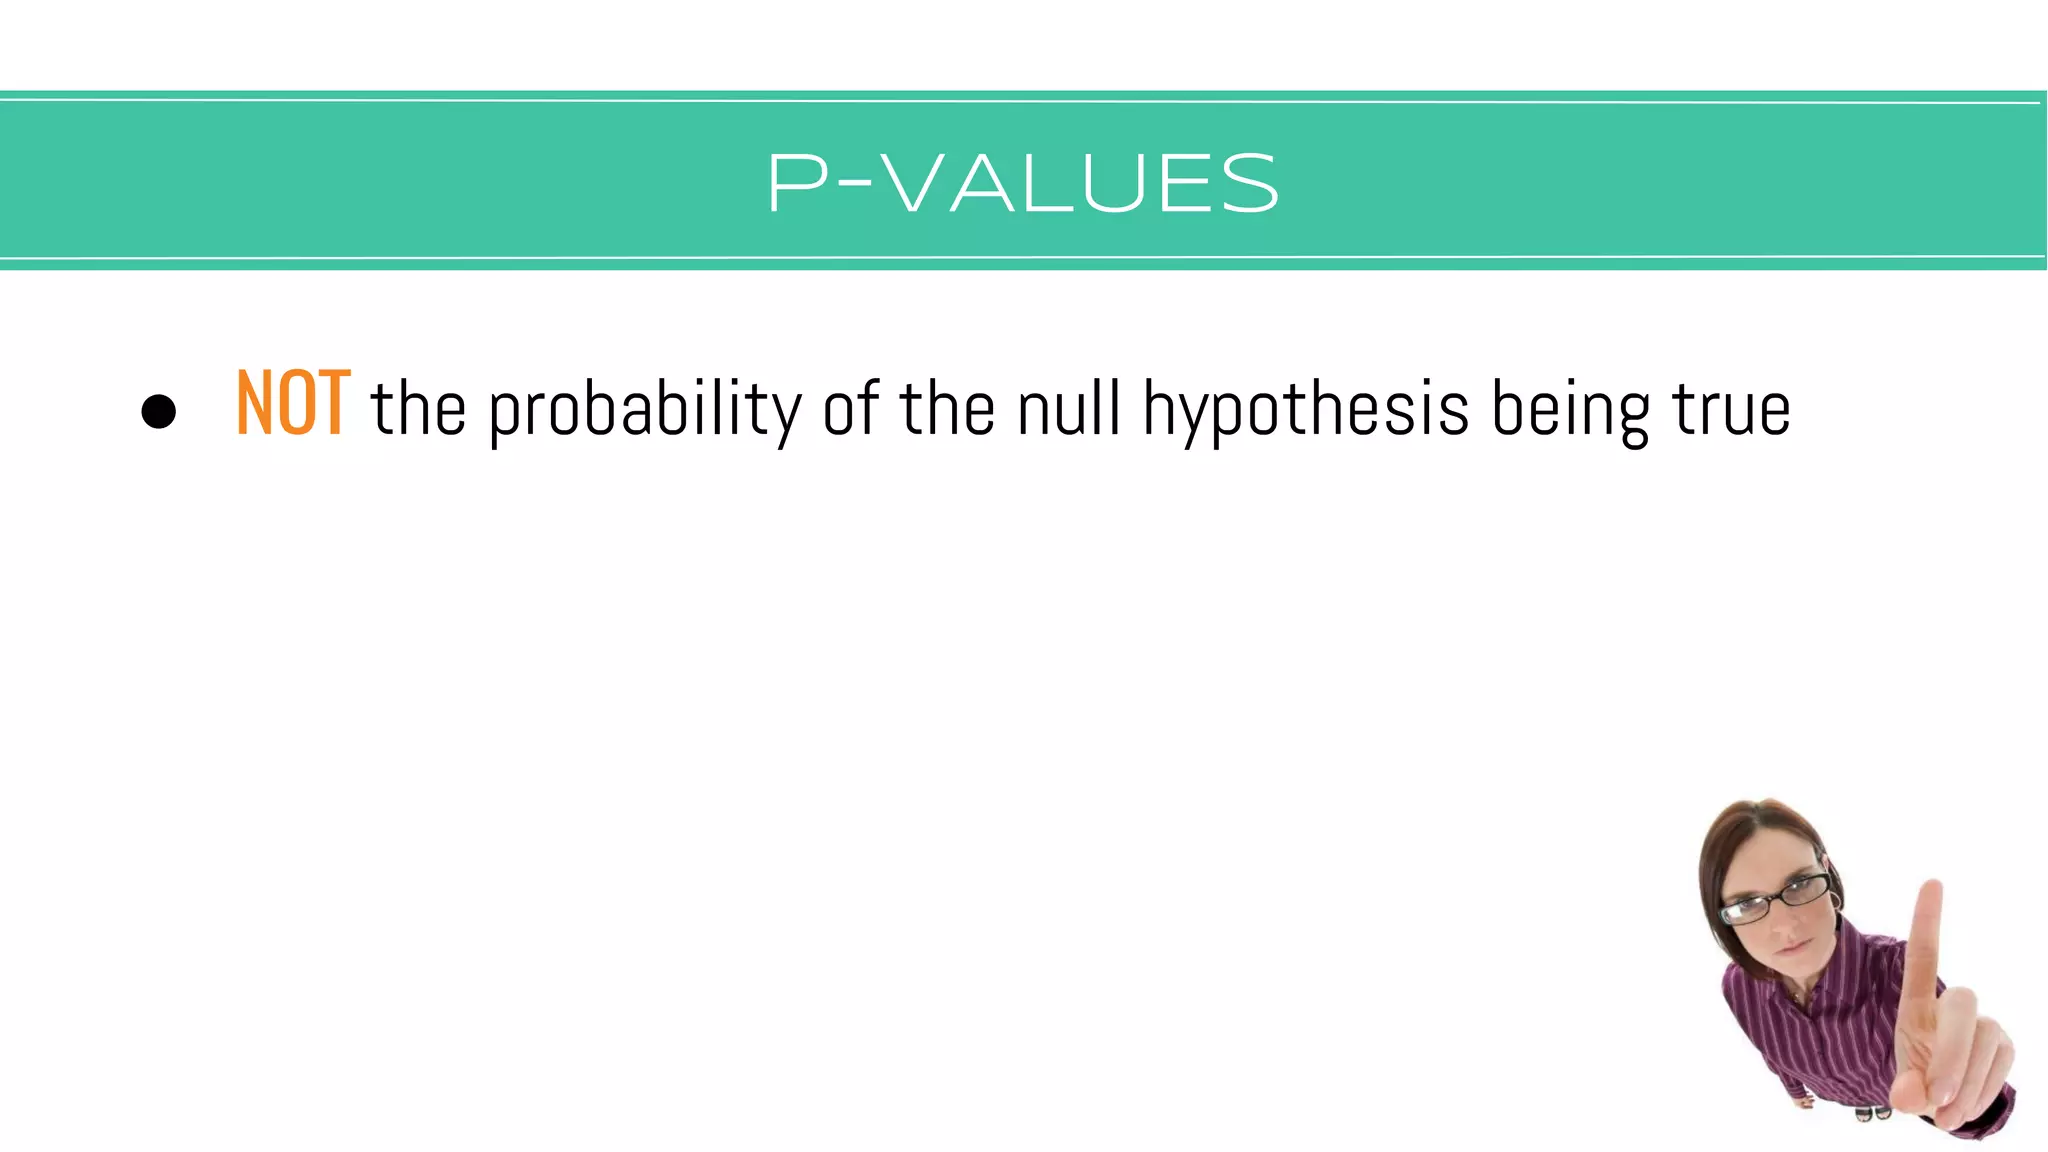
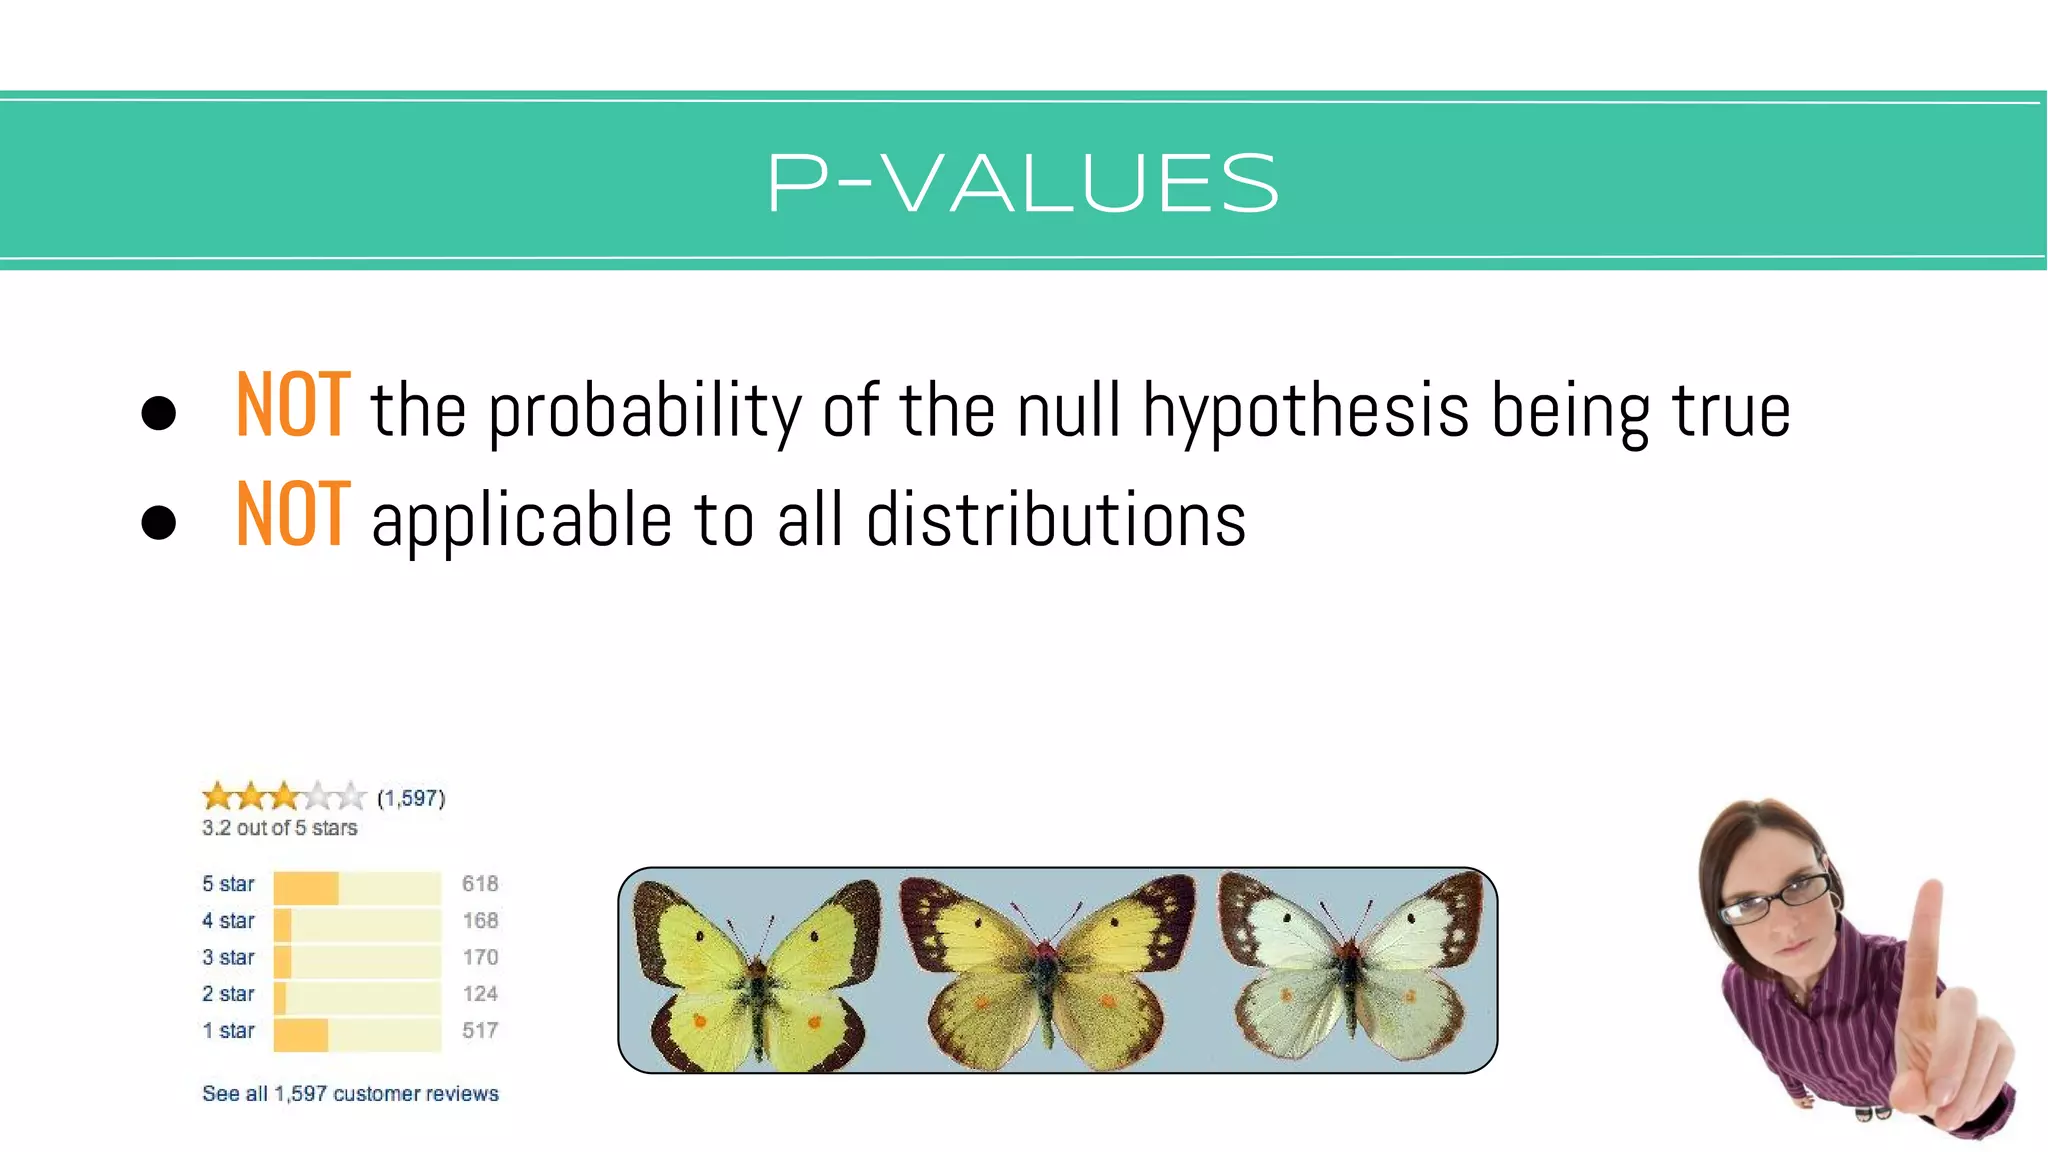
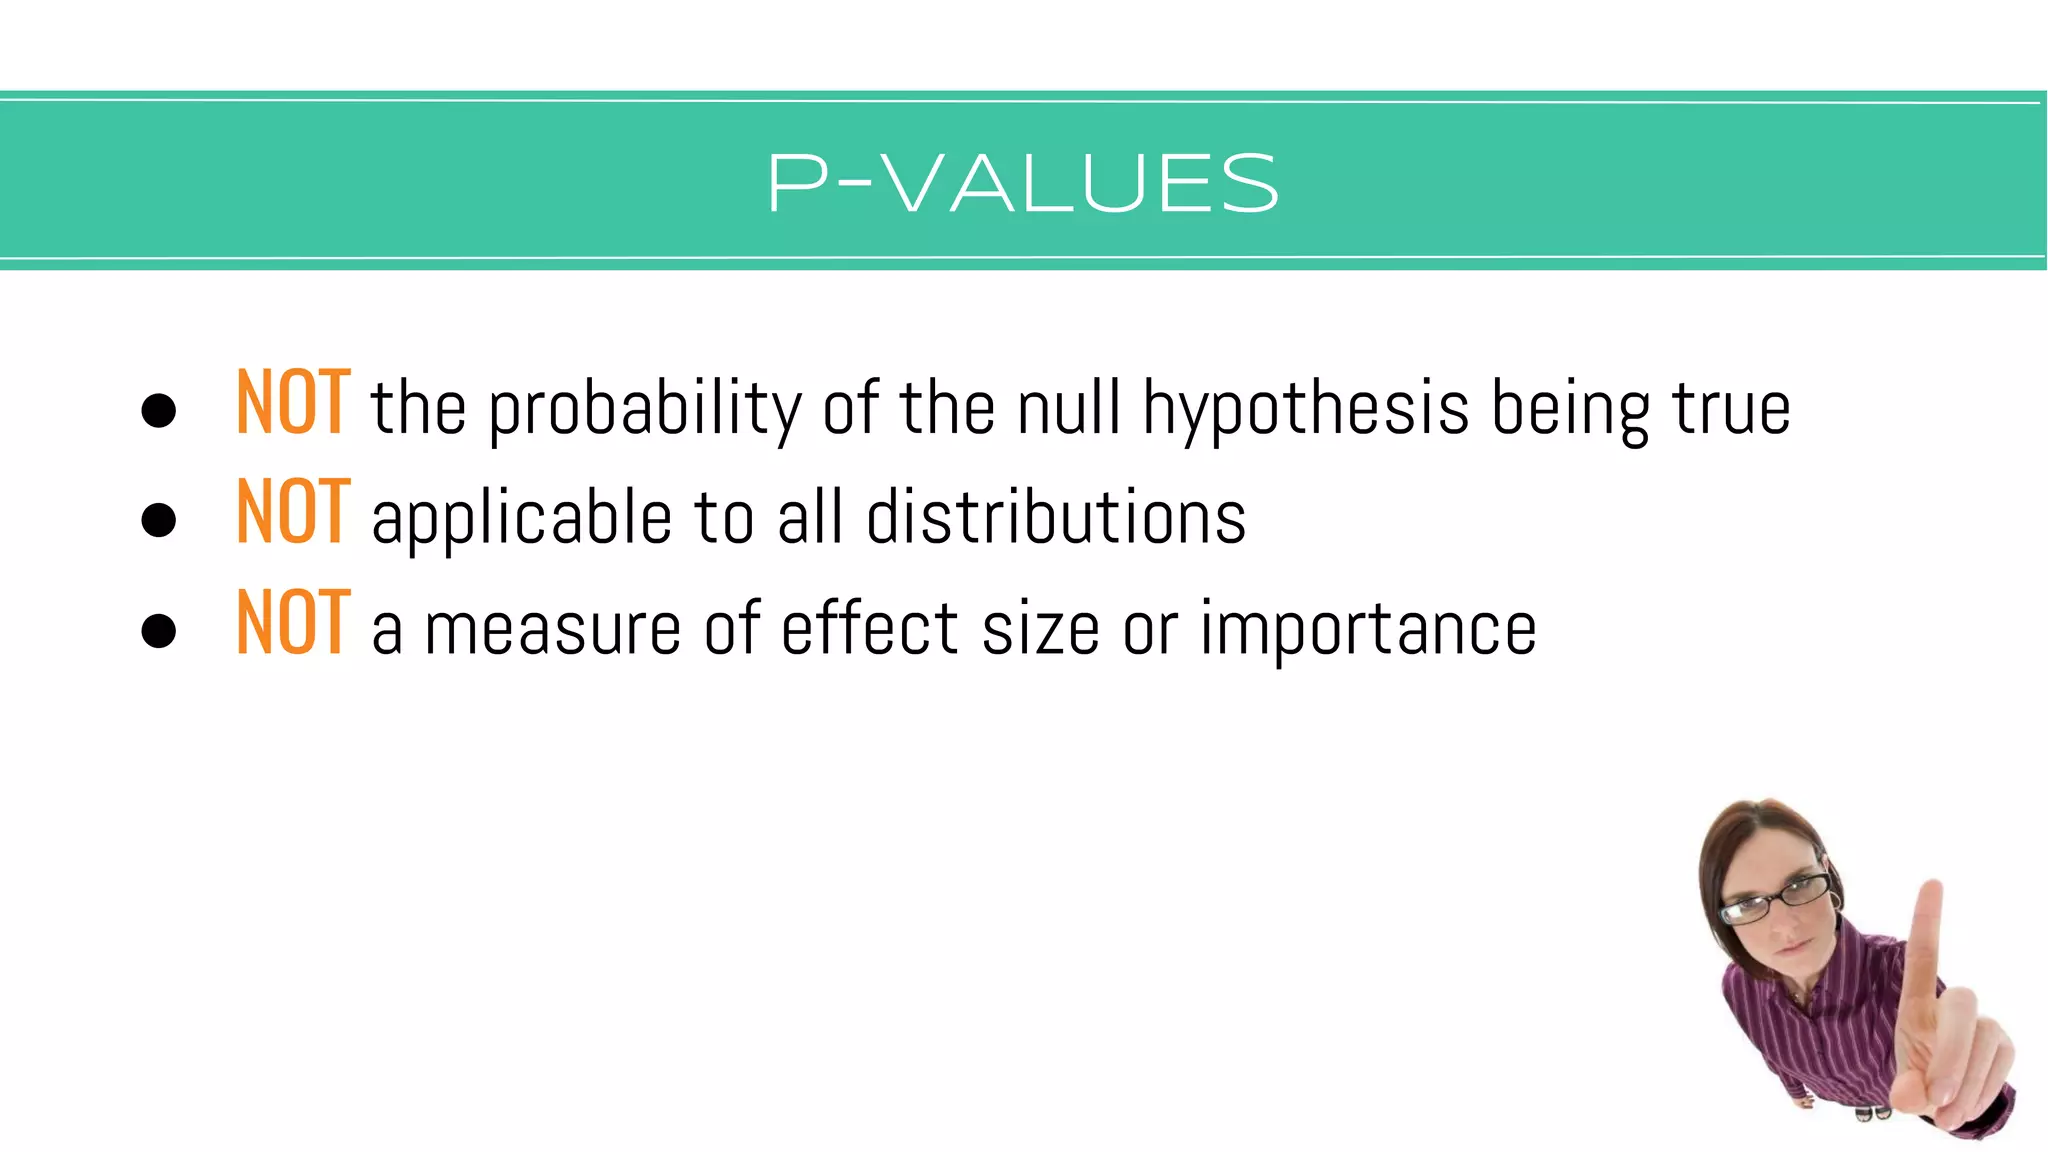
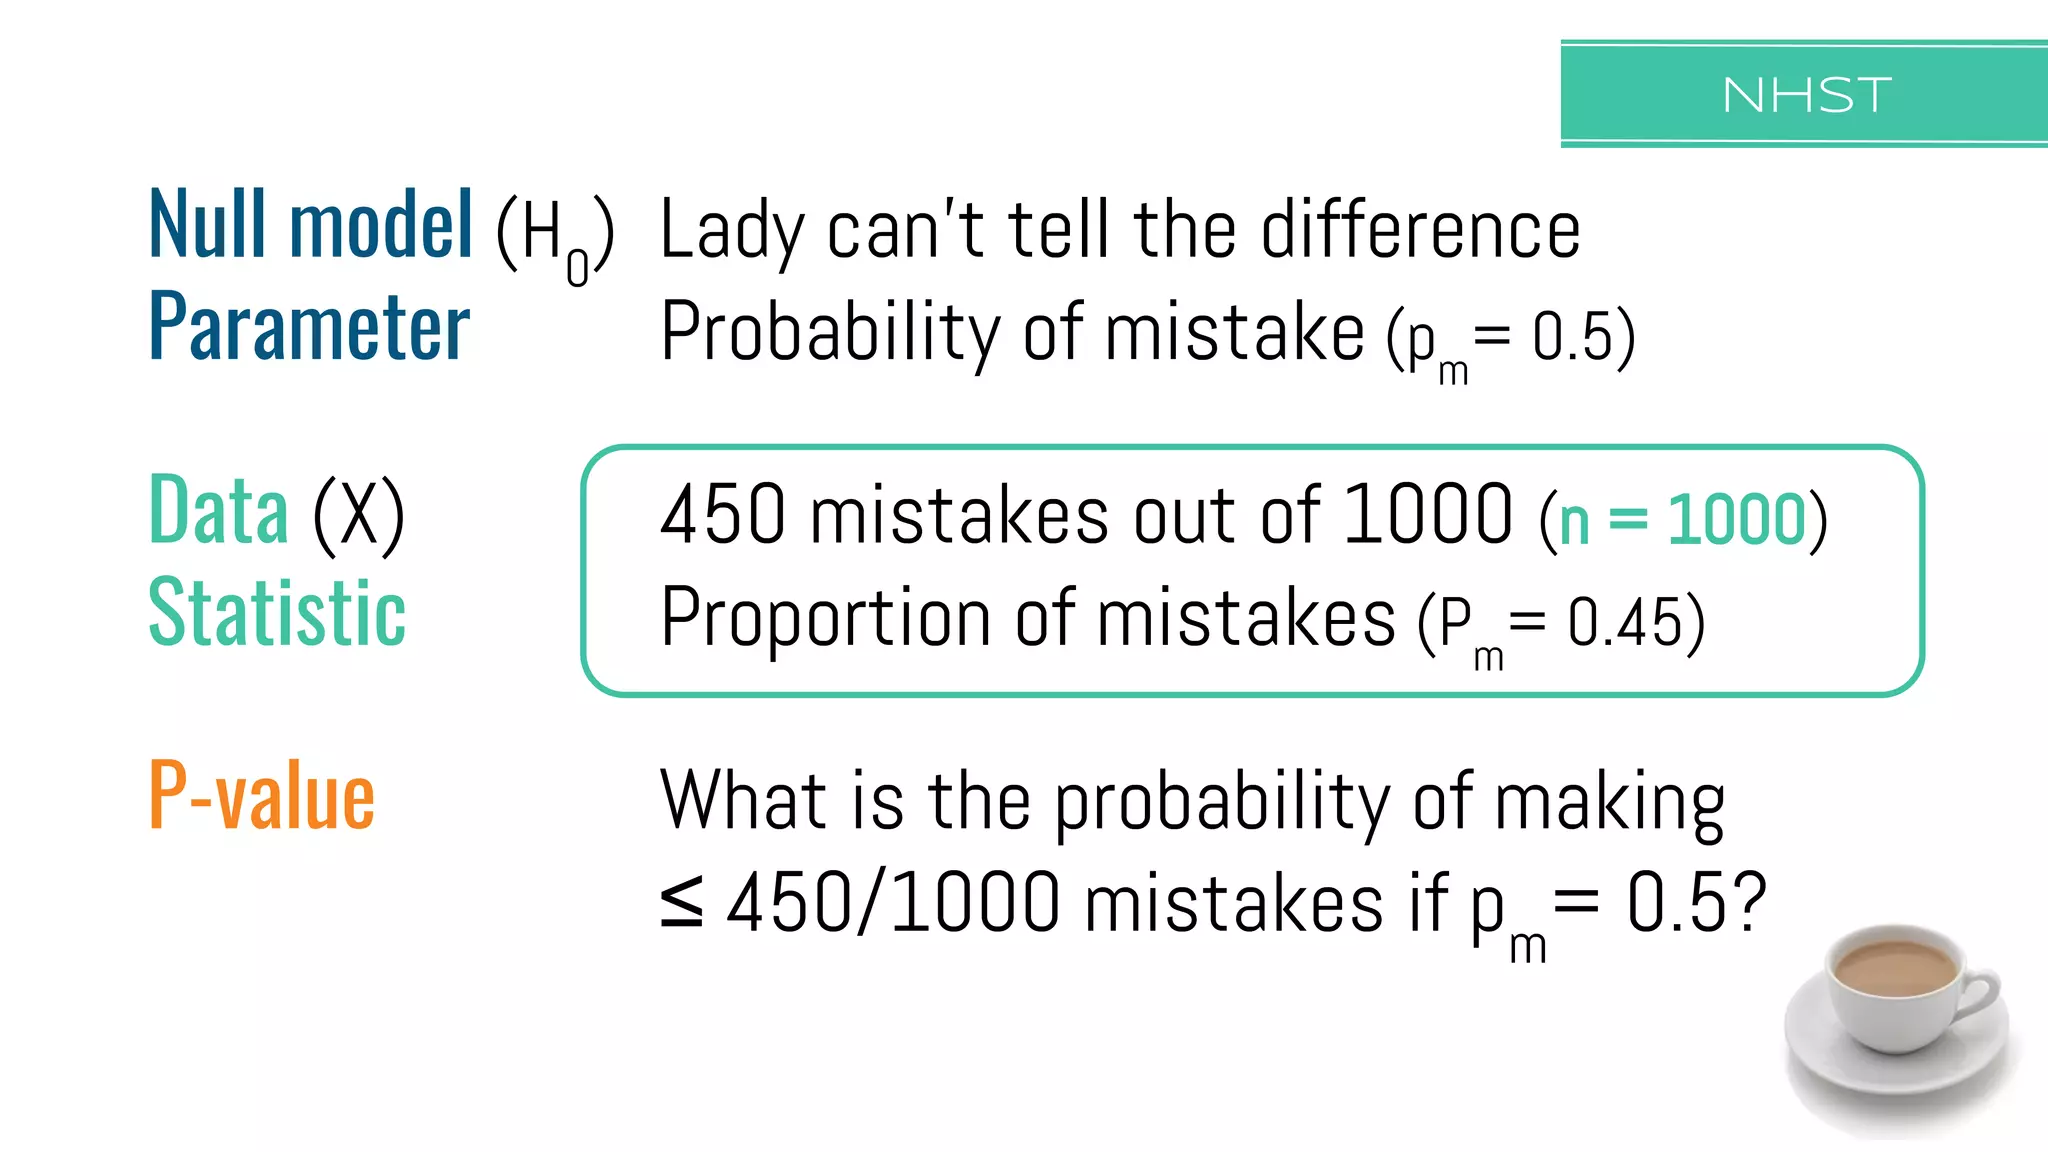
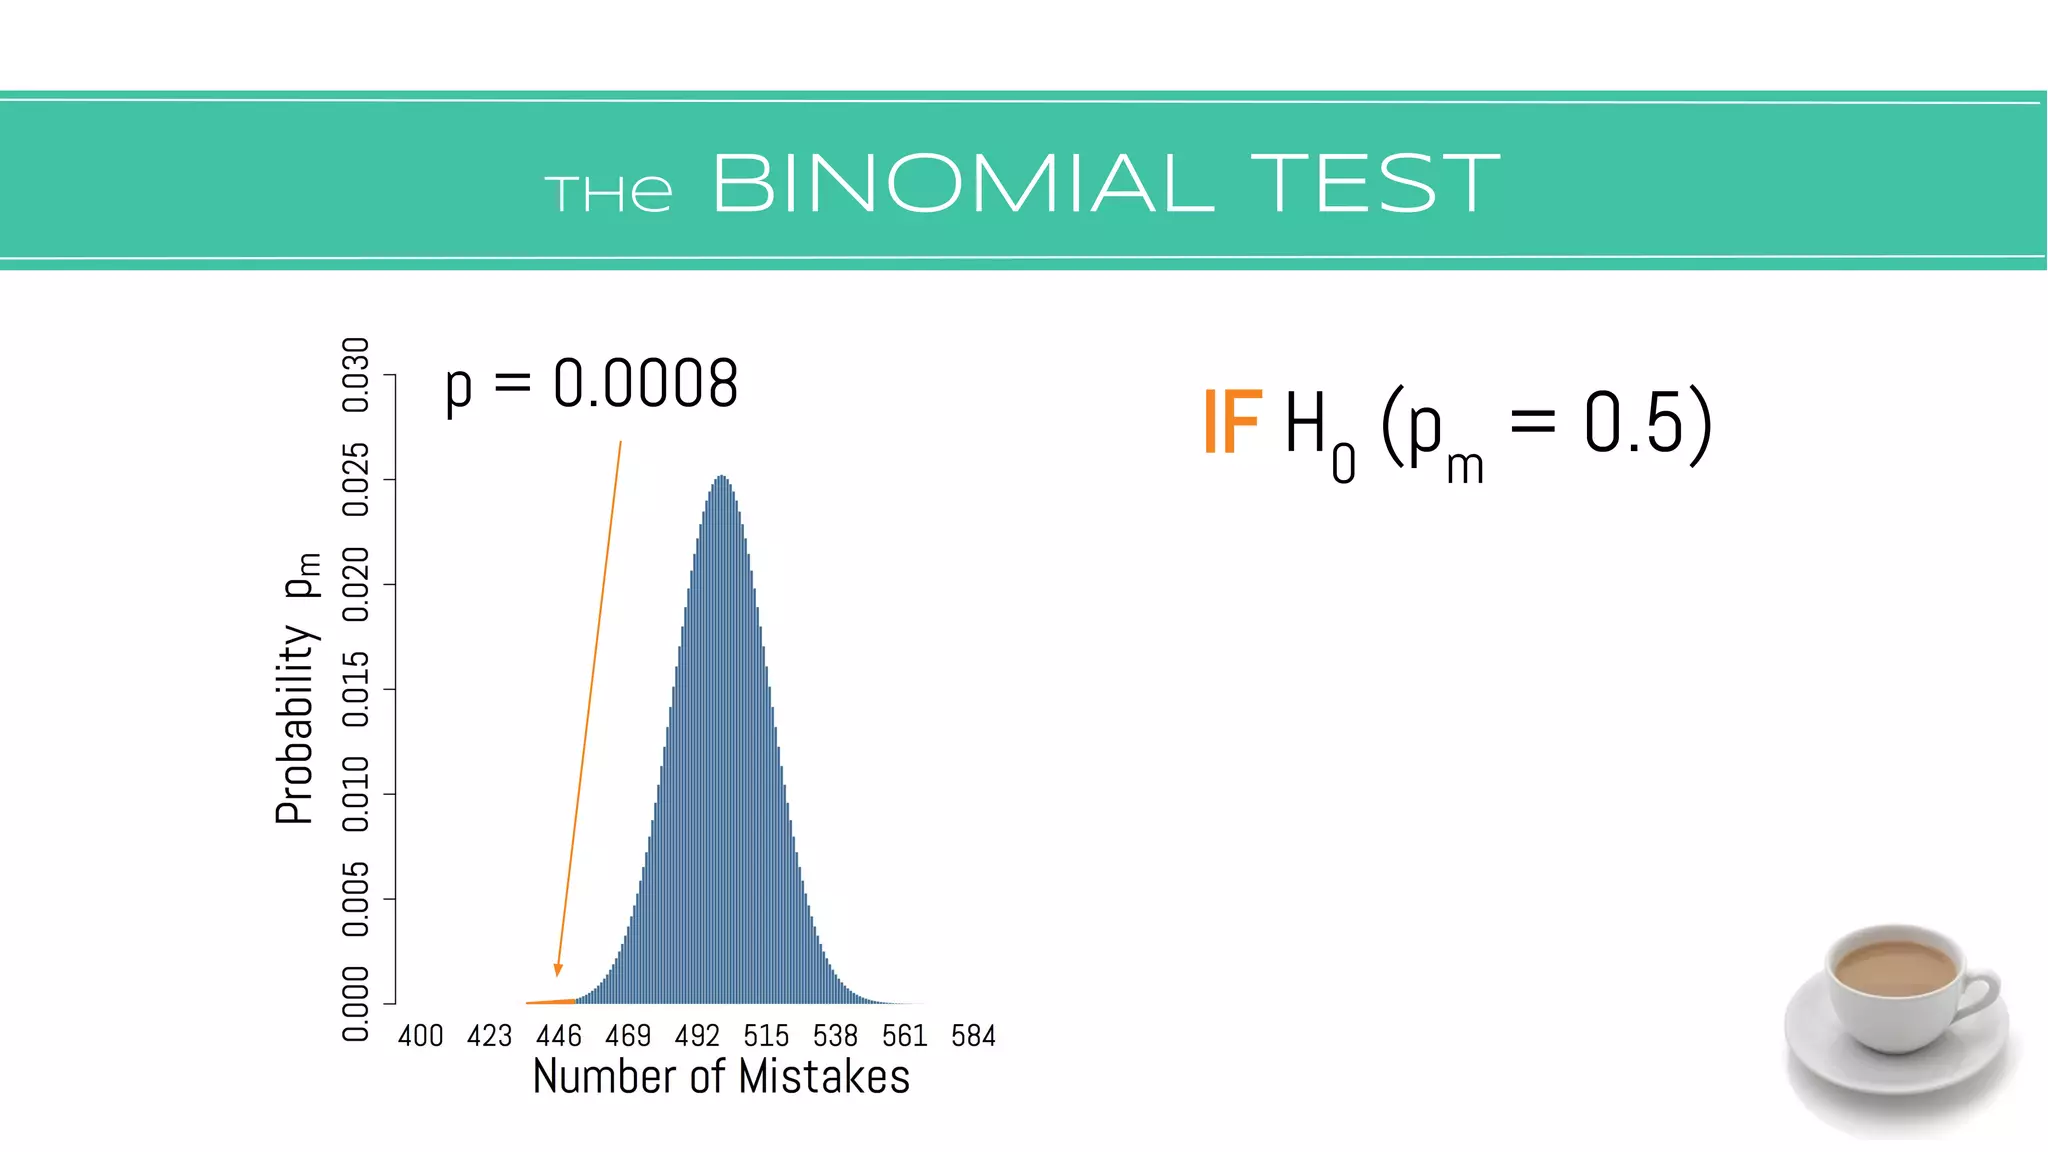
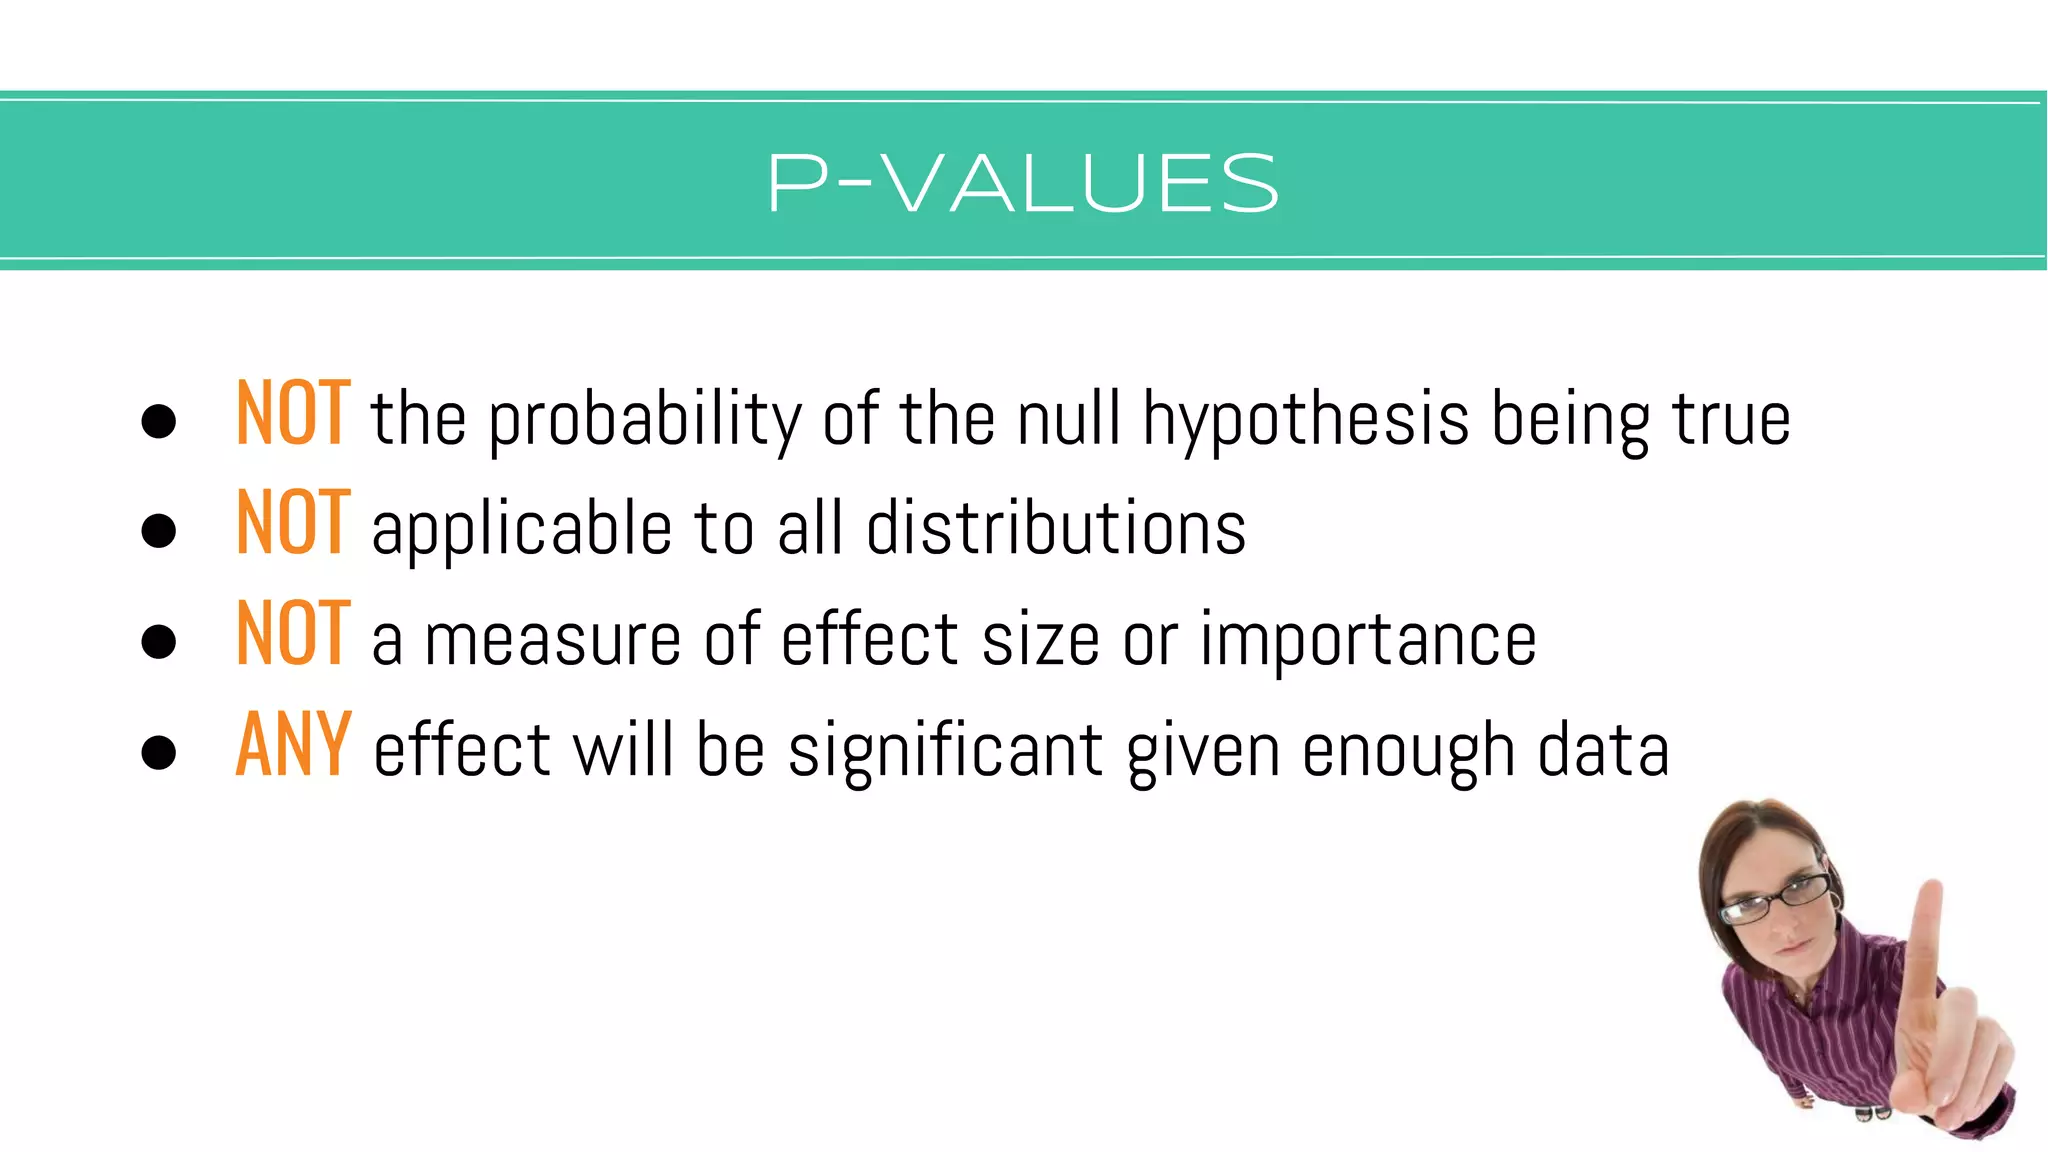
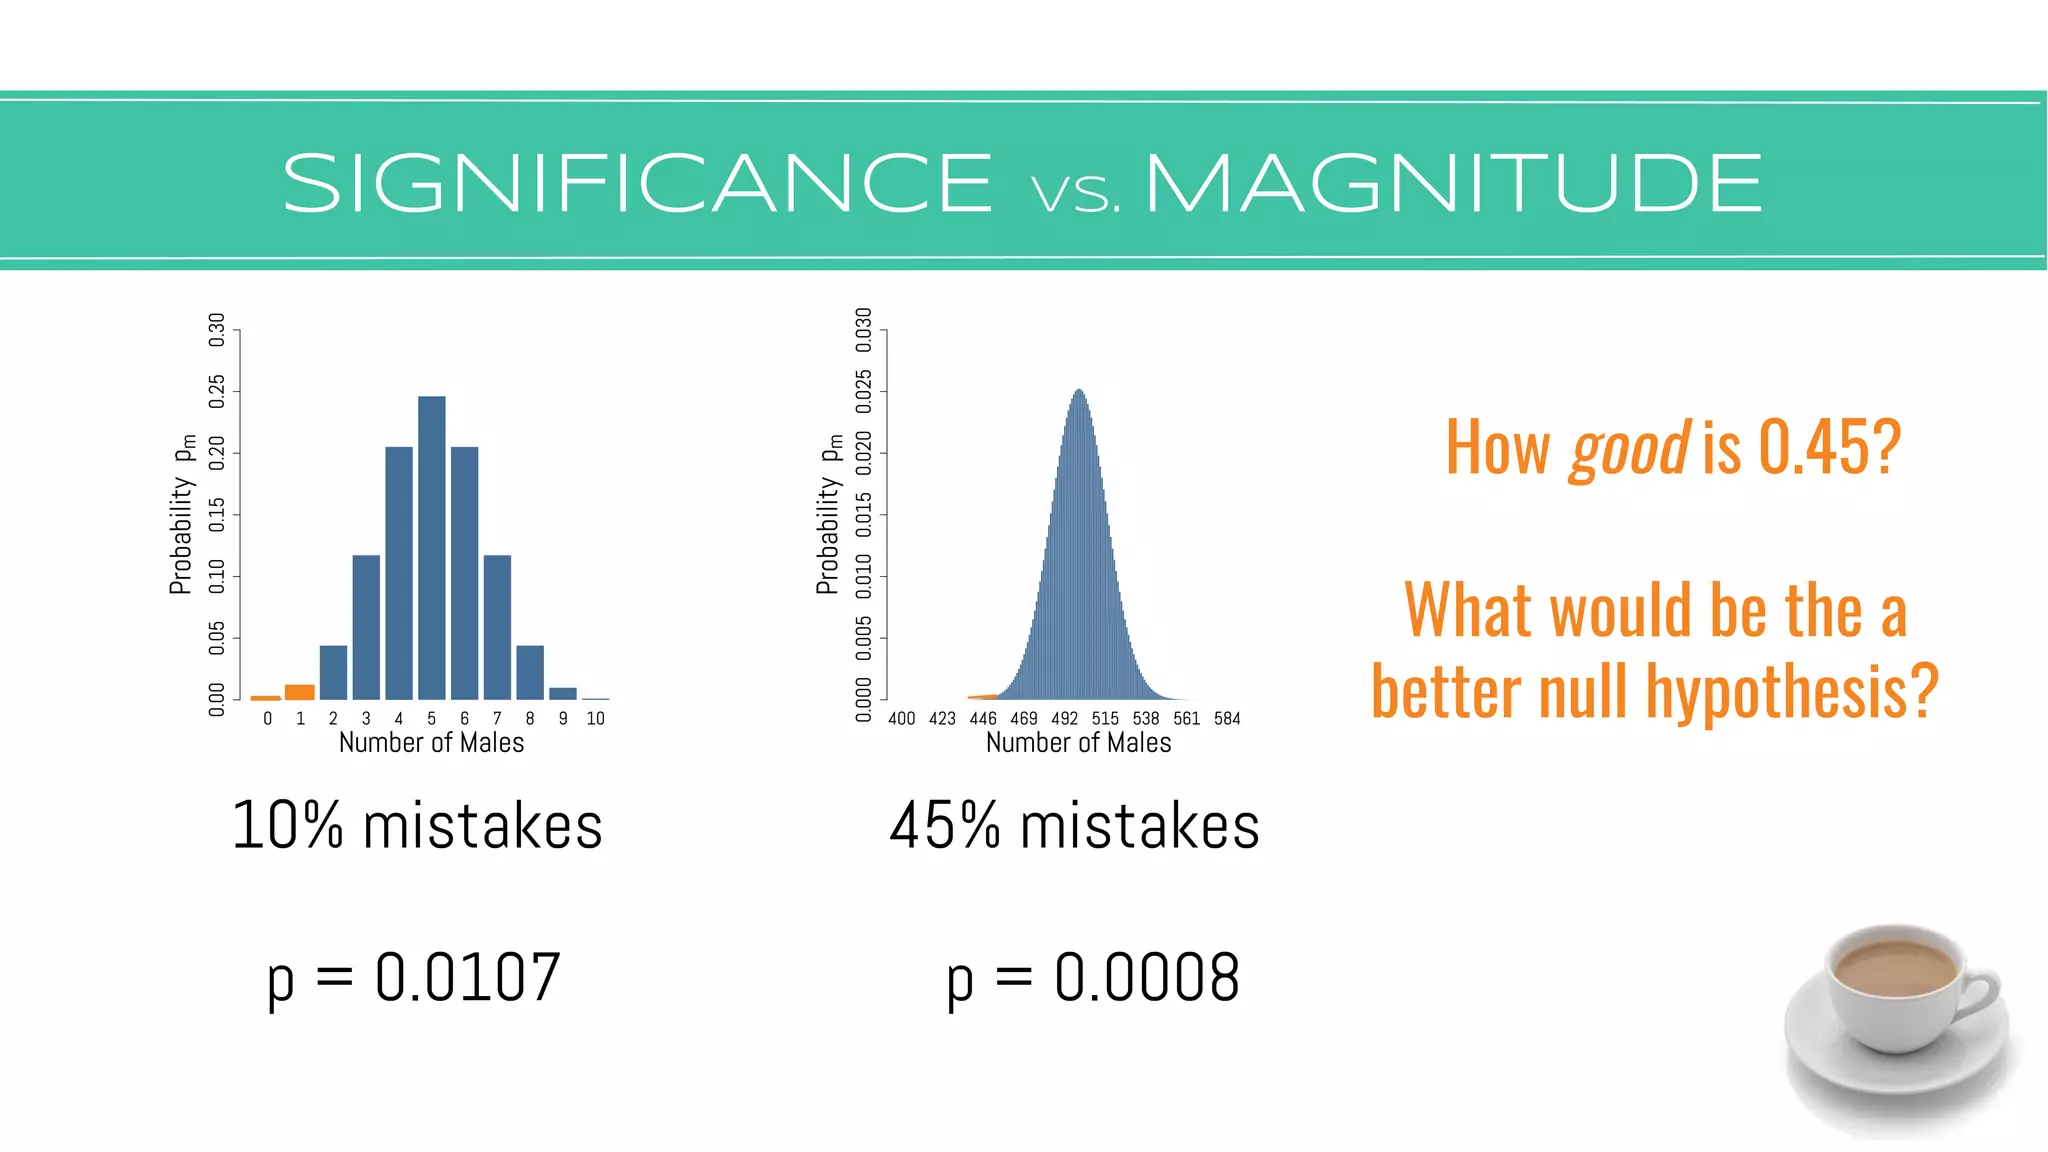
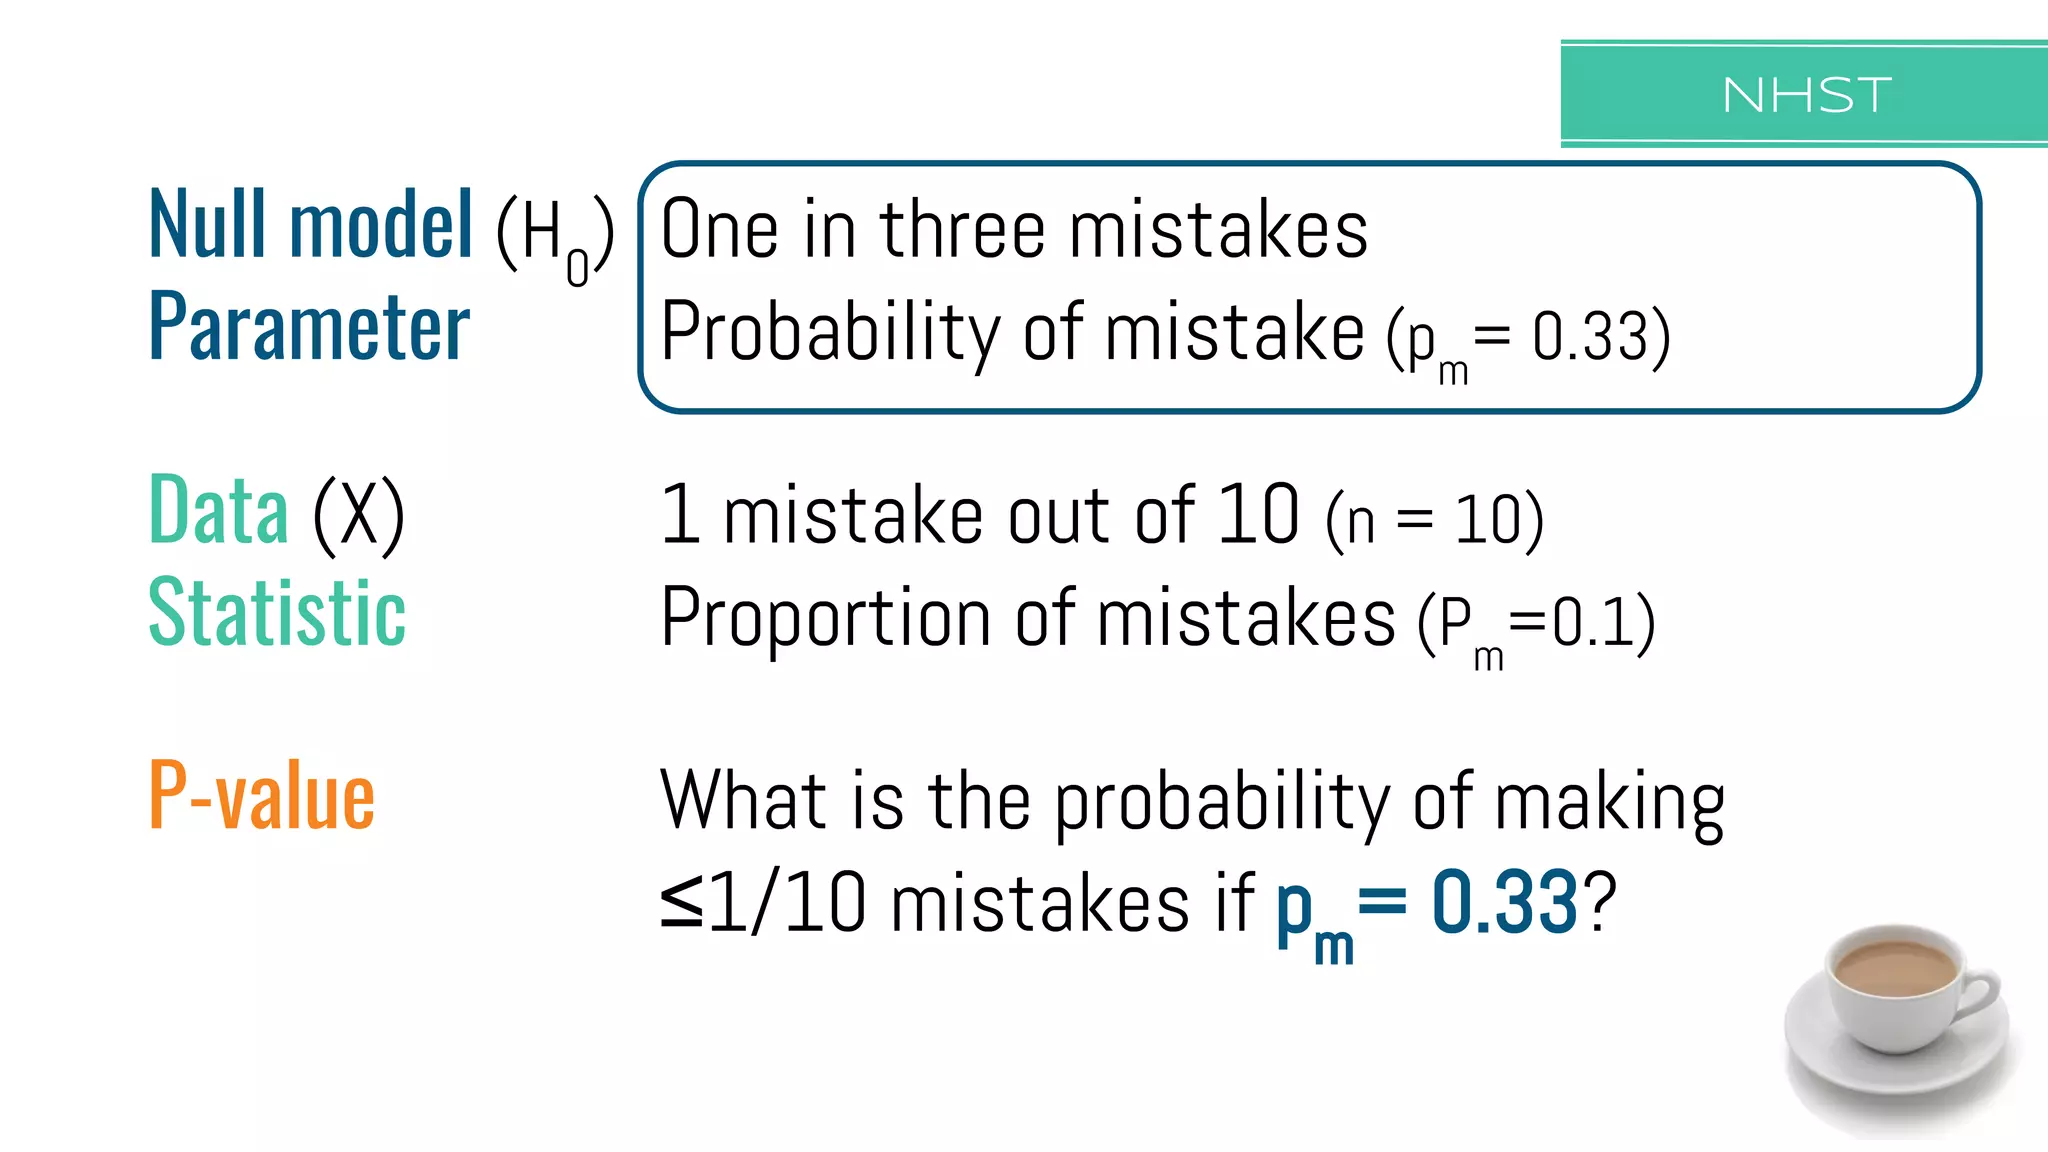
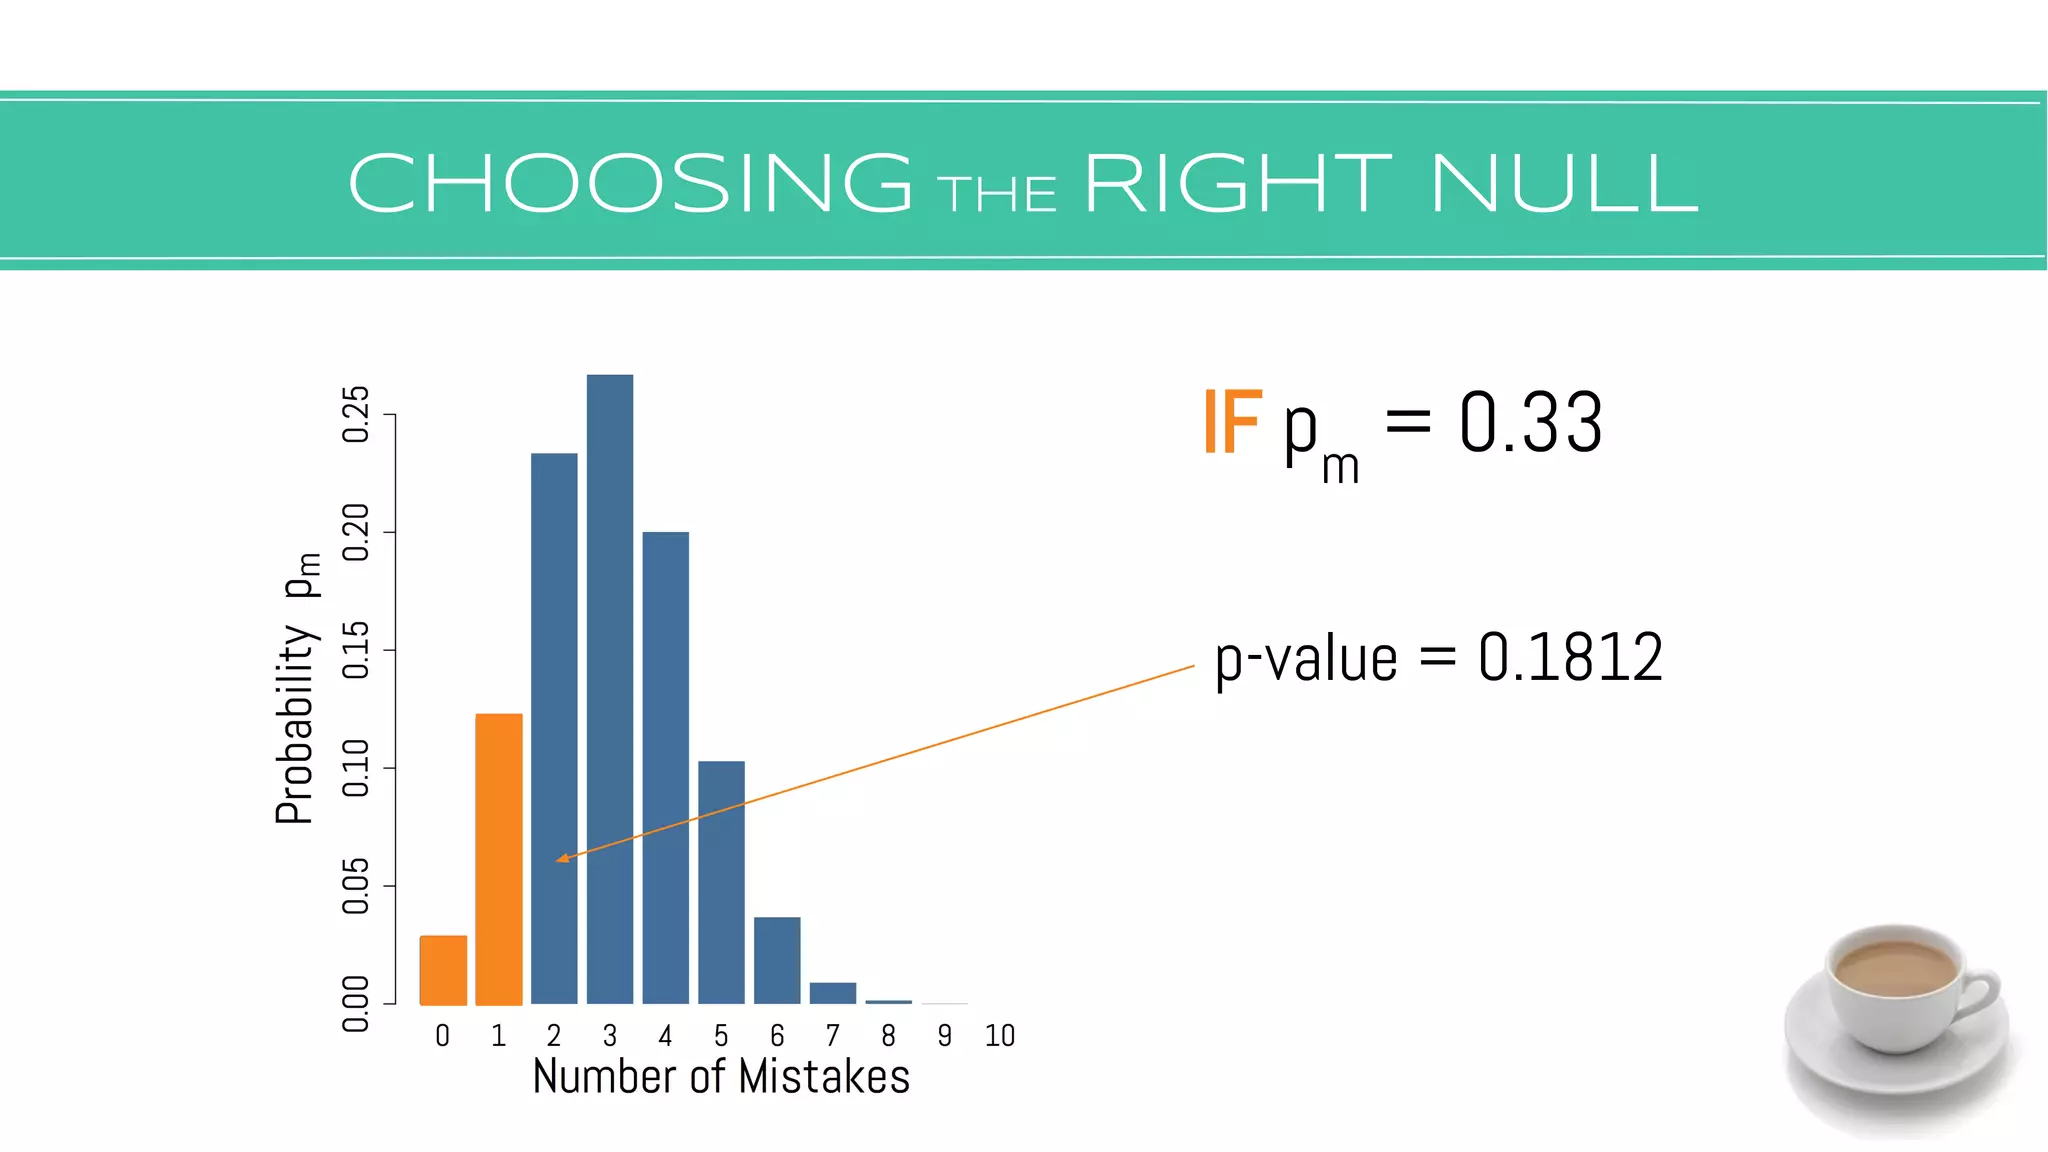
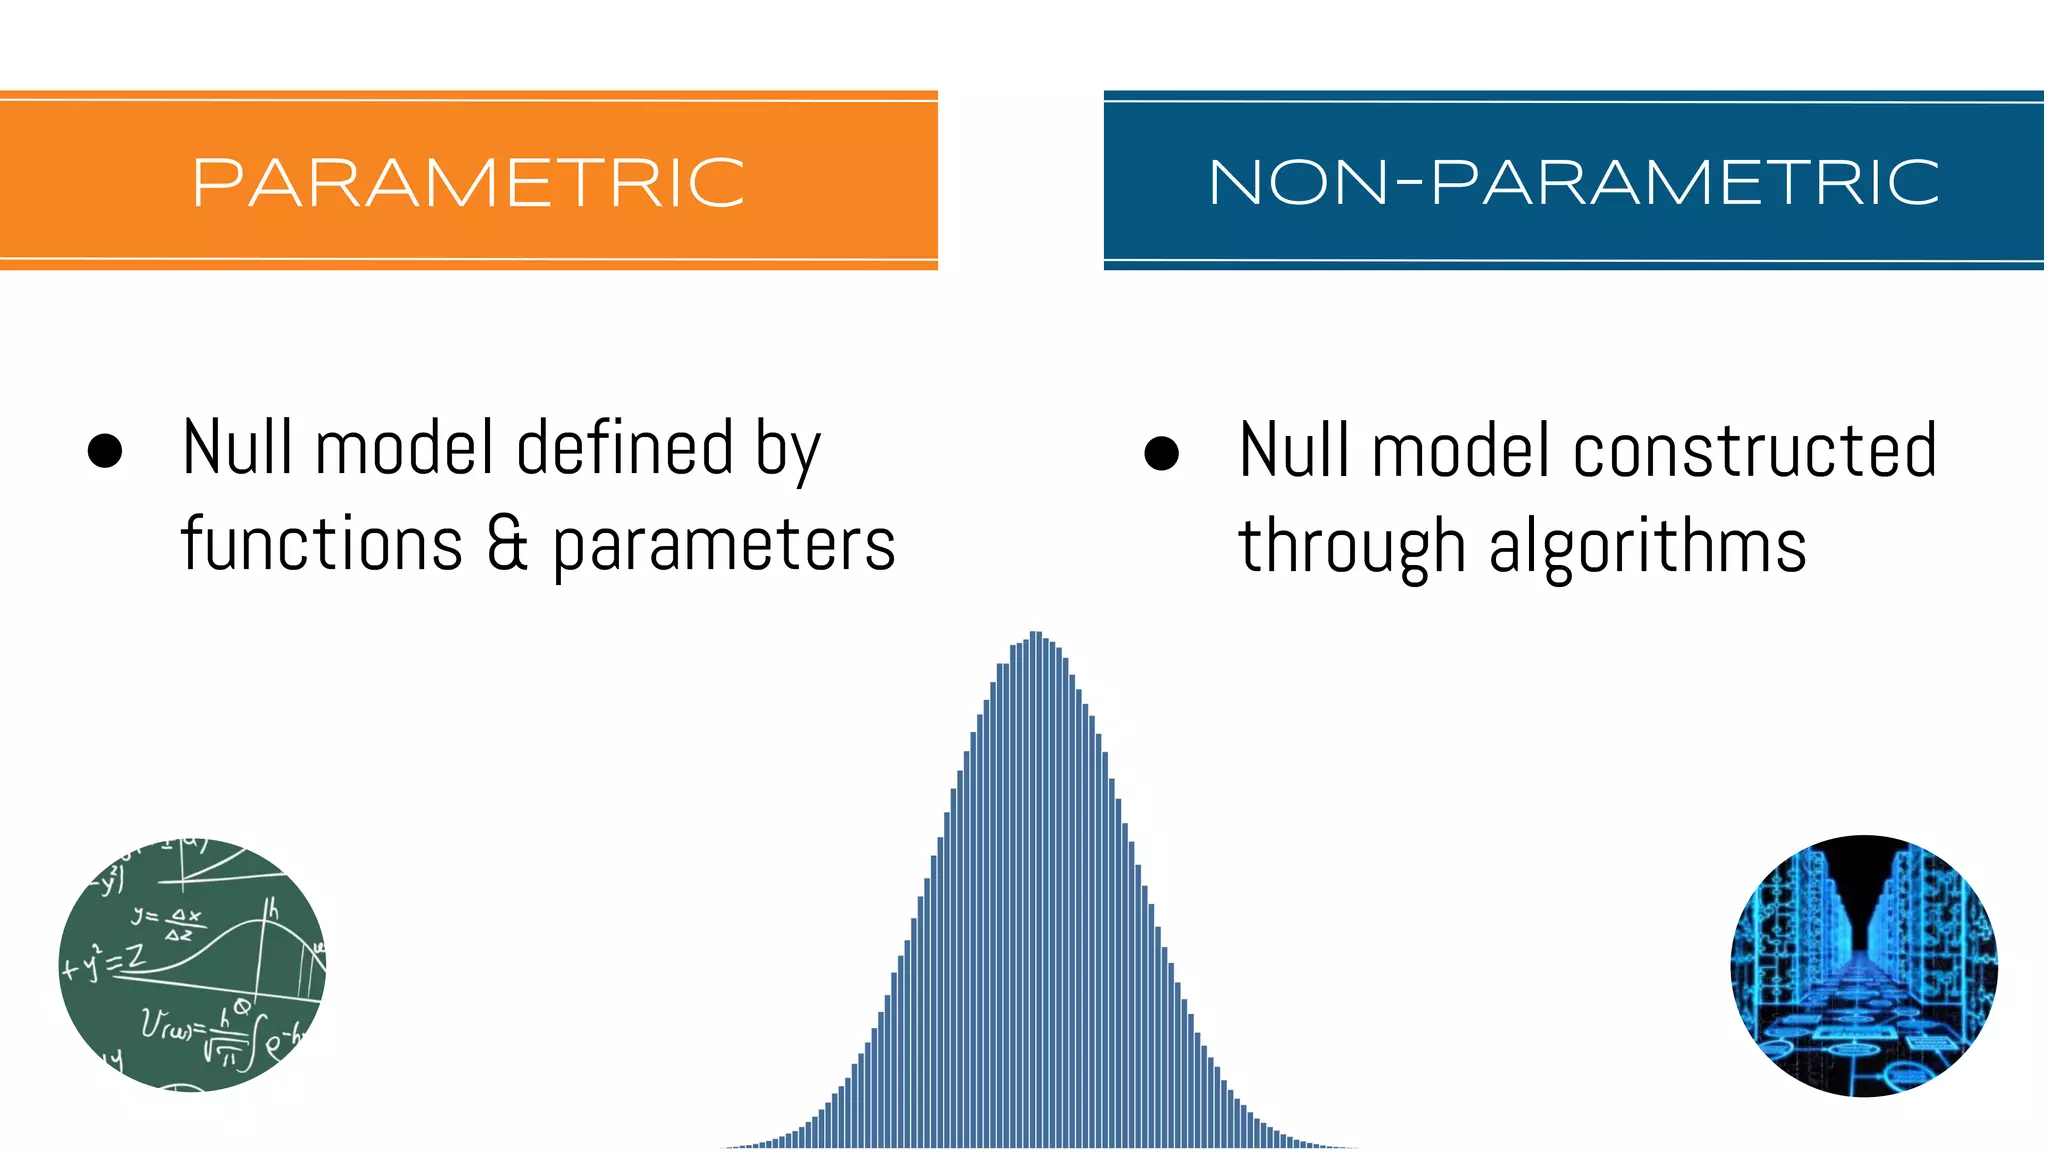
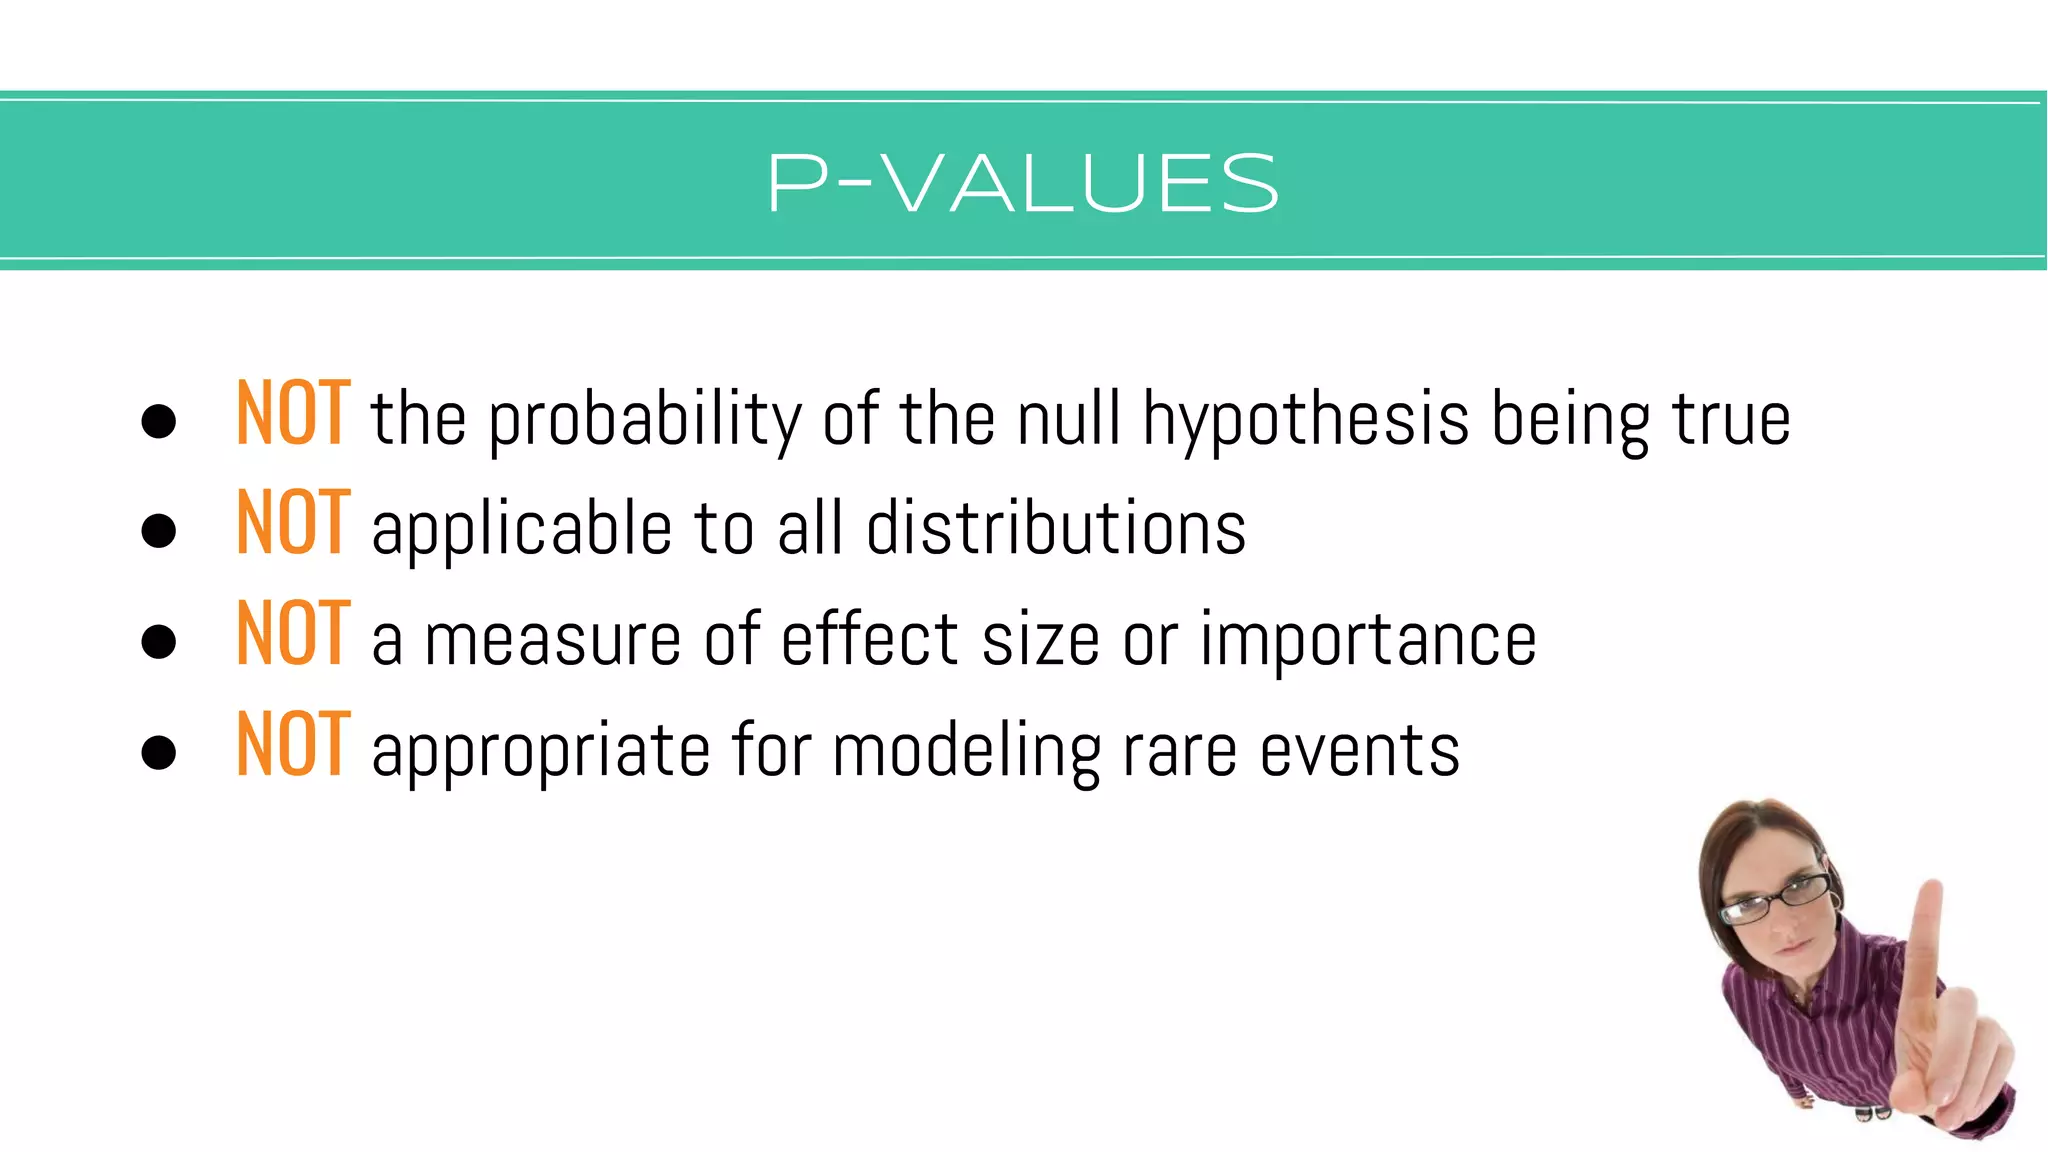
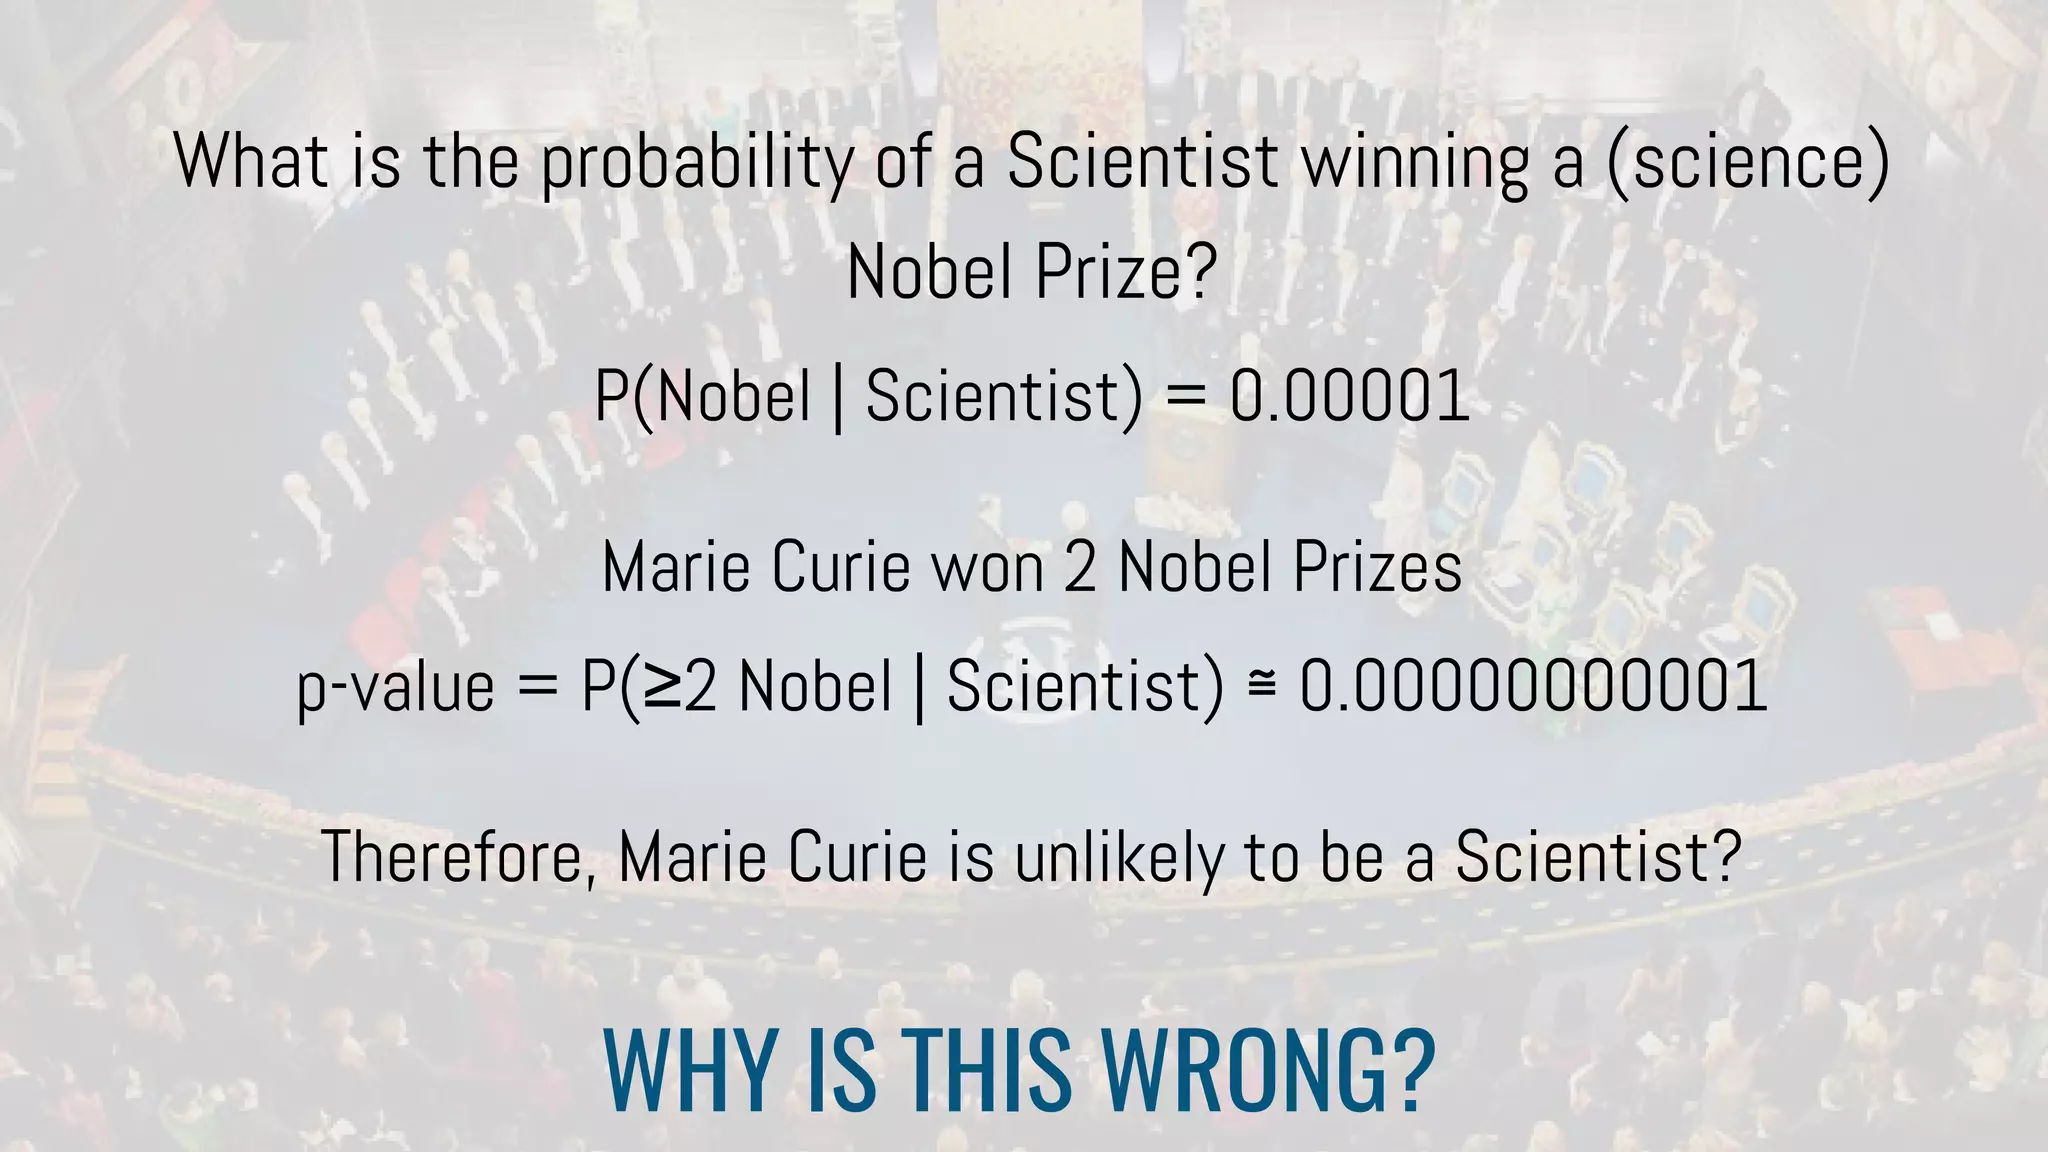
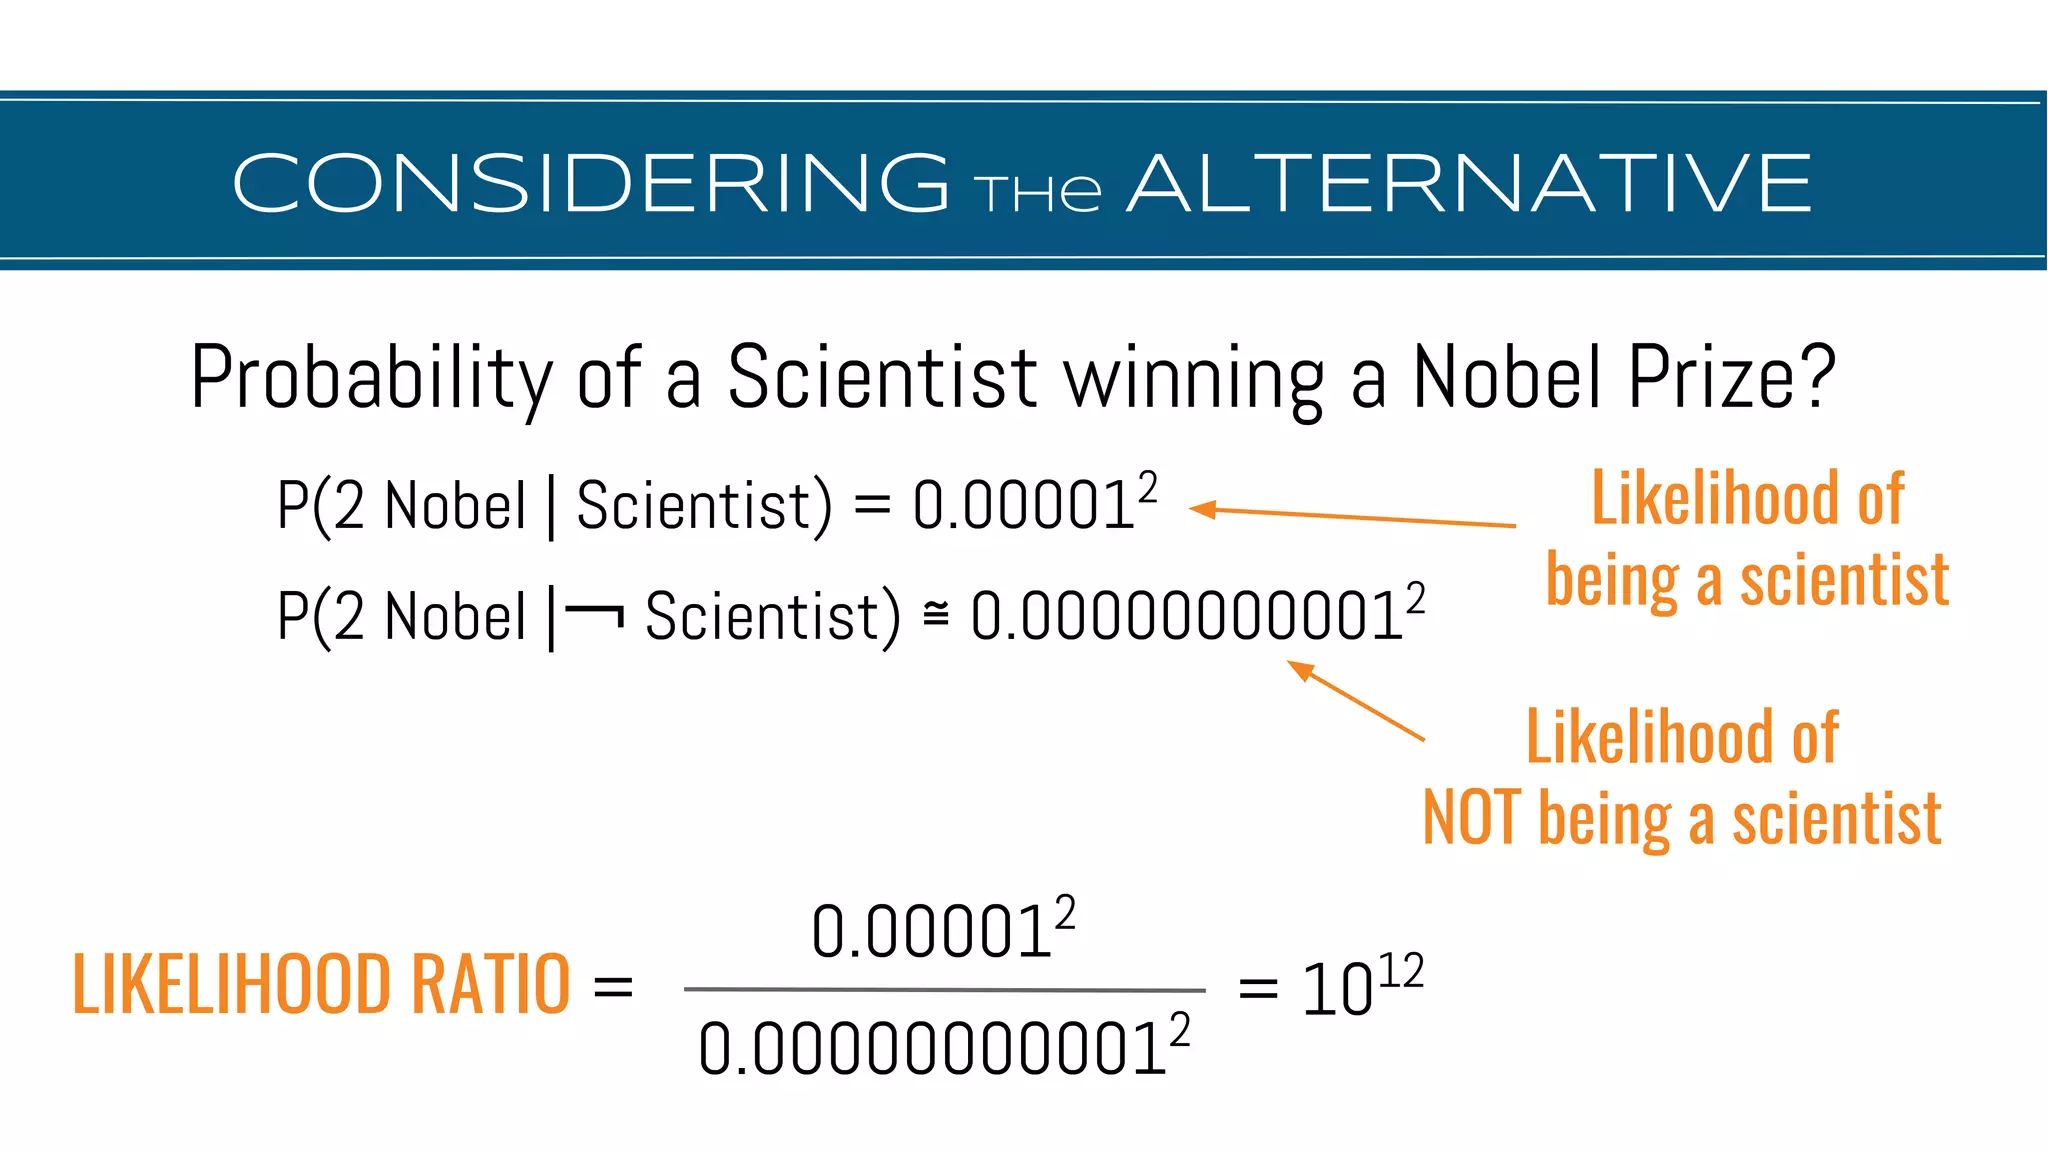
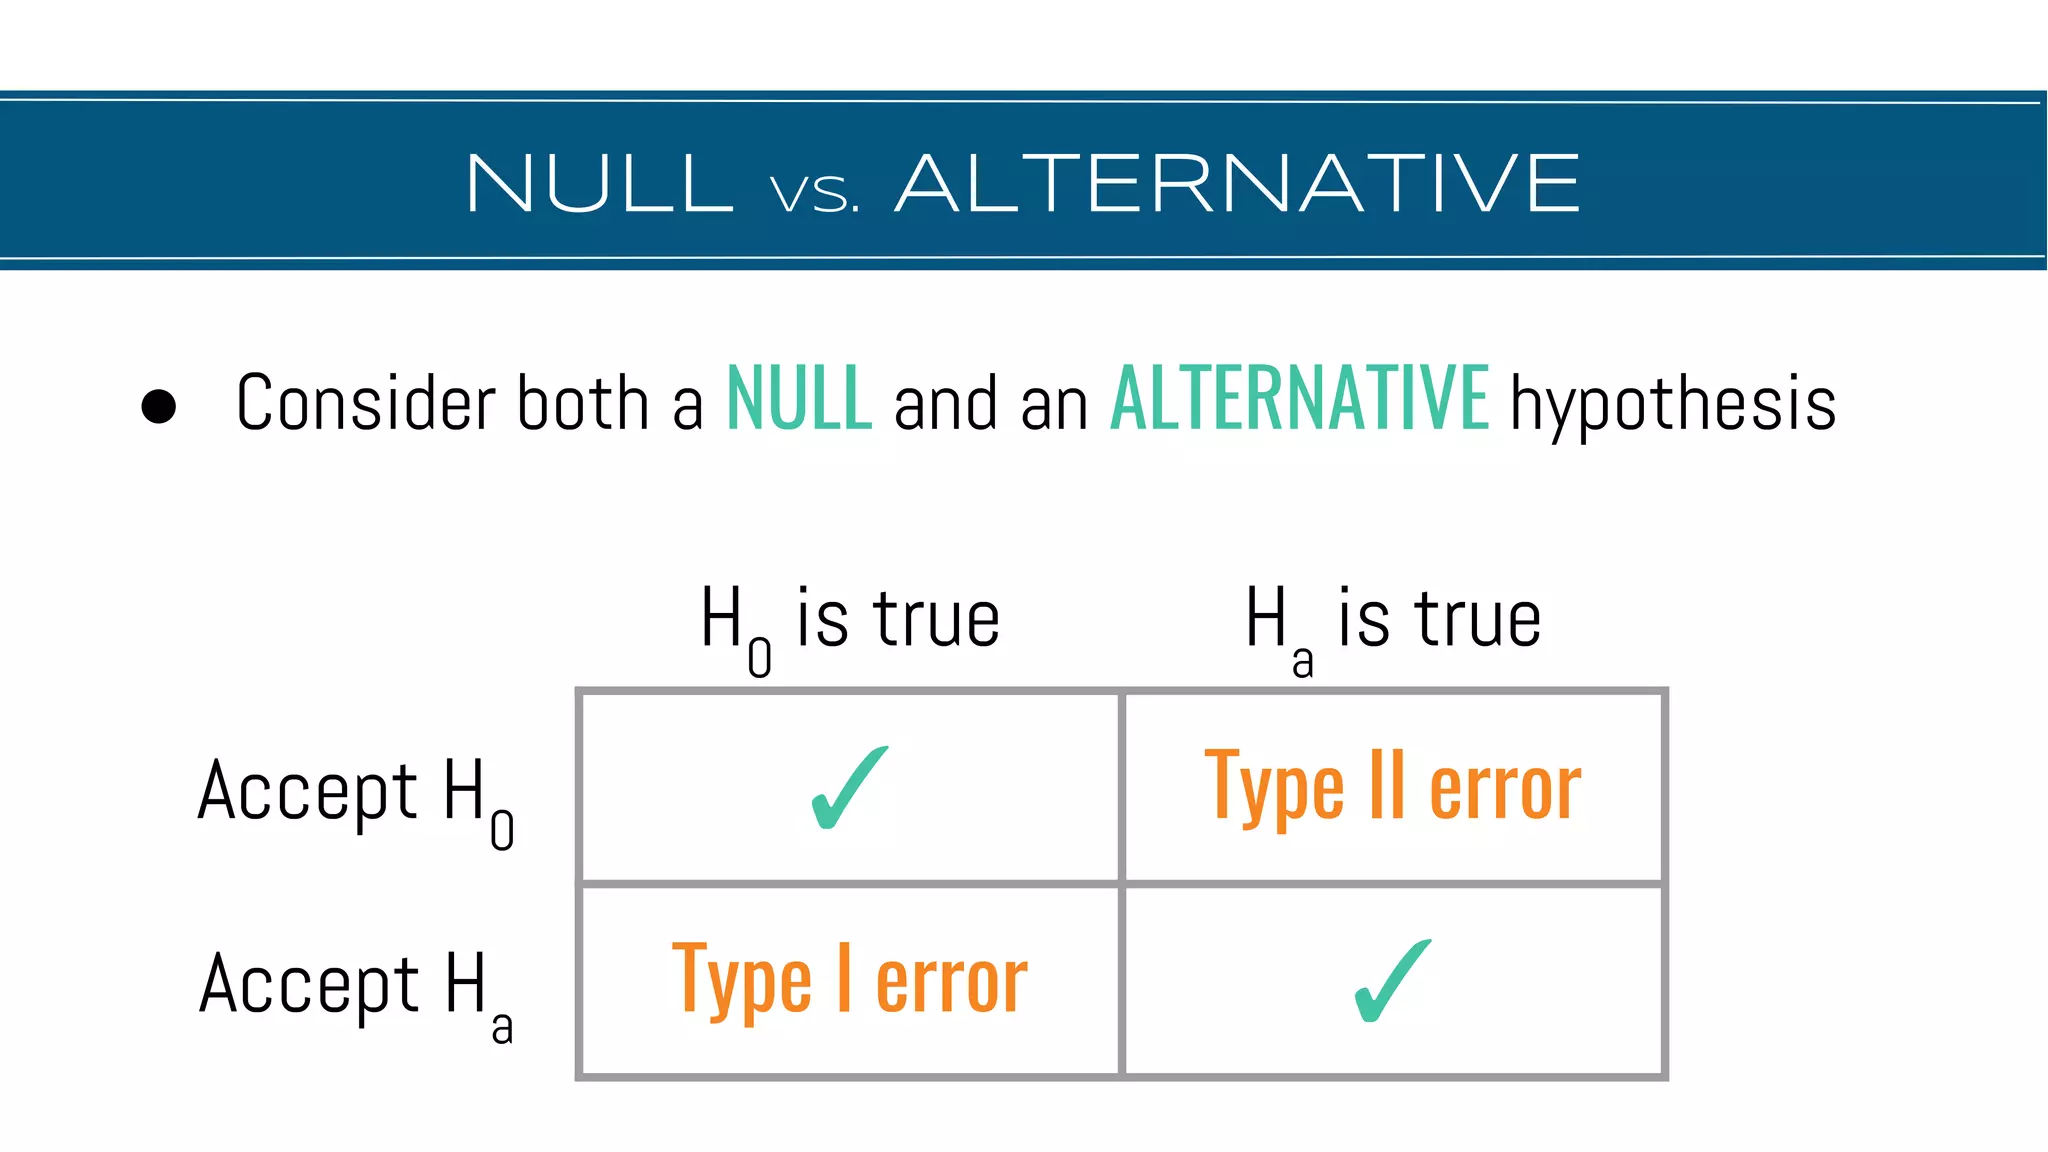
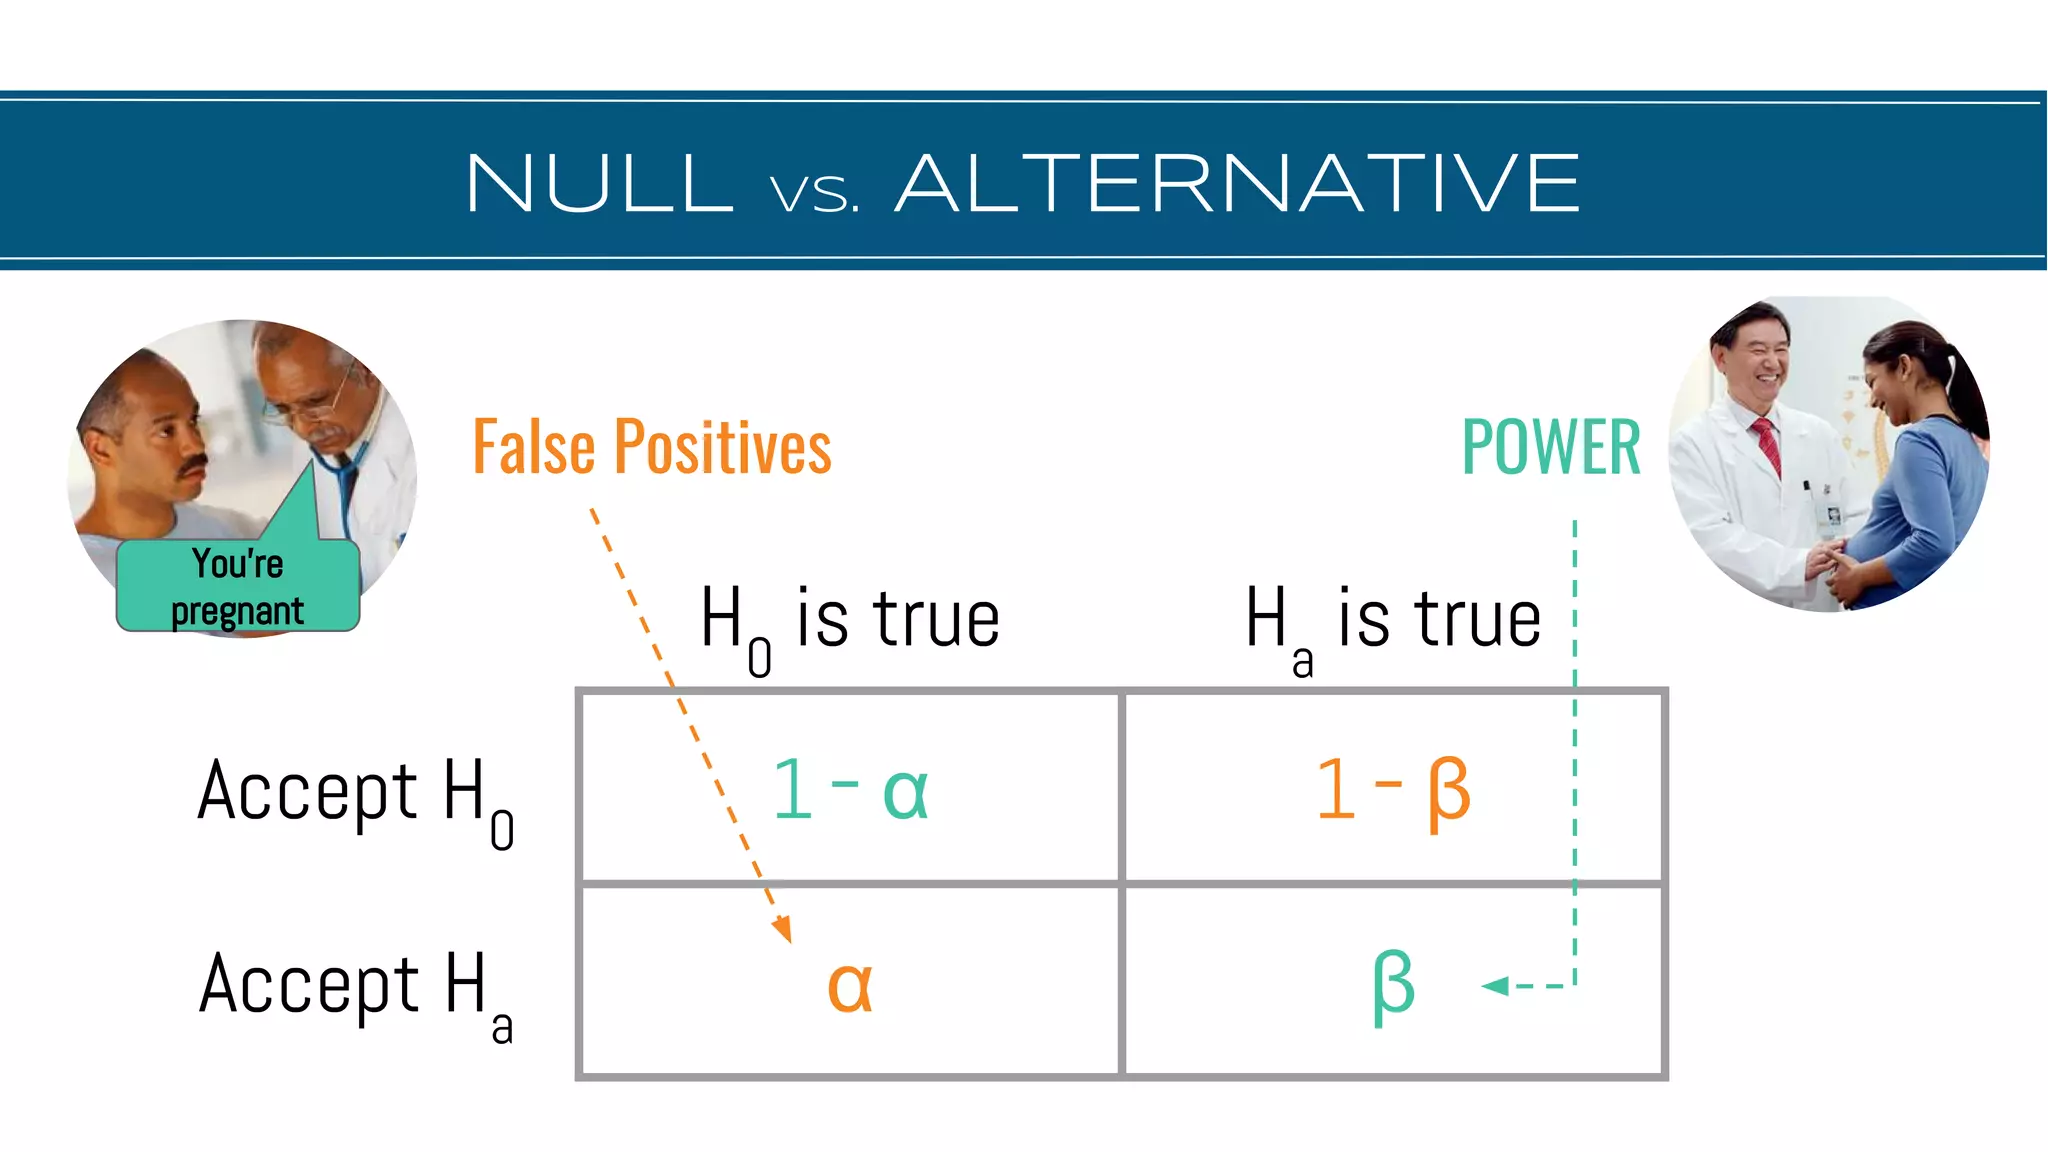
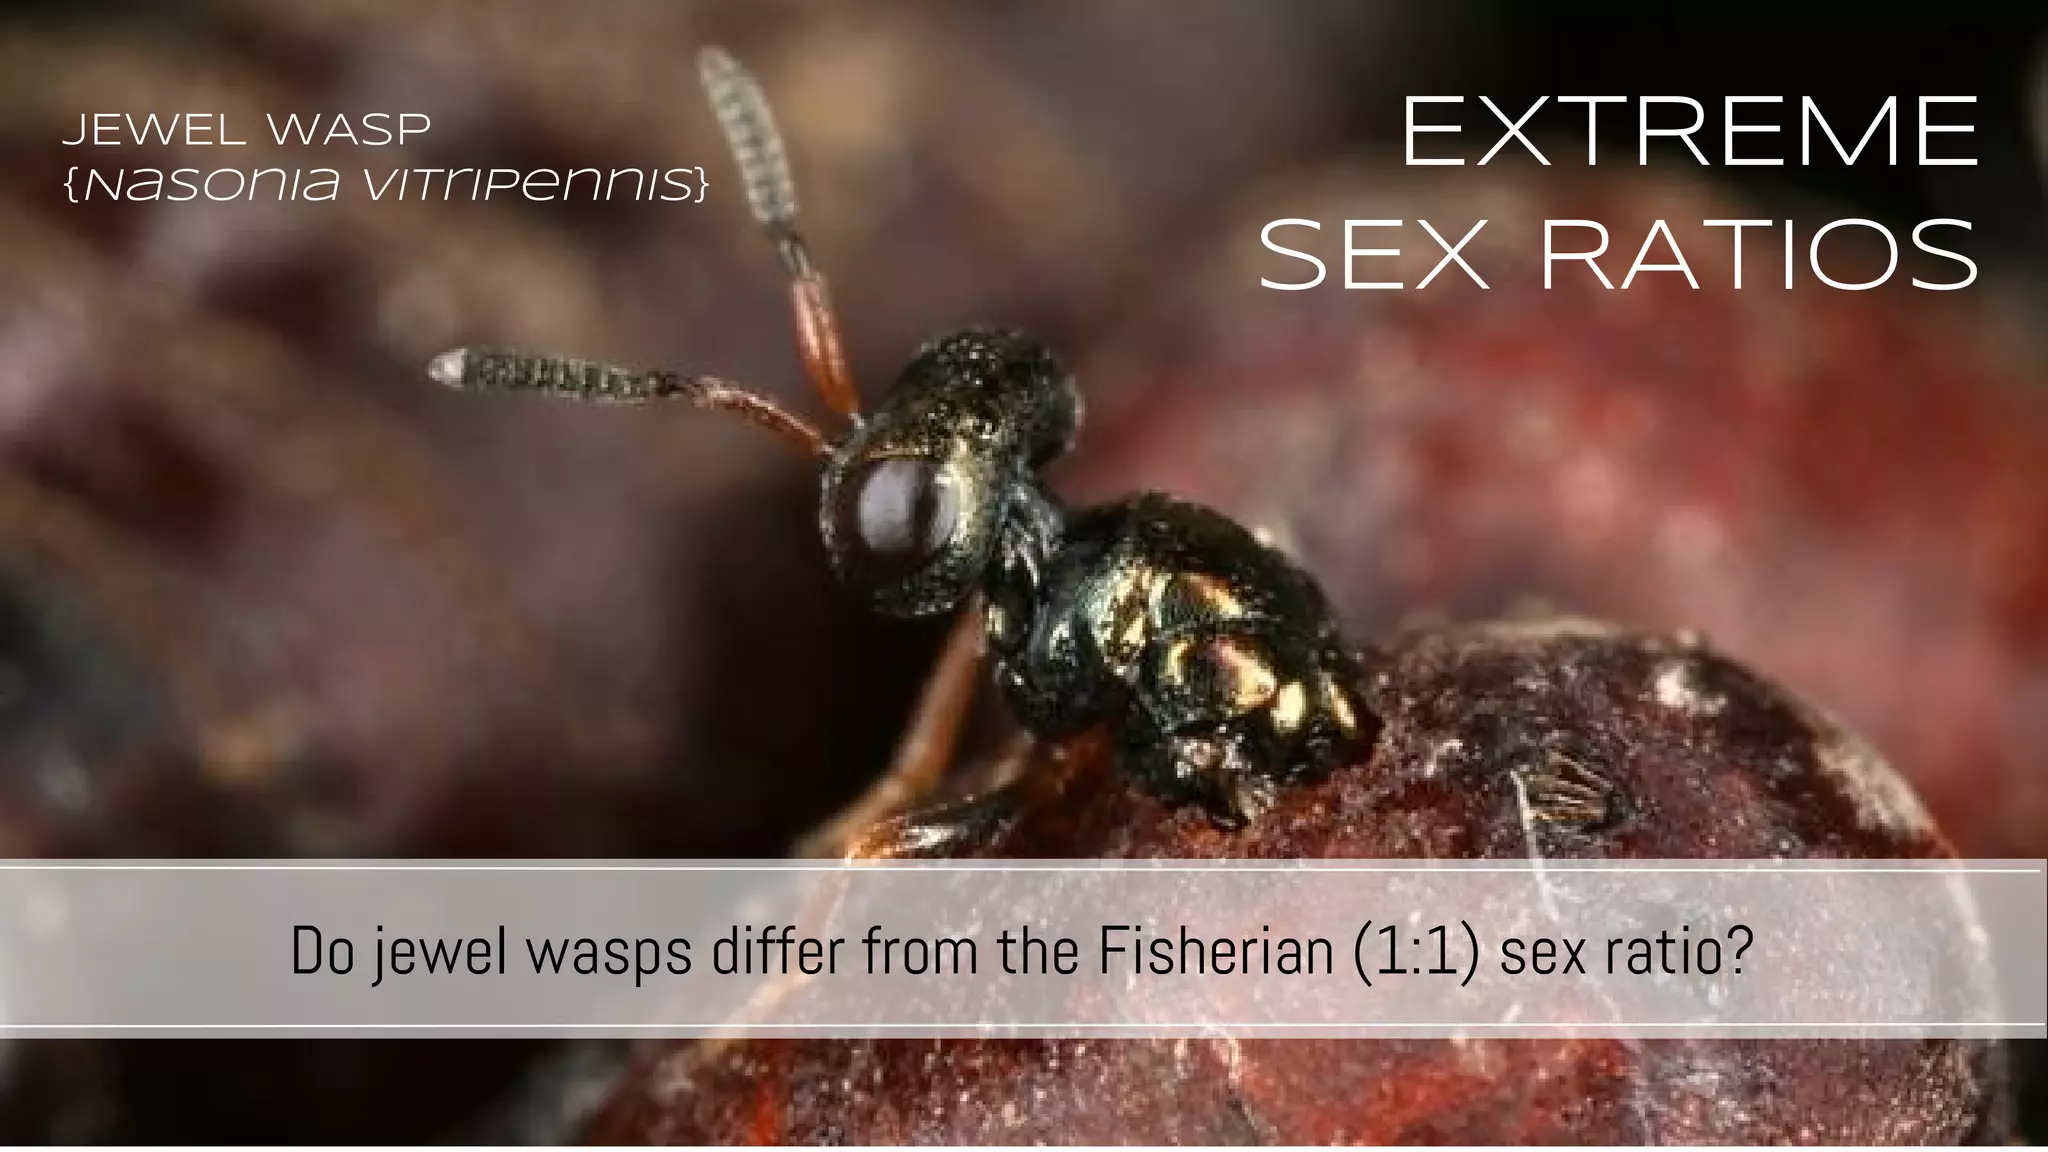
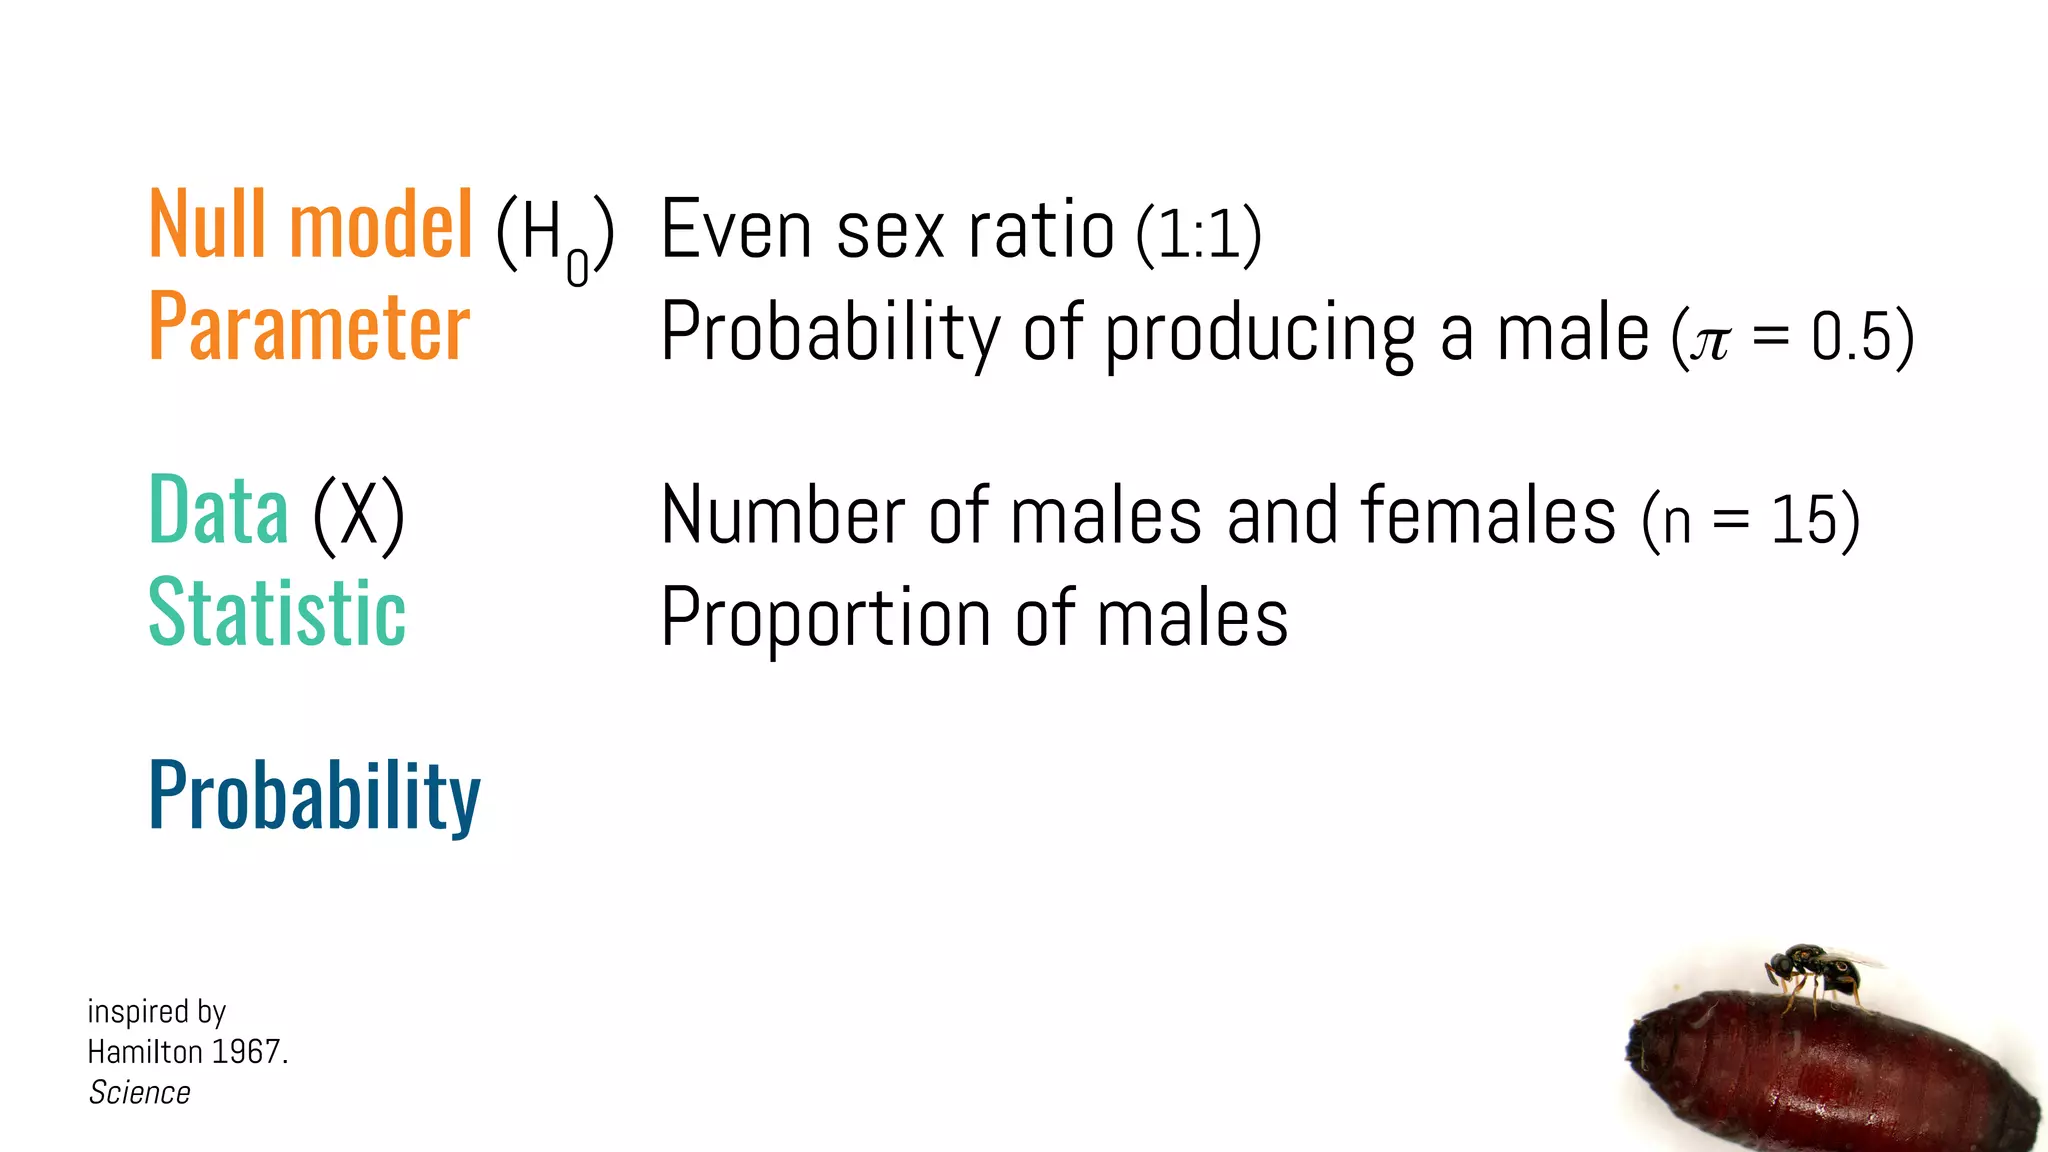
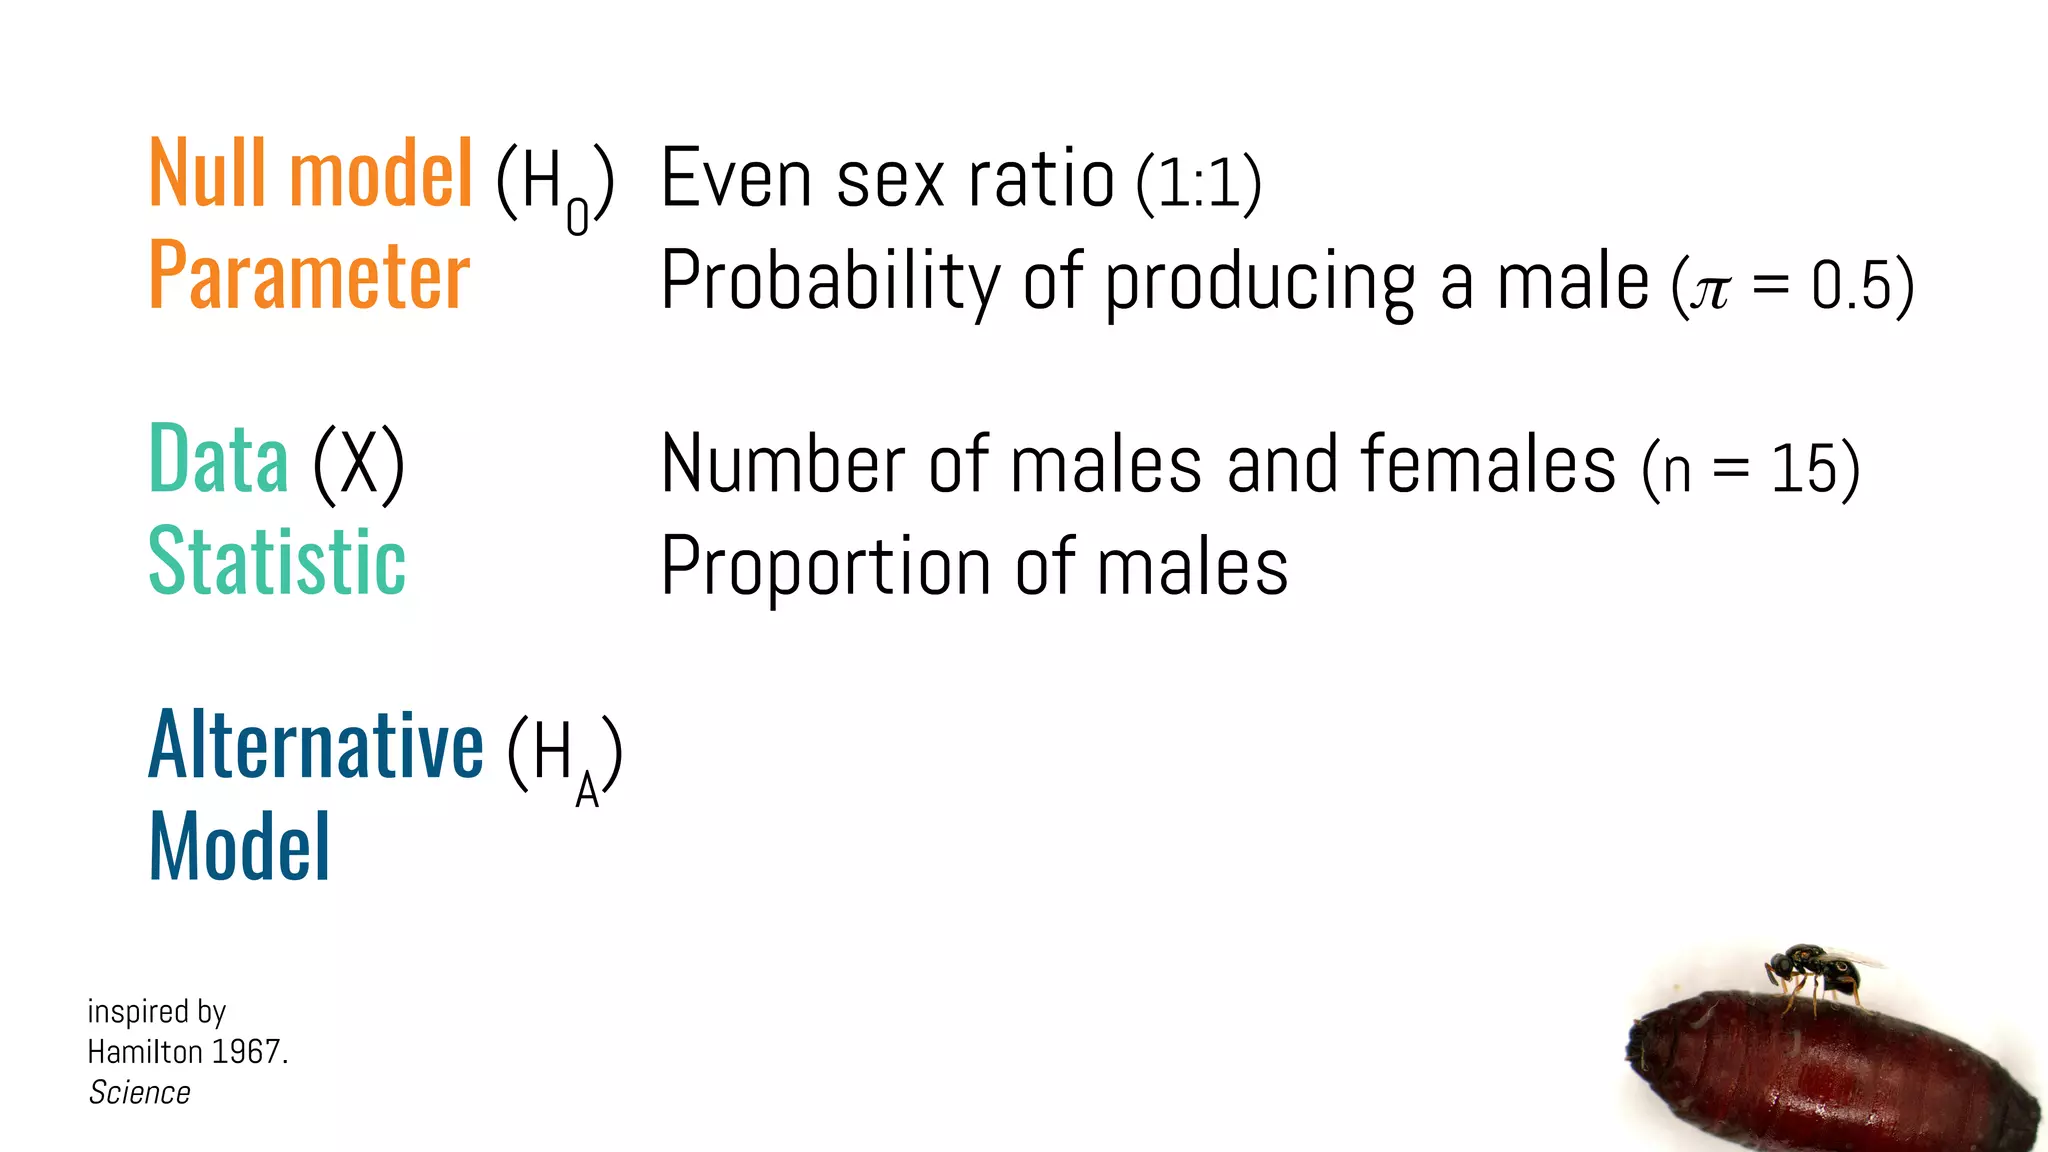
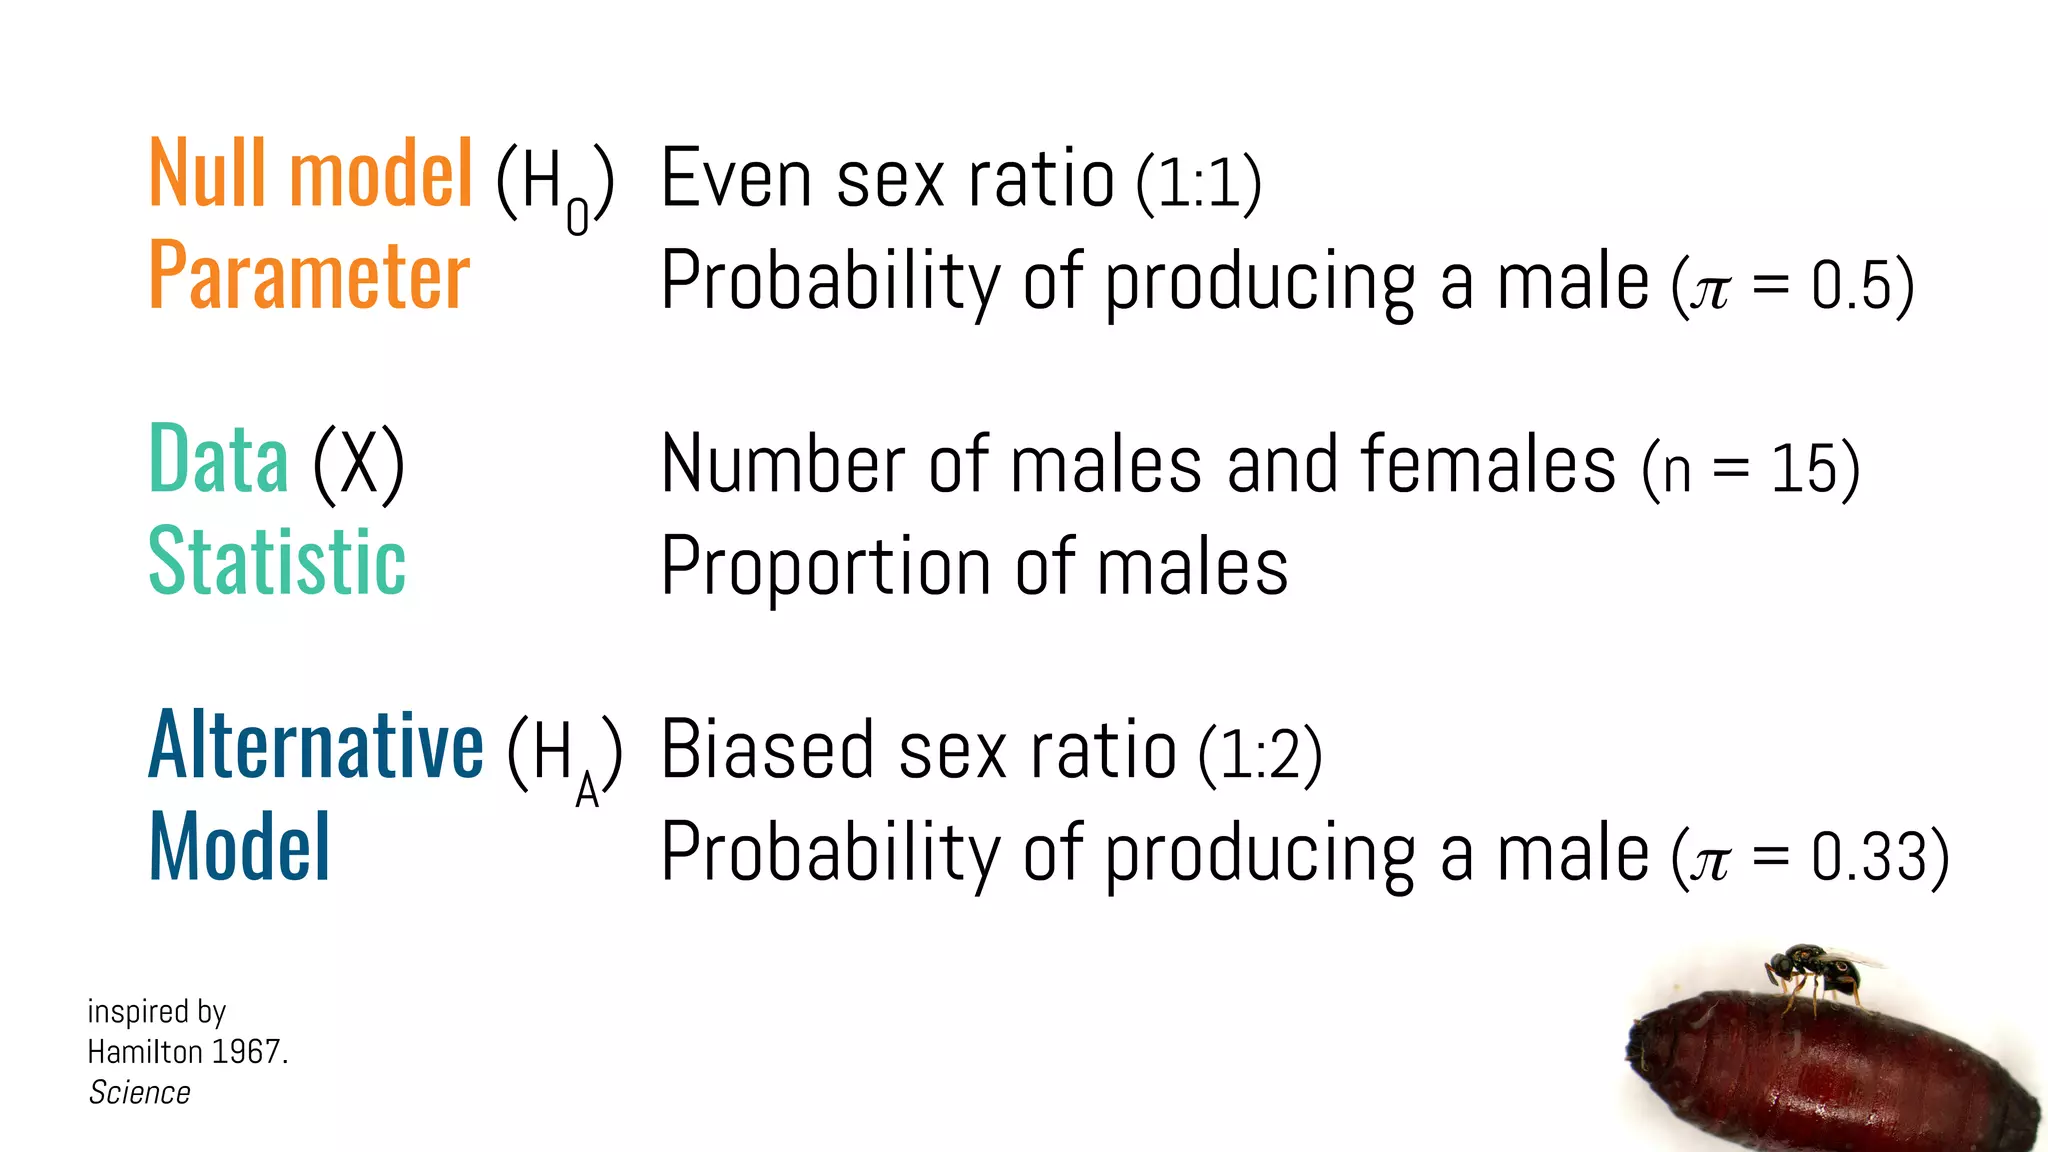
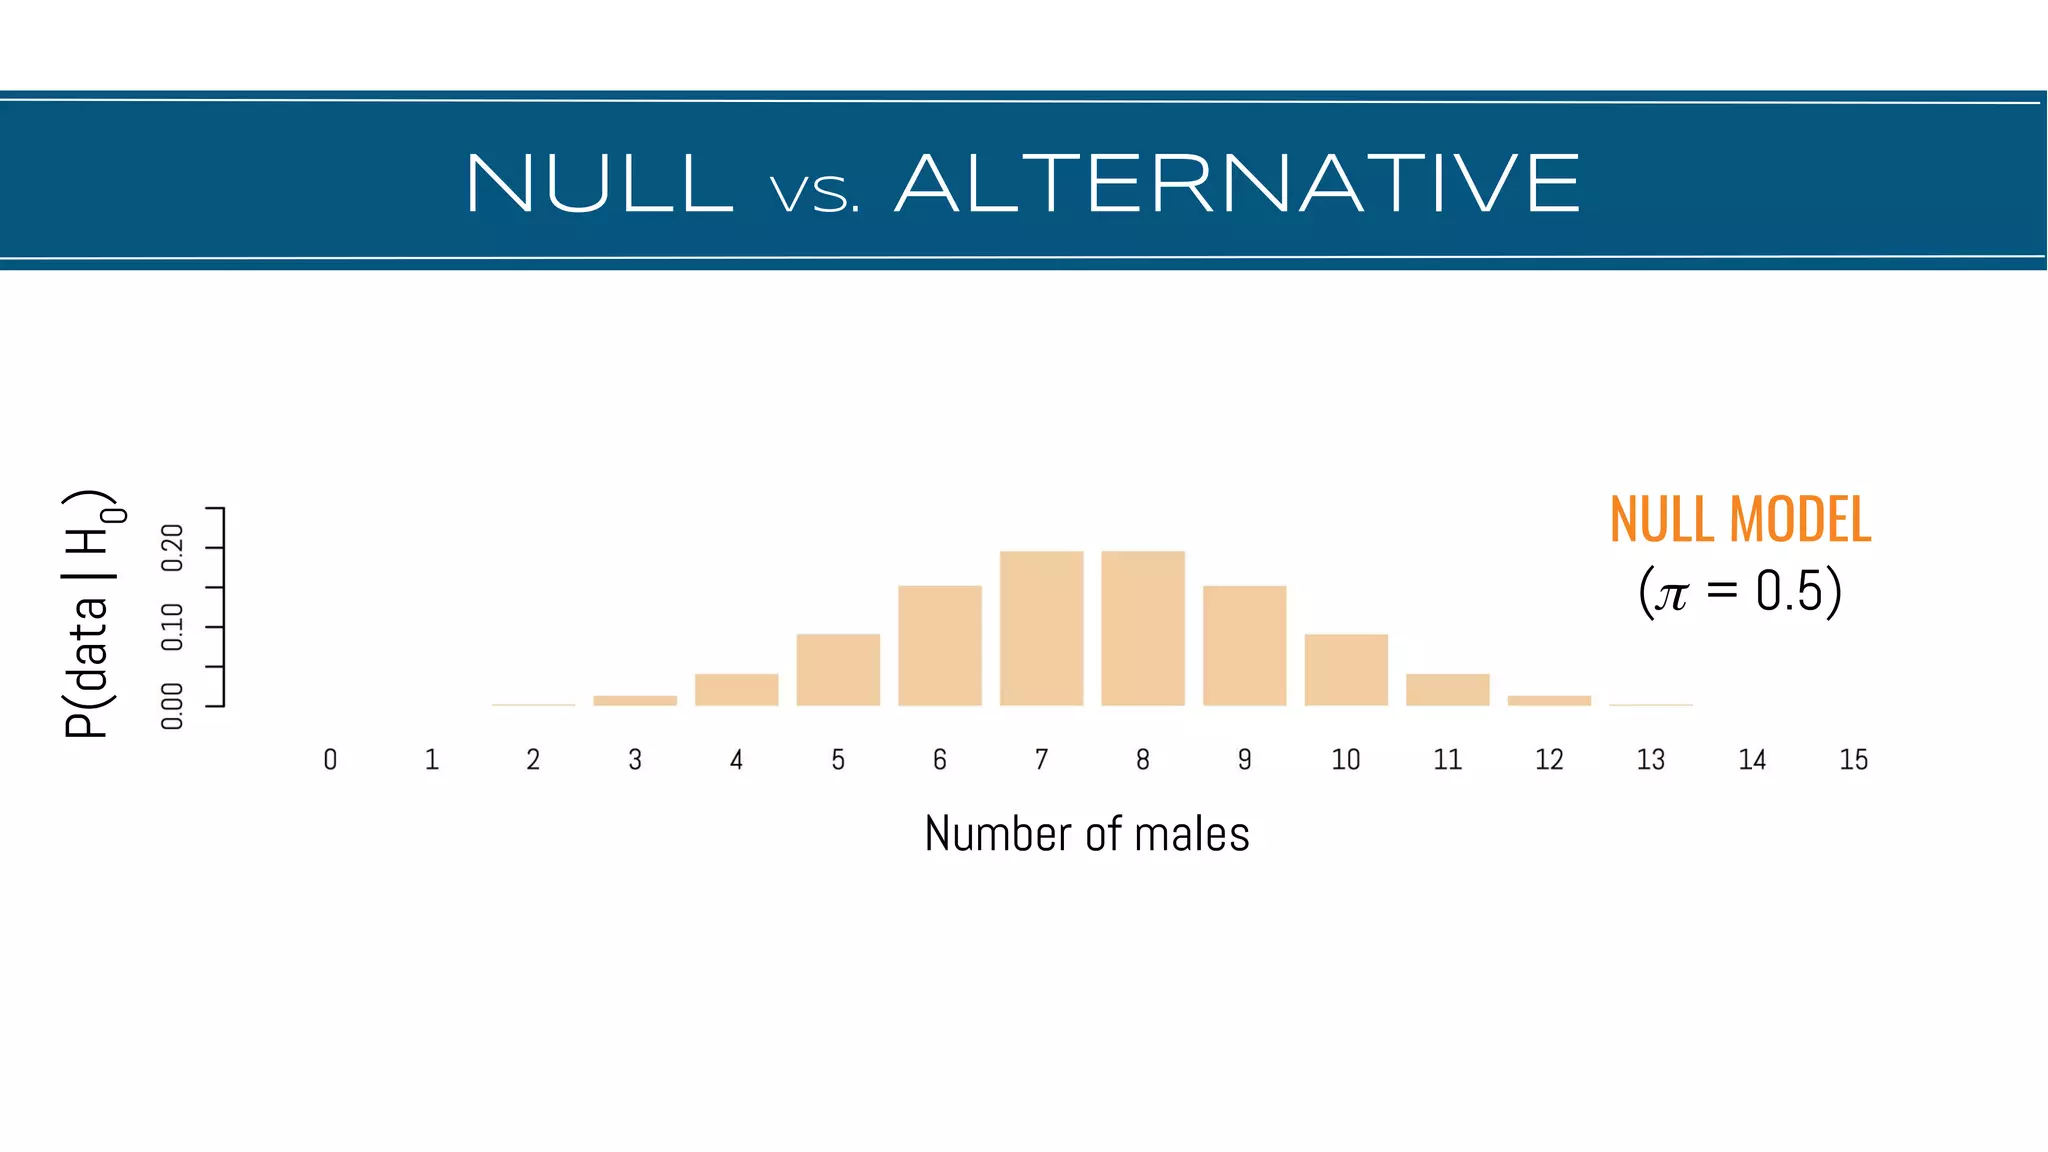
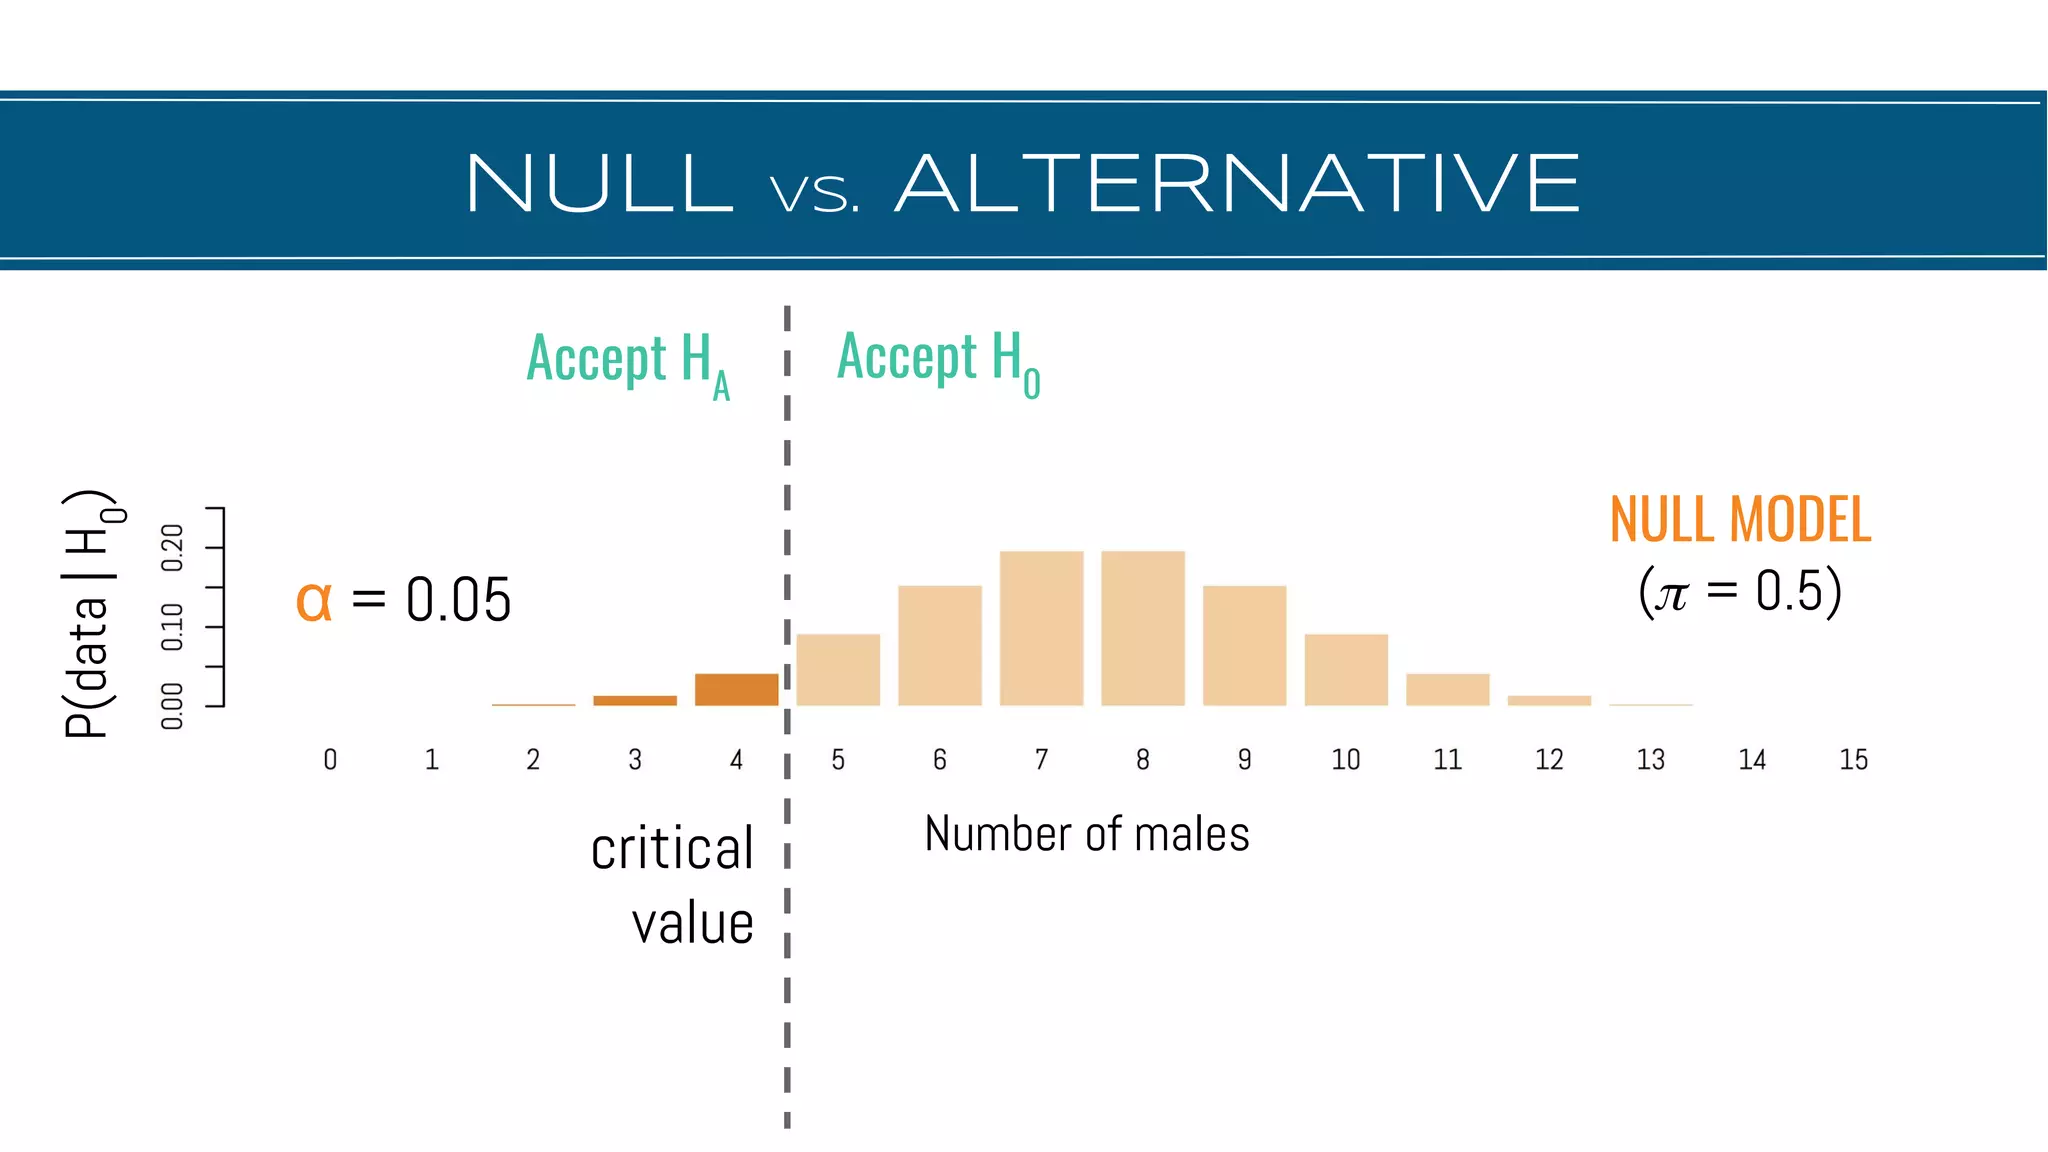
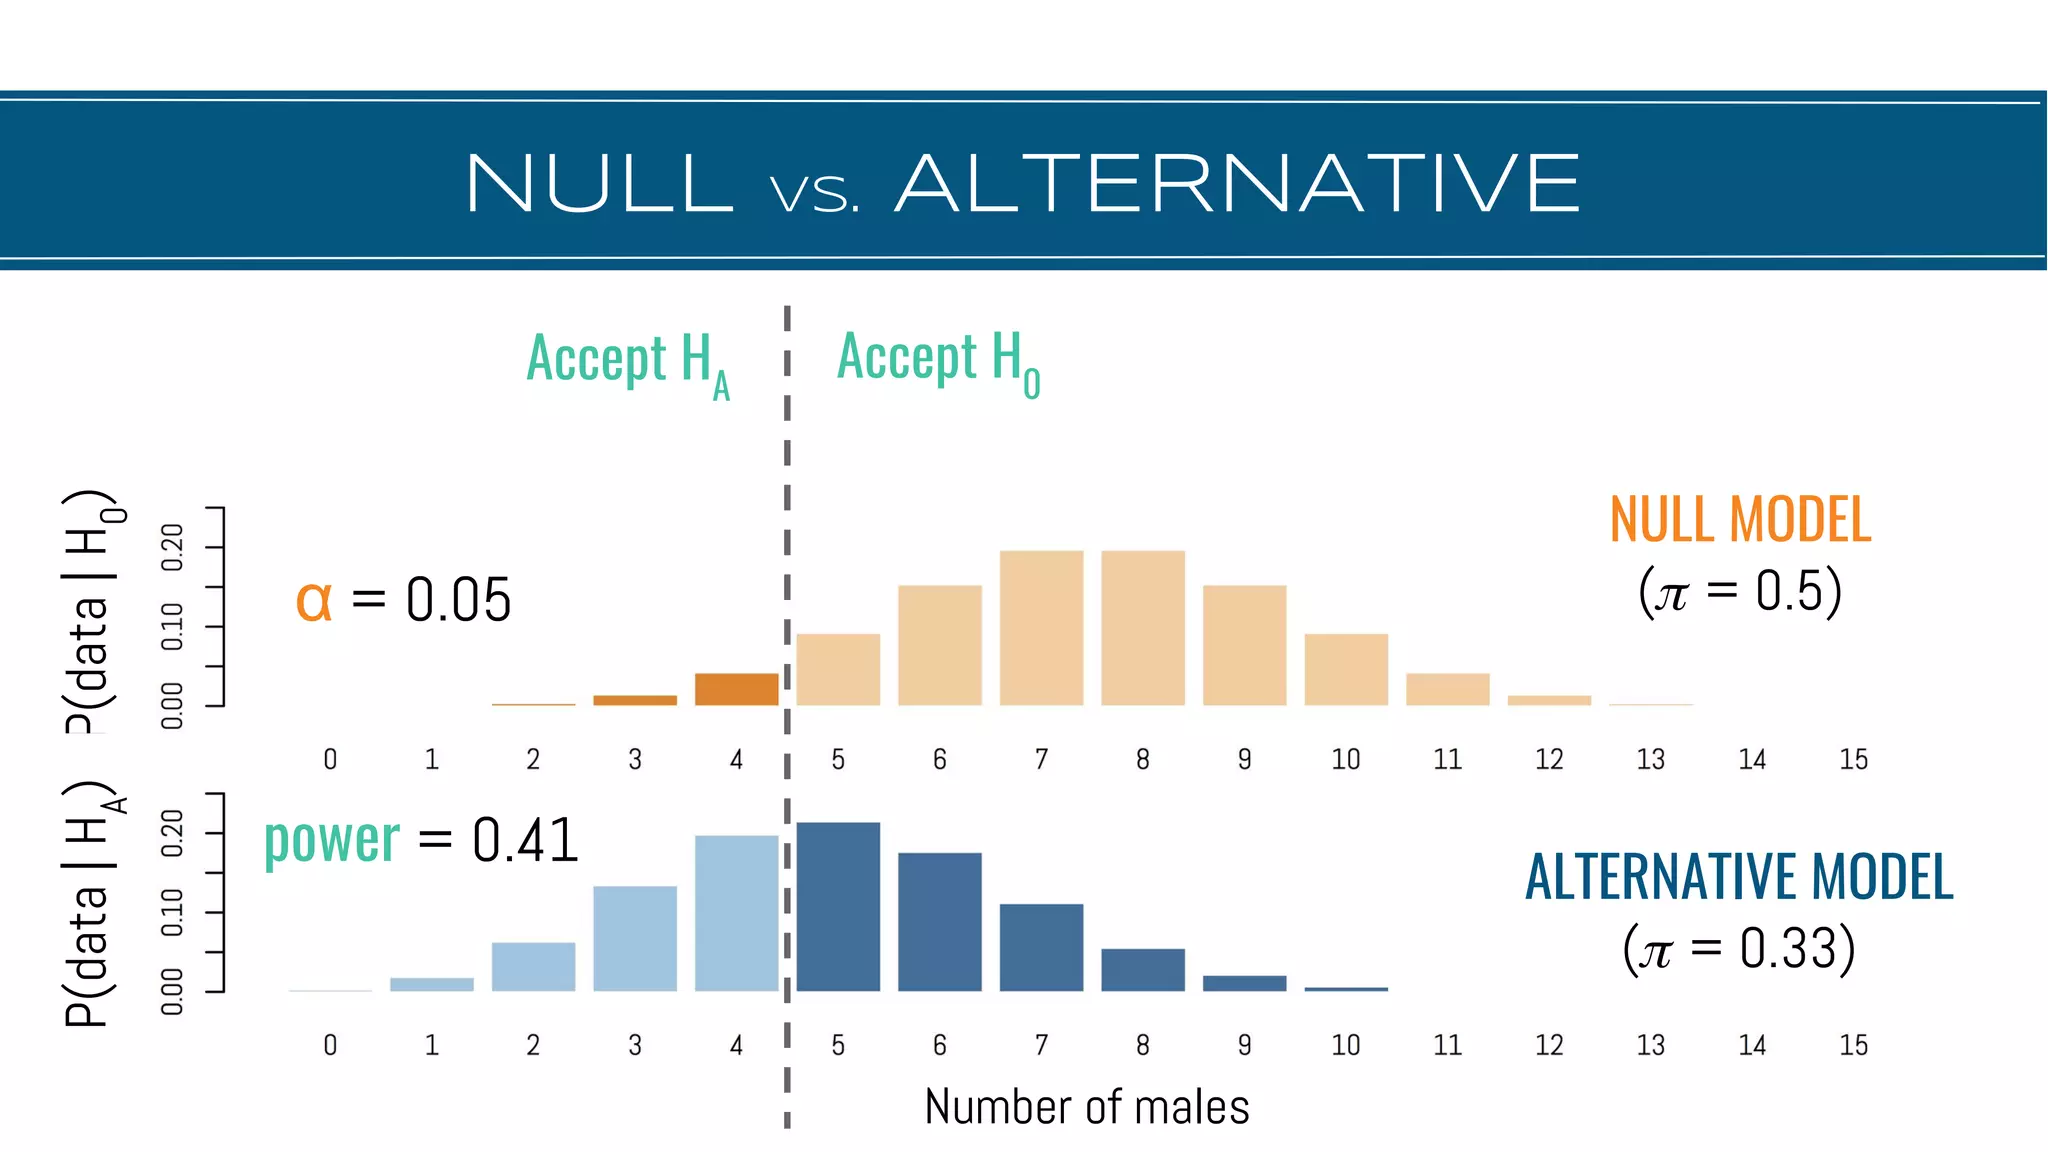
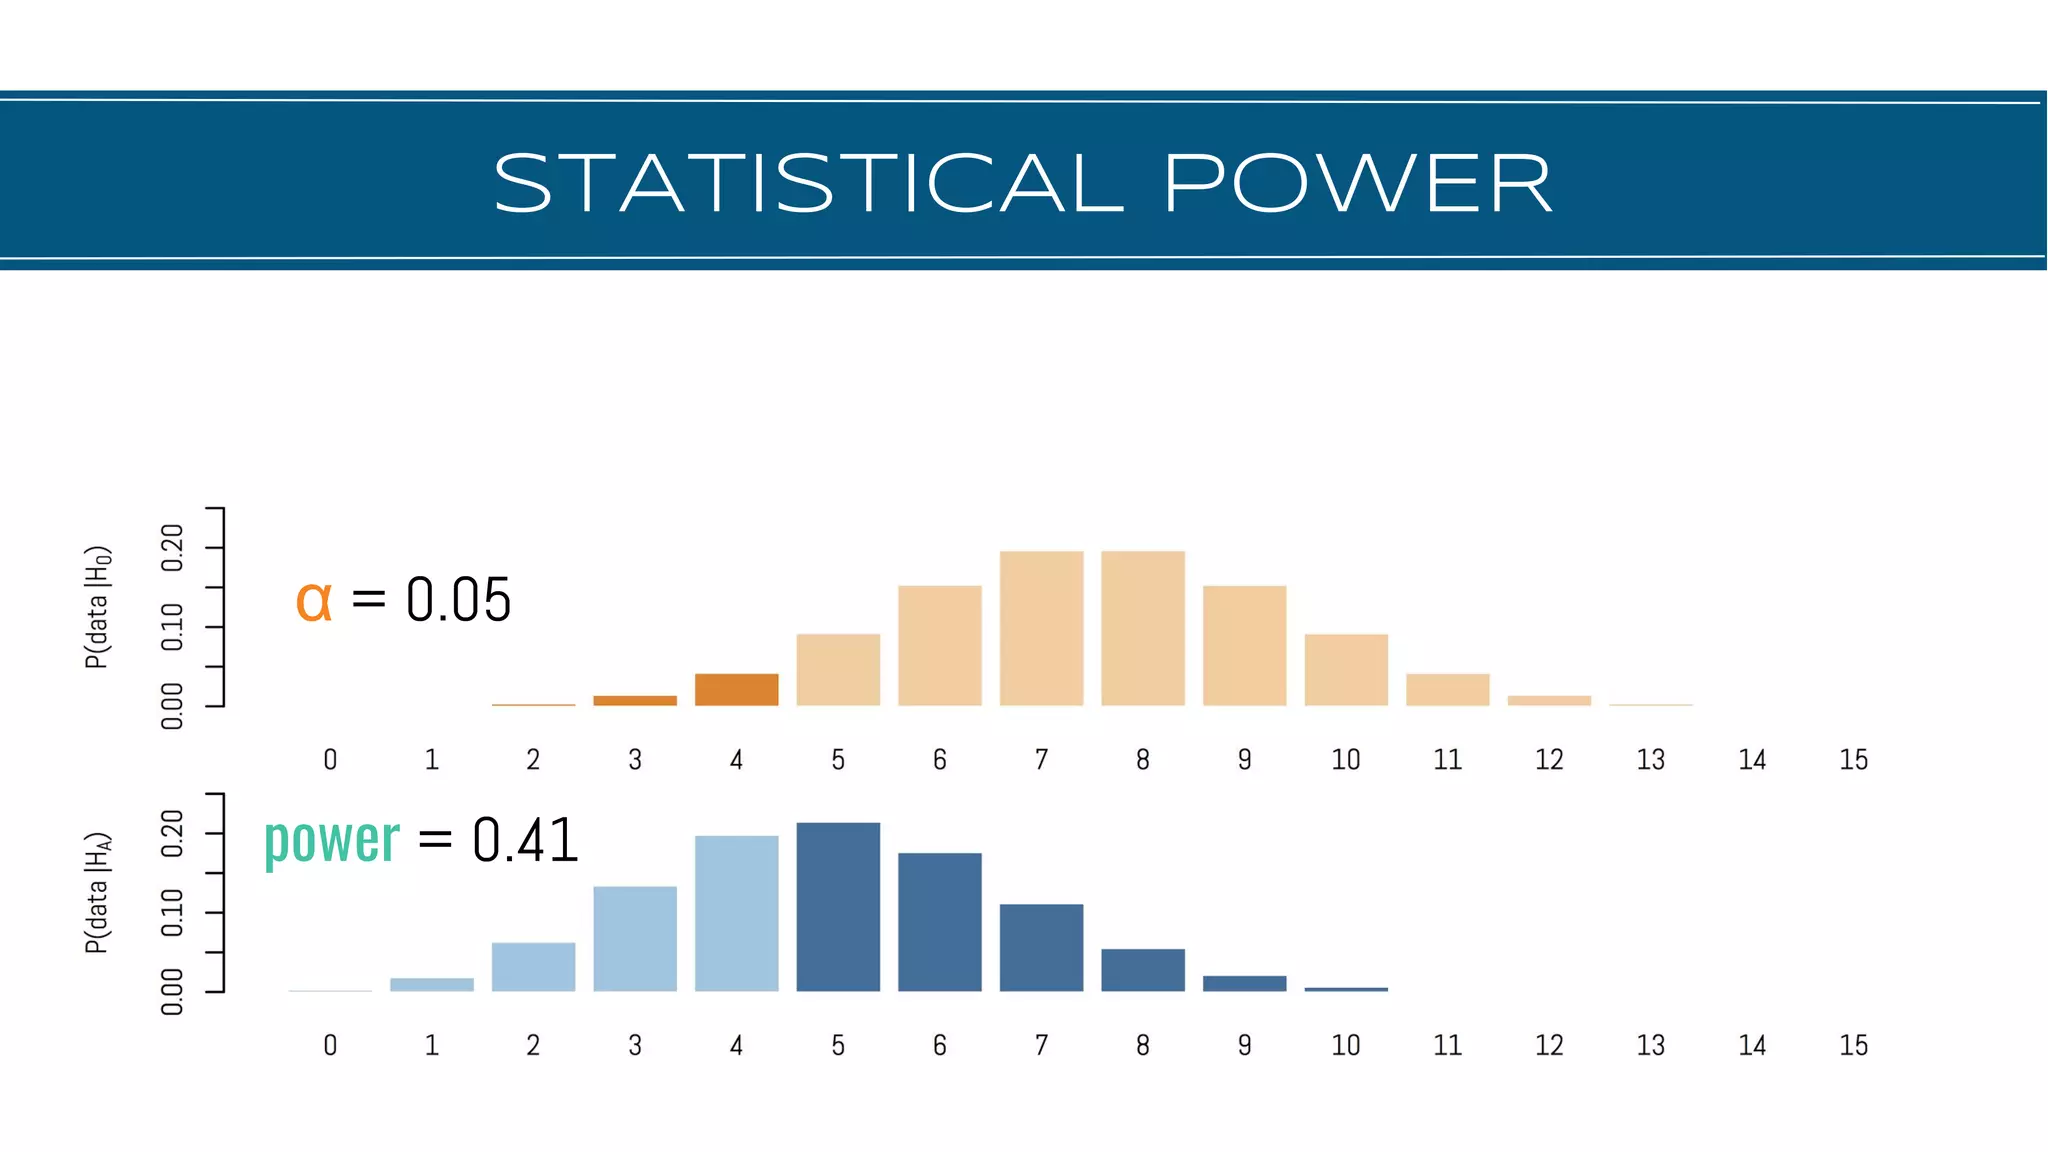
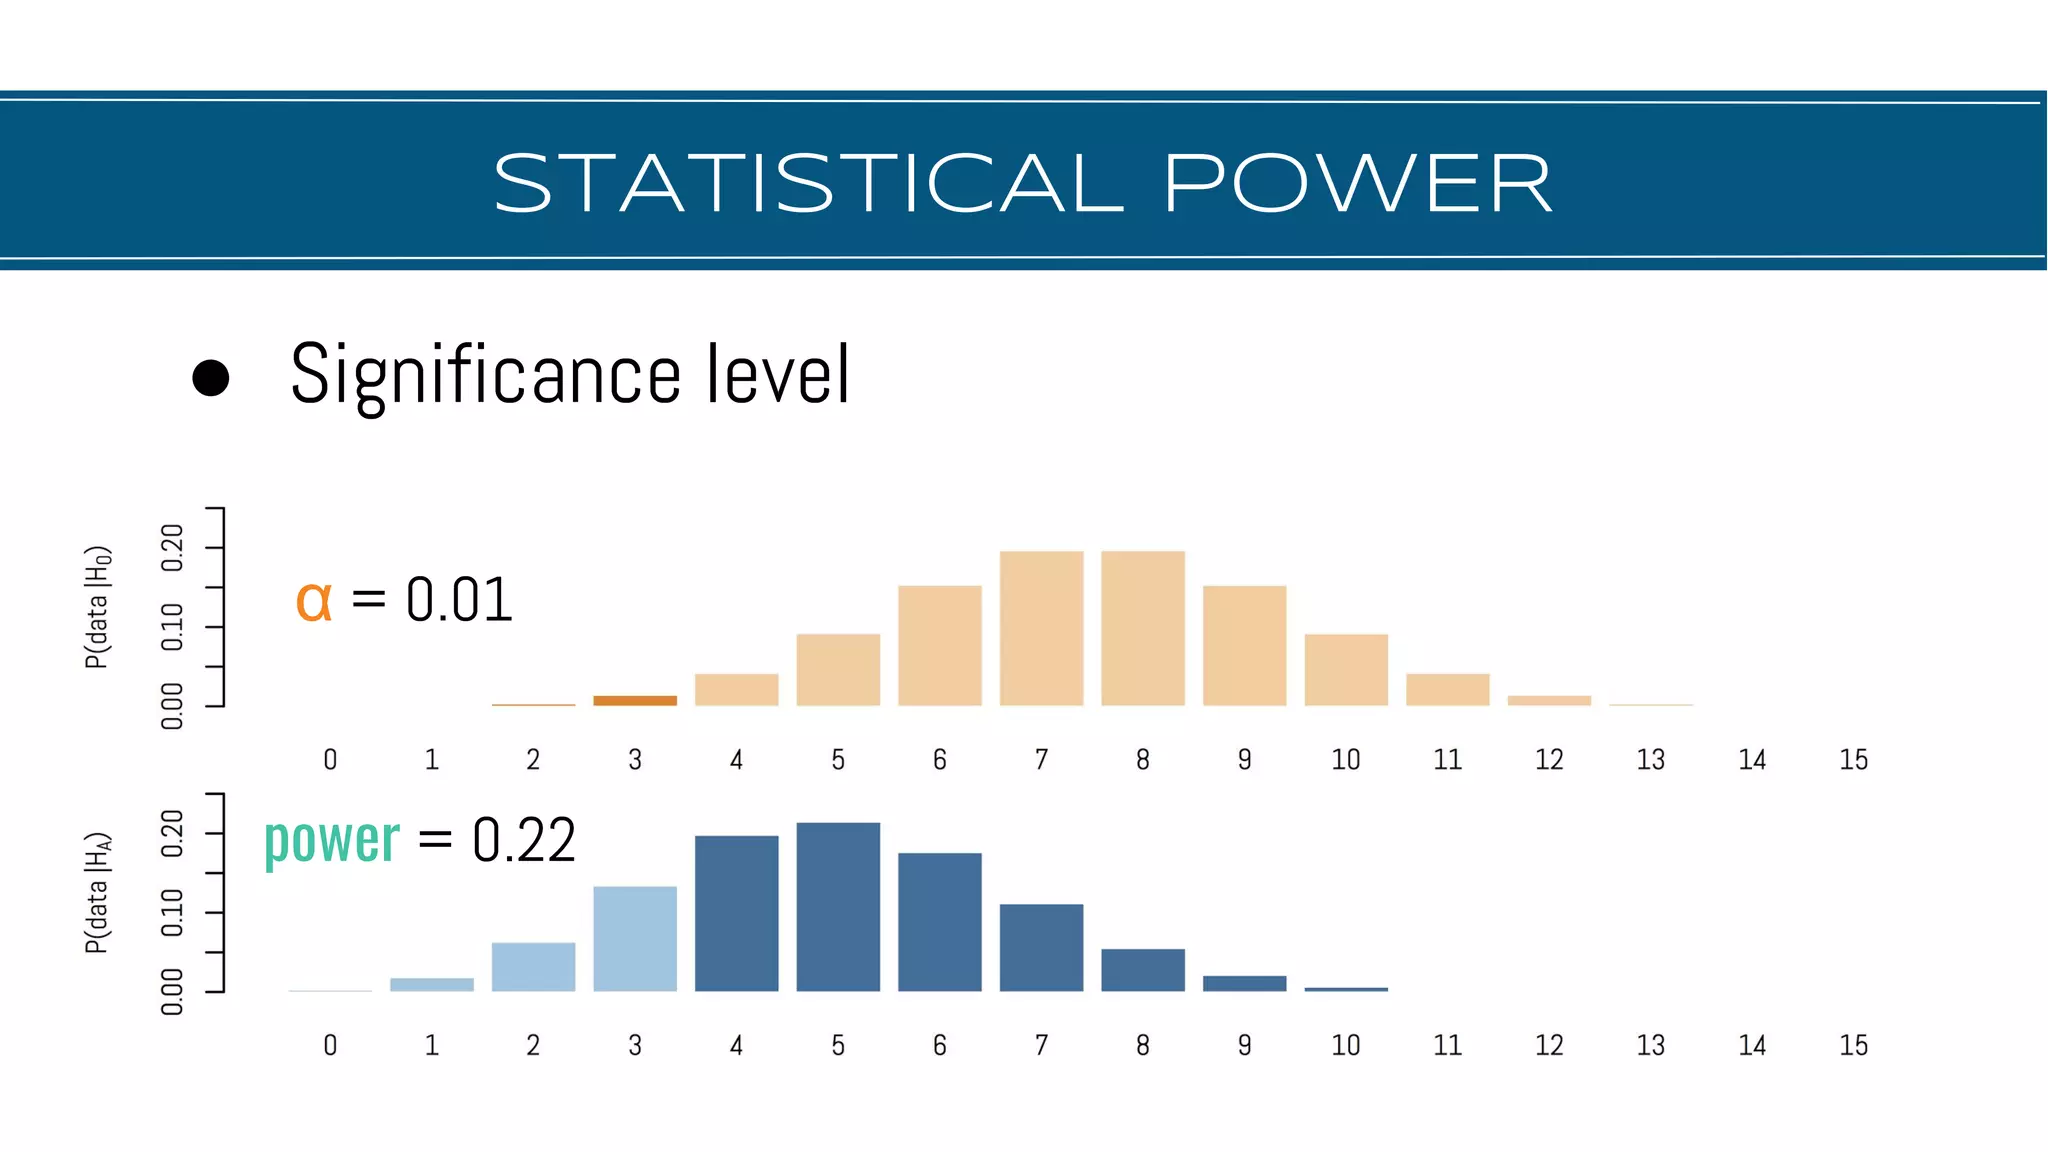
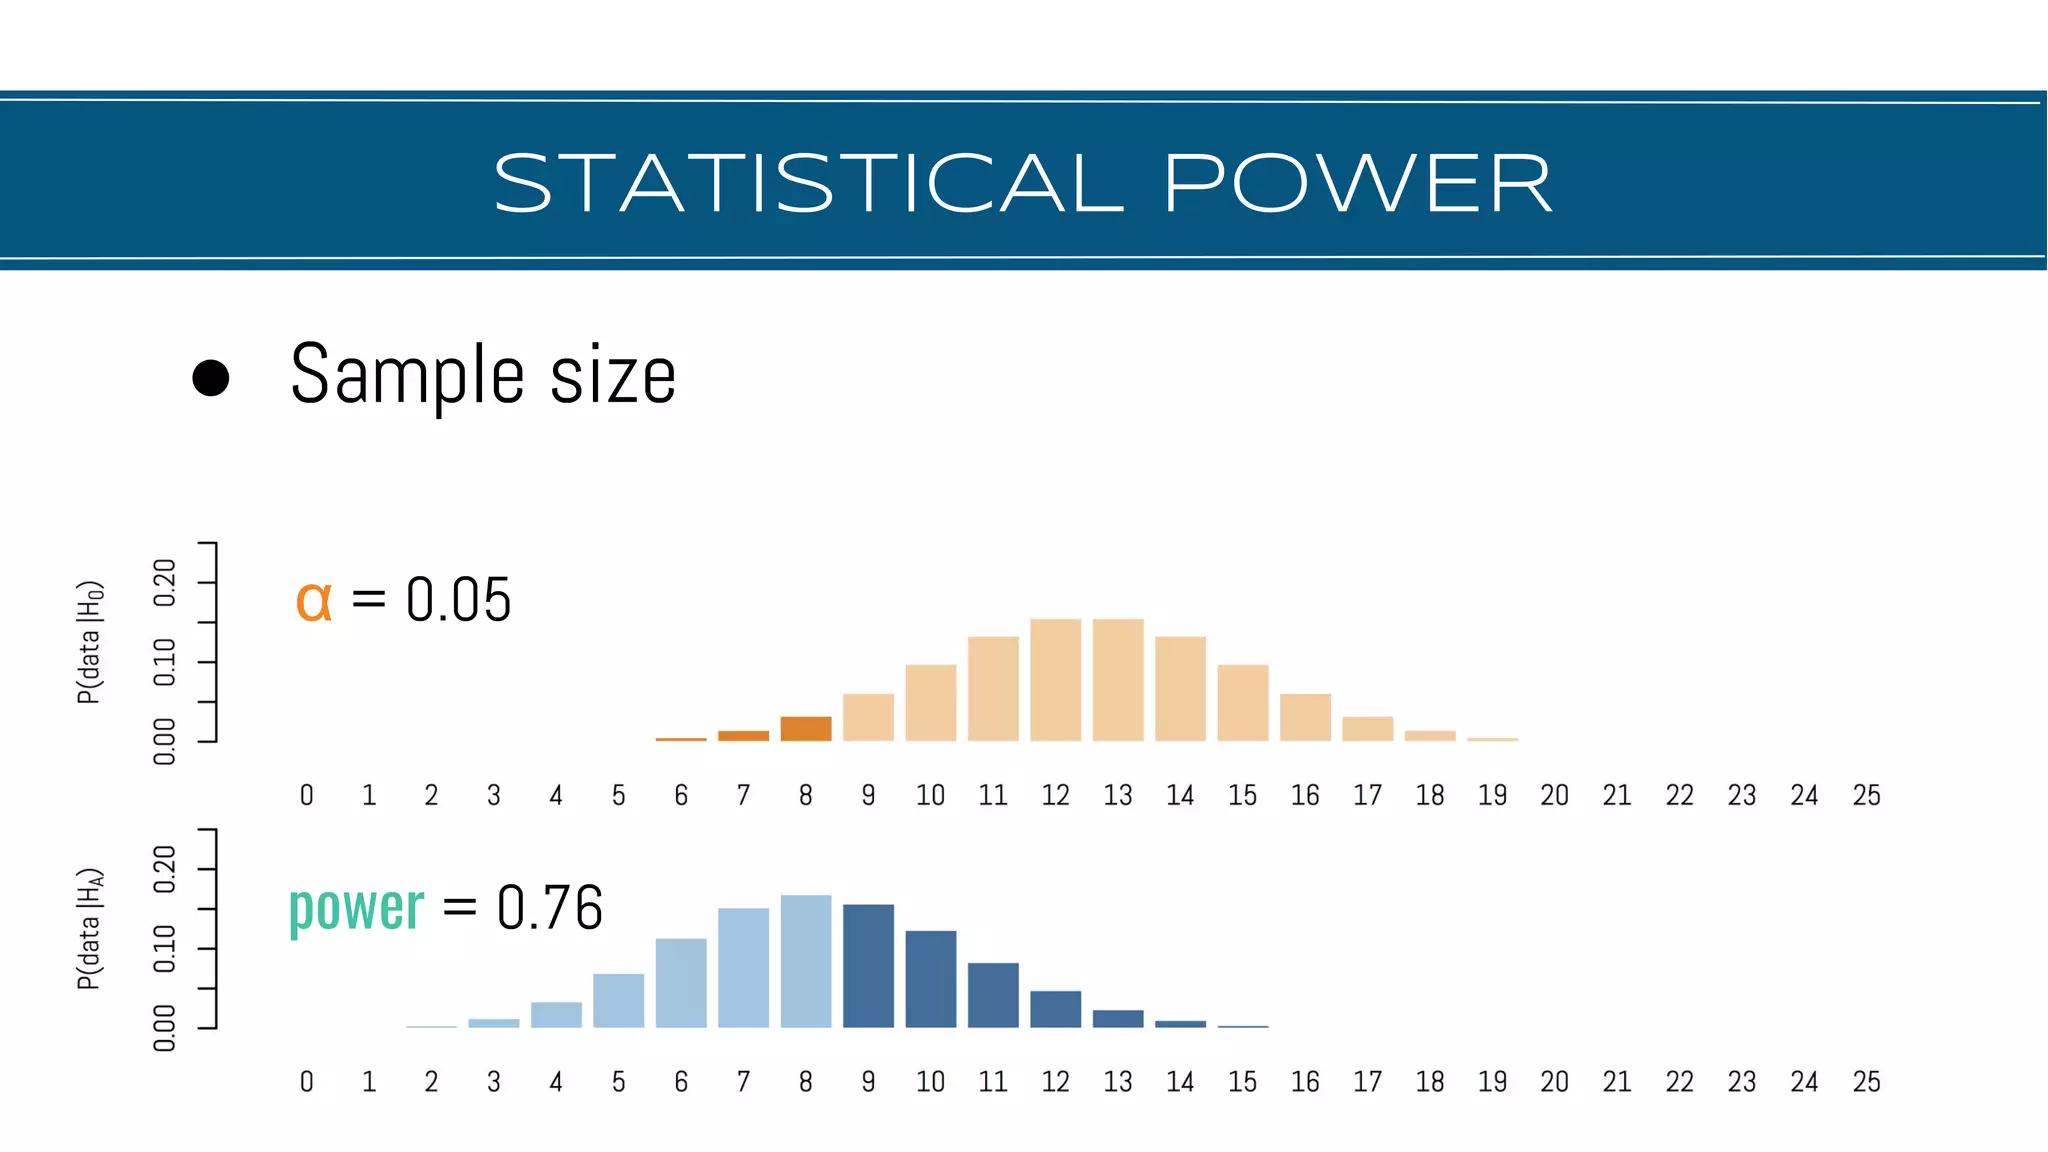
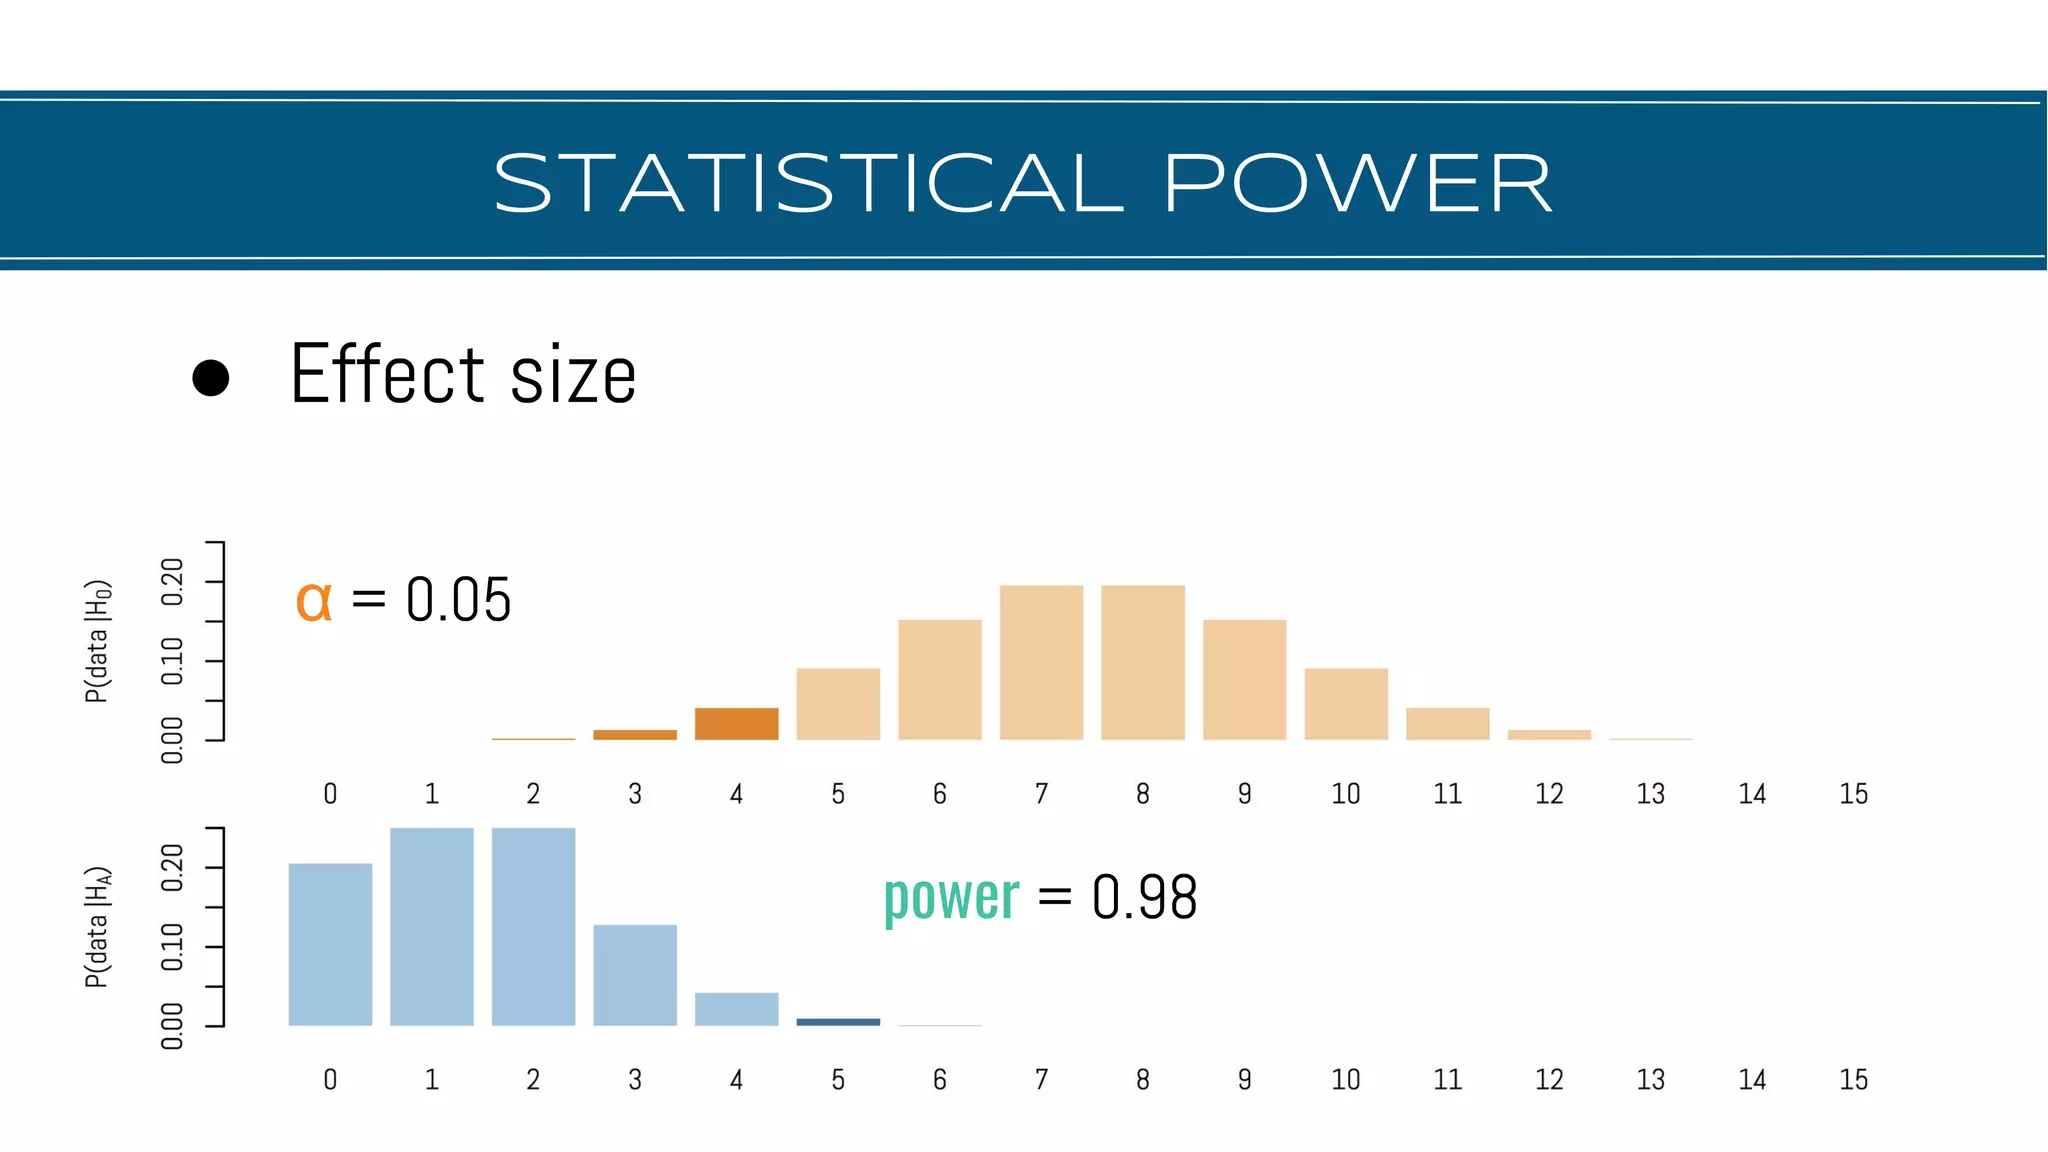
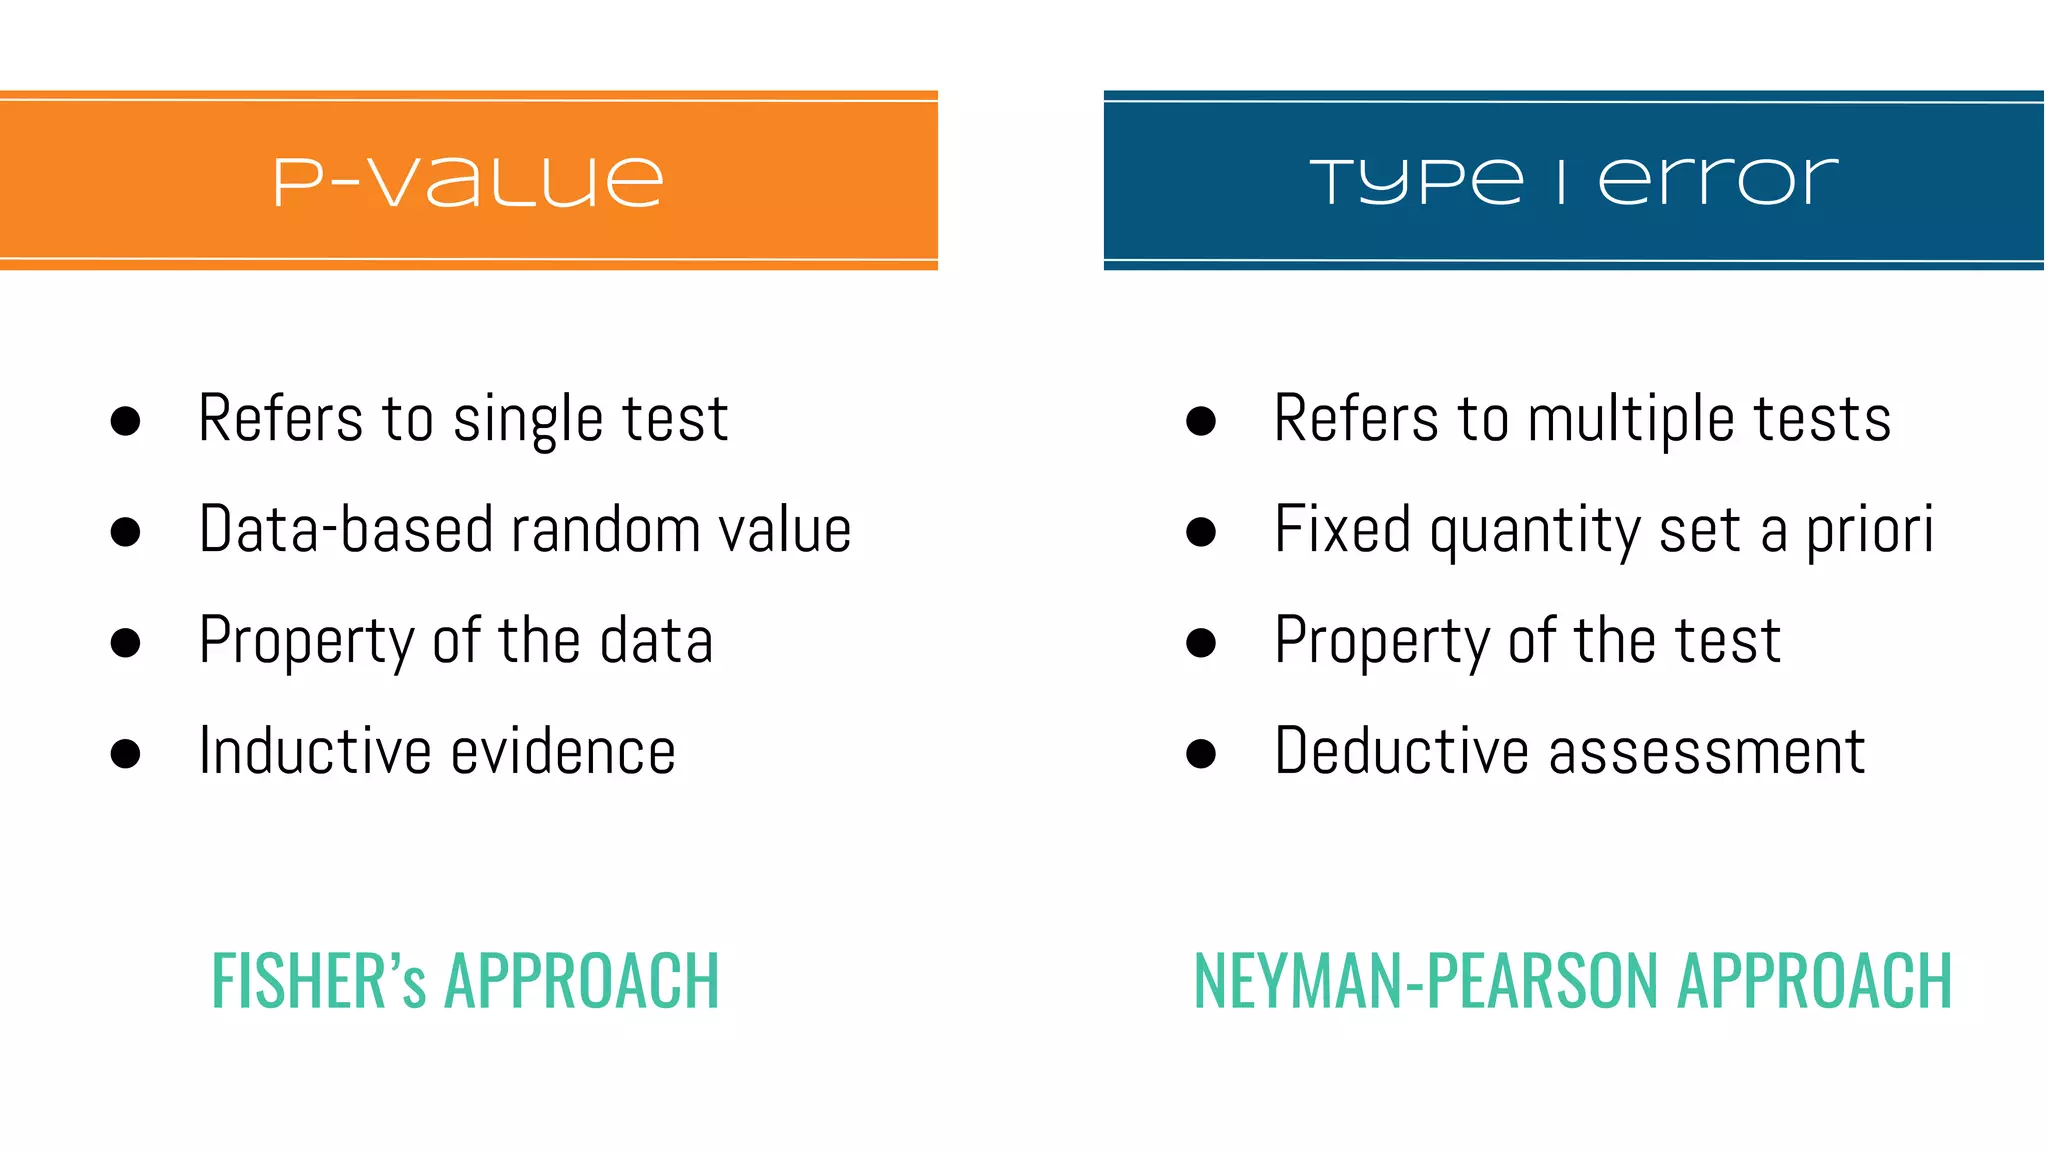
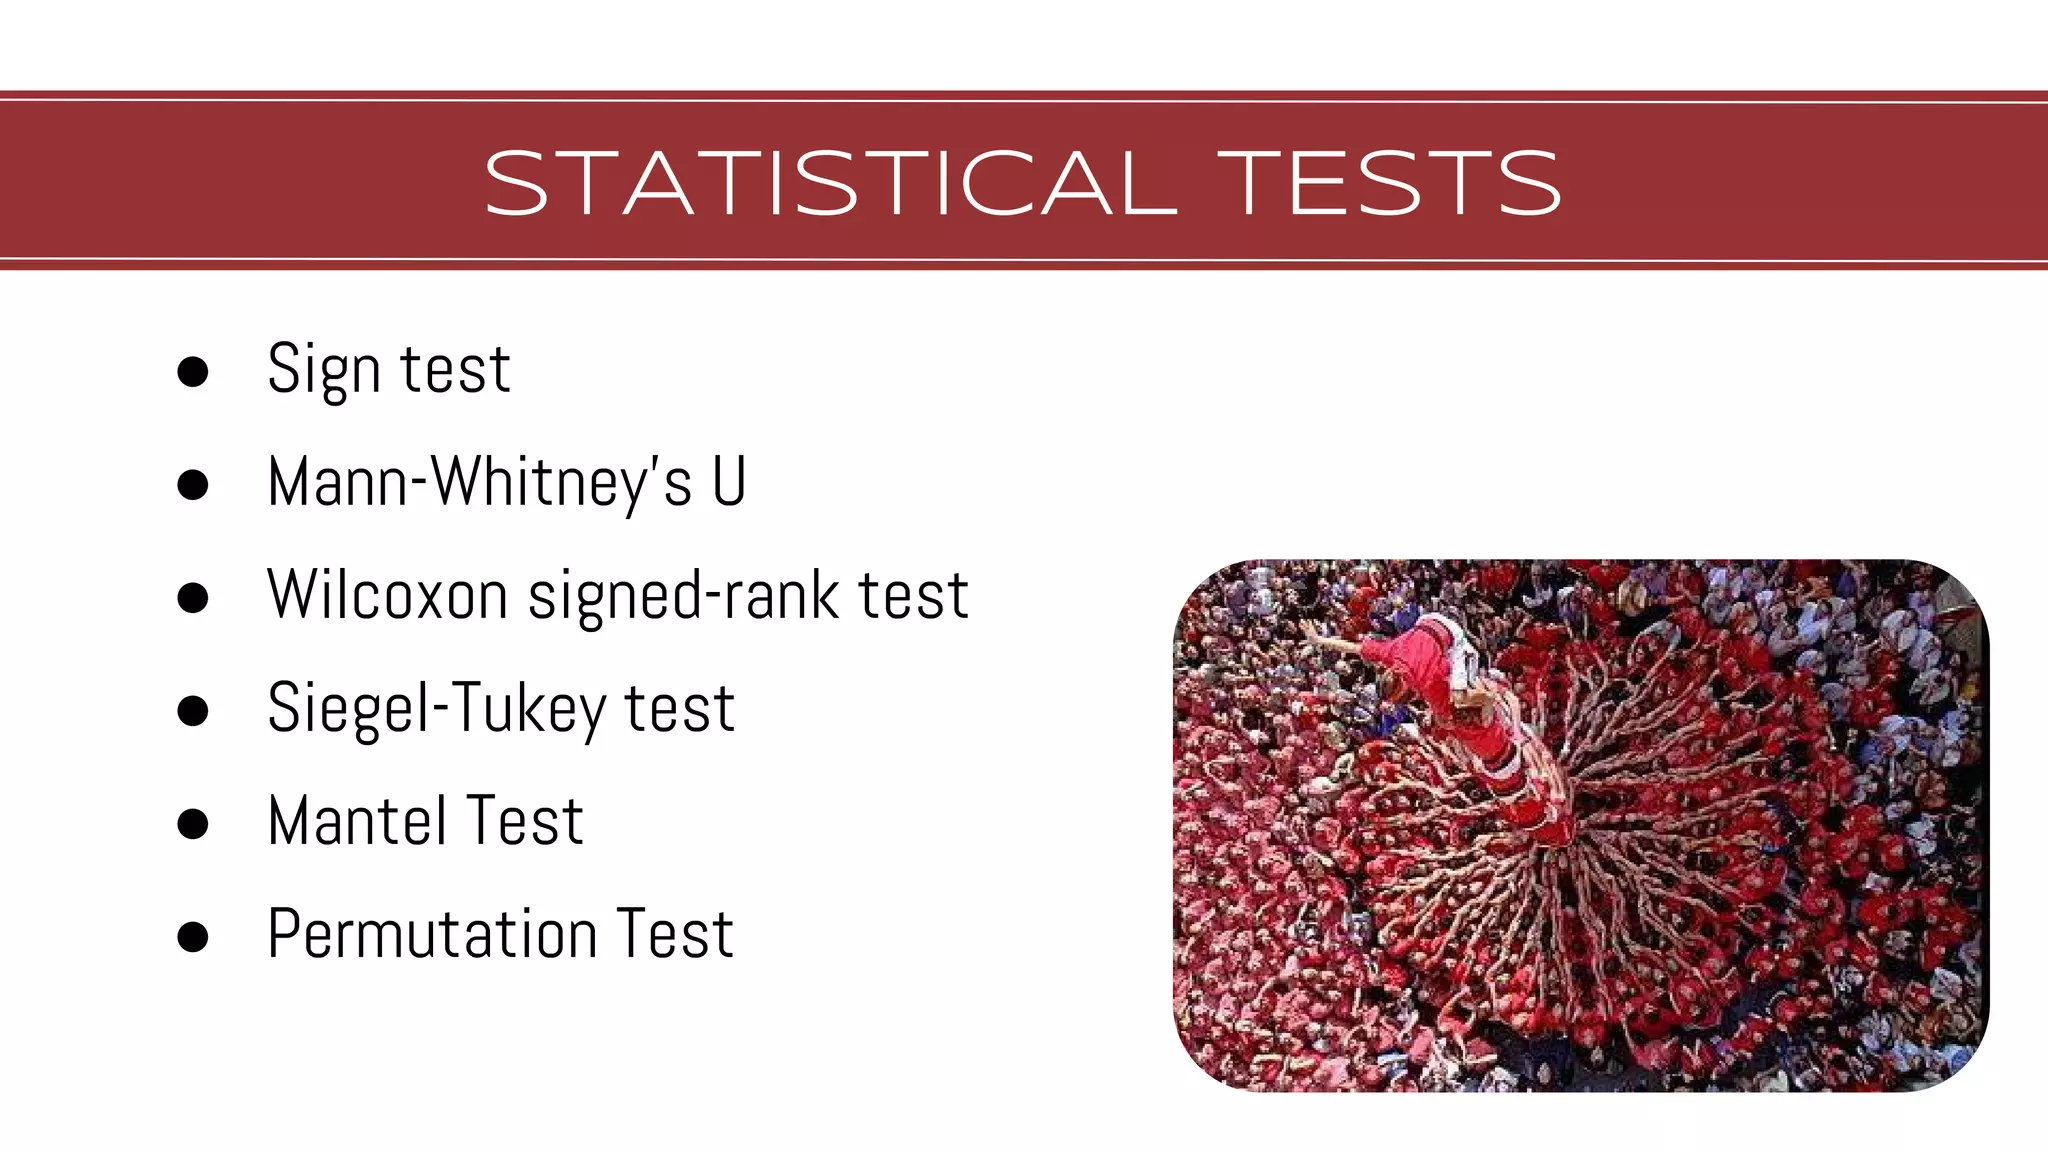
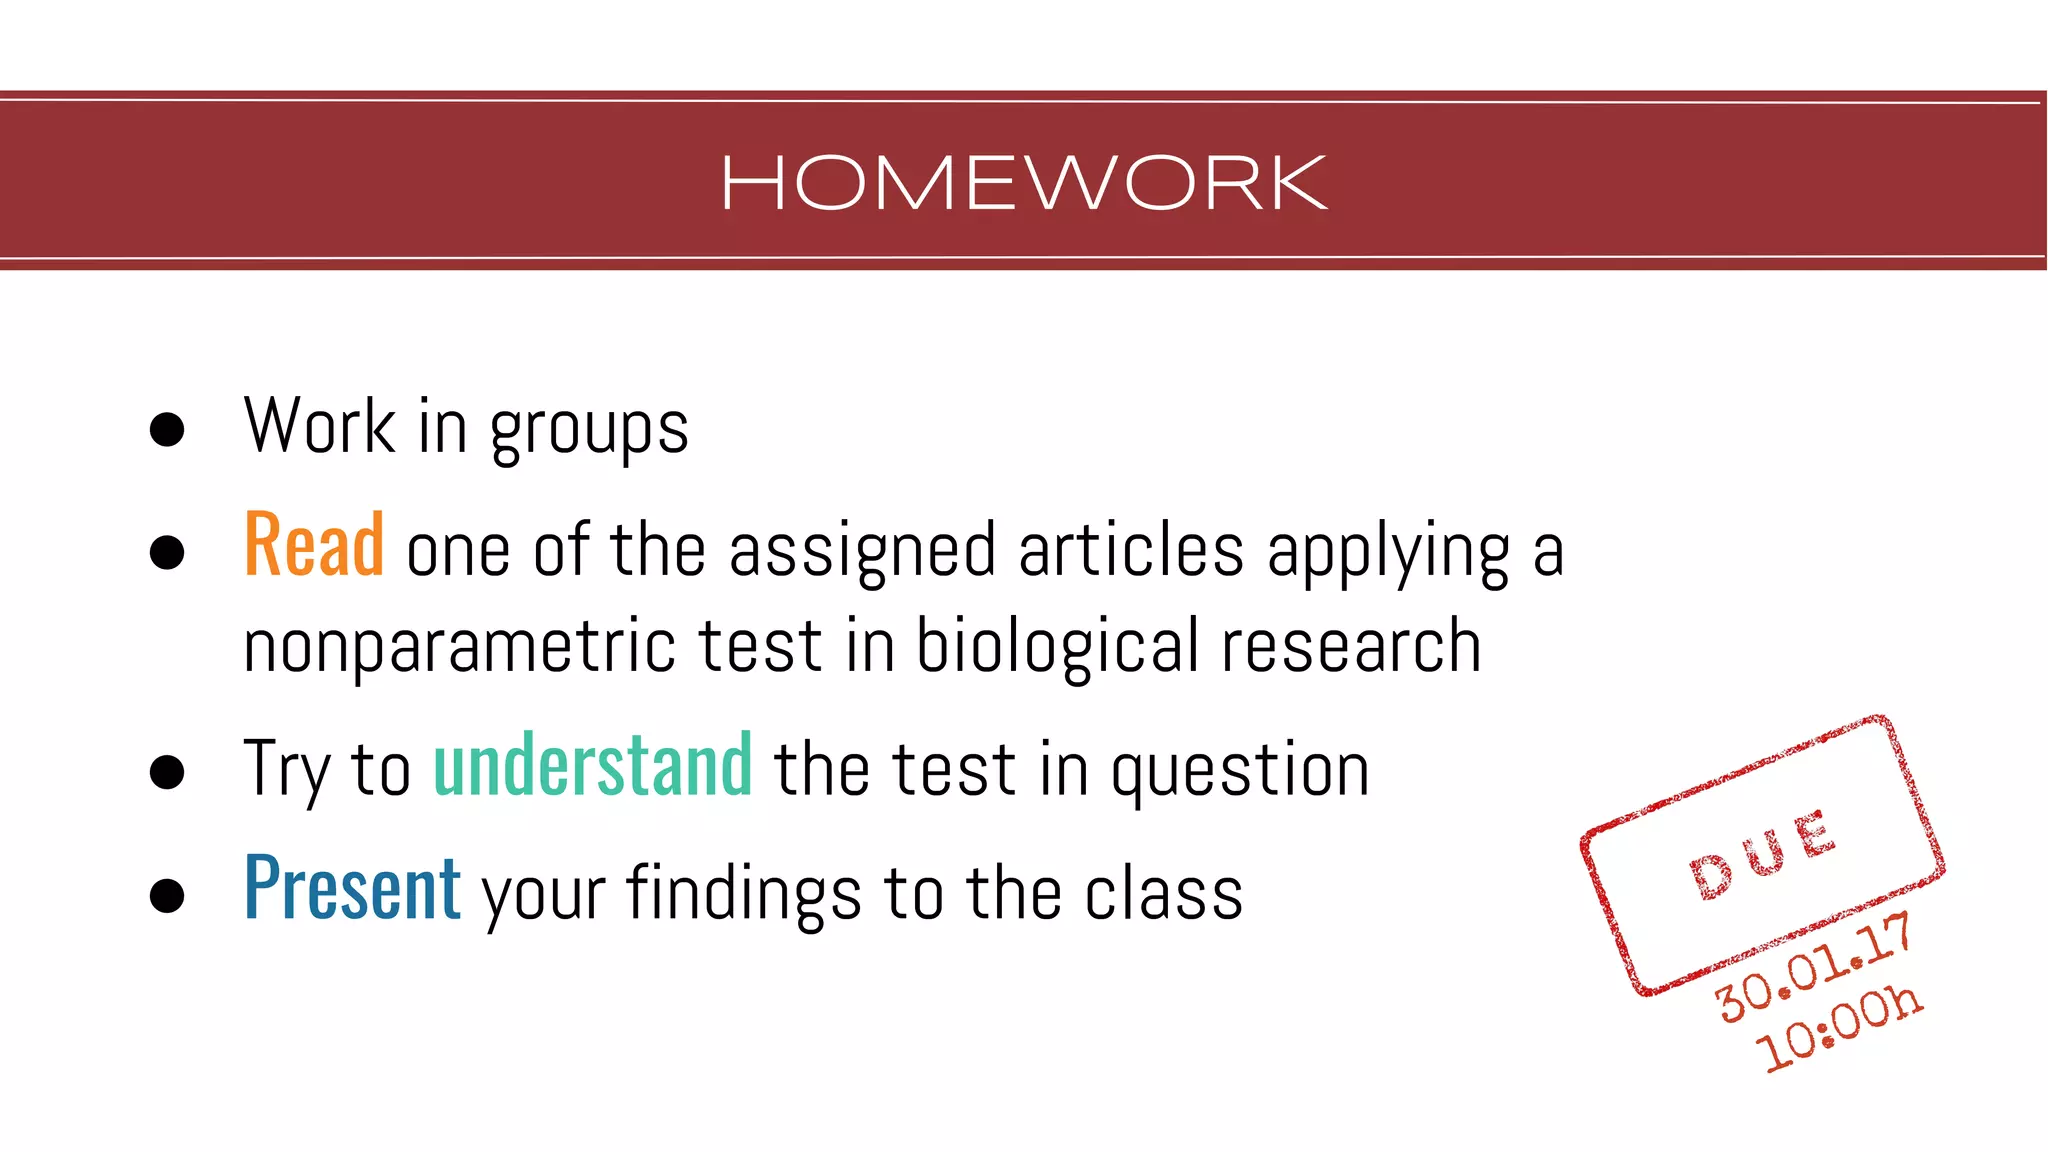
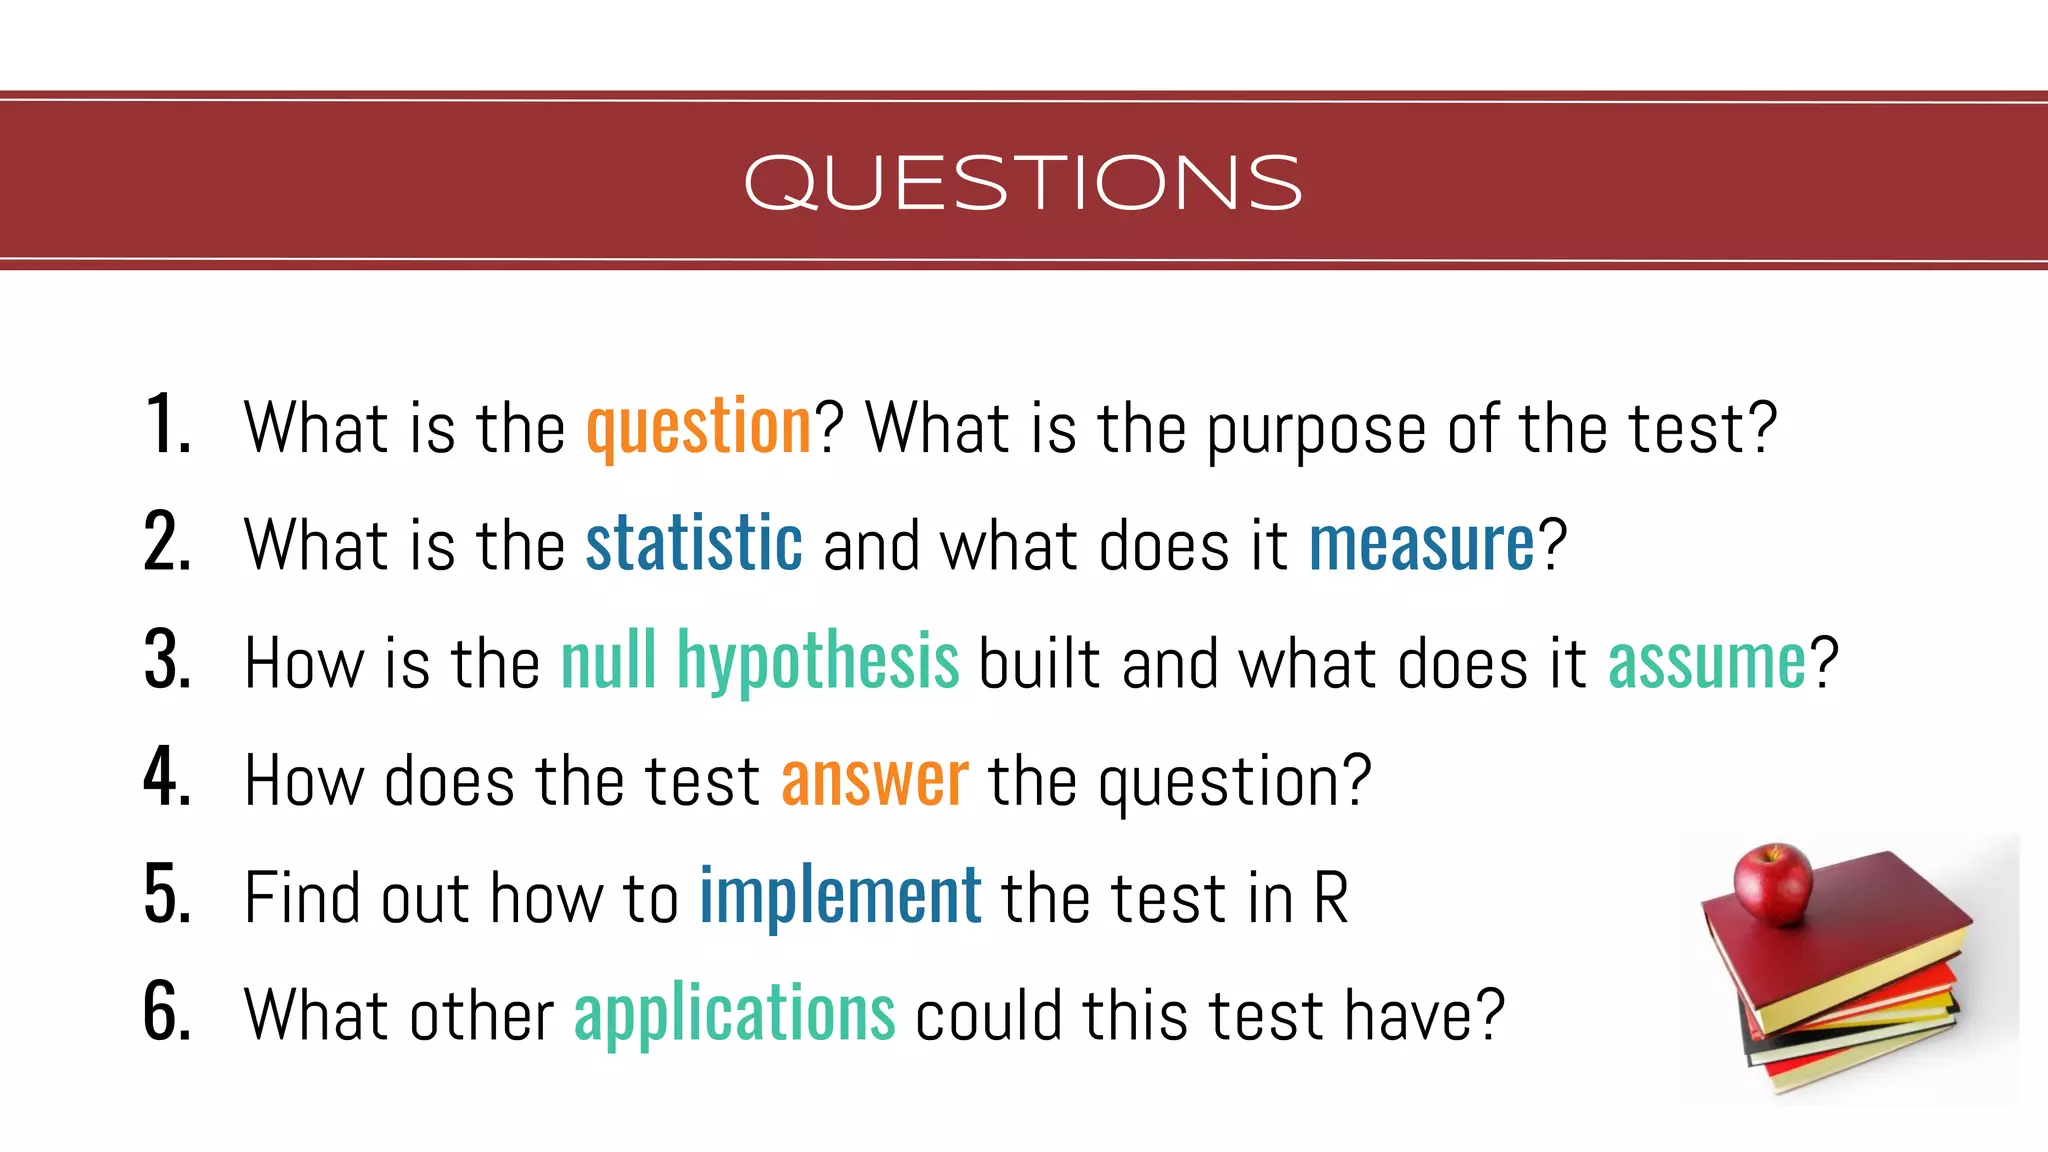
1. Science and Falsification
2. Significance Testing
- What is a p-value?
- How to build a Null Hypothesis
3. How about the Alternative Hypothesis?
- False Alarms and Power
Chapter 6 part2-Introduction to Inference-Tests of Significance, Stating Hyp...nszakir
Mathematics, Statistics, Introduction to Inference, Tests of Significance, The Reasoning of Tests of Significance, Stating Hypotheses, Test Statistics, P-values, Statistical Significance, Test for a Population Mean, Two-Sided Significance Tests and Confidence Intervals
Research methodology - Estimation Theory & Hypothesis Testing, Techniques of ...The Stockker
Fundamentals, Standard Error, Estimation, Interval Estimation, Hypothesis, Characteristics of Hypothesis, Testing The Hypothesis, Type I & Type II error, One tailed & Two tailed test, Tabulated Values, Chi-square (2) Test, Analysis of variance (ANOVA)Introduction, The Sign Test, The rank sum test or The Mann-Whitney U test, Determination of Sample Size
This presentation includes detailed information on Hypothesis testing for large and small samples, for two sample means. Briefed computational procedure with various case studies.
Statistical tests of significance and Student`s T-TestVasundhraKakkar
Statistical tests of significance is explained along with steps involve in Statistical tests of significance and types of significance test are also mentioned. Student`s T-Test is explained
SPSS does not have Z test for proportions, So, we use Chi-Square test for proportion tests. Test for single proportion and Test for proportions of two samples
2013.03.26 An Introduction to Modern Statistical Analysis using Bayesian MethodsNUI Galway
Dr Milovan Krnjajic, School of Mathematics, NUI Galway, presented this inaugural workshop on Modern Statistical Analysis using Bayesian Methods as part of the launch of the Social Sciences Computing Hub at the Whitaker Institute, NUI Galway on 26th March 2013.
Foundations of Statistics in Ecology and Evolution. 8. Bayesian StatisticsAndres Lopez-Sepulcre
1. Philosophy of Science and Bayes Theorem
2. Parameter estimation through MCMC
- Shopping for a Solution
- Is prior information subjective?
3. The beauty of (statistical) Marginalization
- Multiple parameters and Gibbs Sampling
- Estimating the unseen (latent variables)
Foundations in Statistics for Ecology and Evolution. 7. Variance StructuresAndres Lopez-Sepulcre
1. Restricting Freedom: REML
2. Heterocedasticity: When variances vary
3. The nature of non-Independence
- The Variance-Covariance Structure
- Hierarchical Models
- When is an effect random?
Foundations of Statistics for Ecology and Evolution. 6. Response VariablesAndres Lopez-Sepulcre
1. Extending the Linear Model: the GLM
- Using link functions: what do the parameters mean now?
2. Modeling the Diversity of Data
- Count Data
- Times and multiplicative processes
- The problem of analyzing ratios
3. To transform or not to transform data?
Foundations of Statistics for Ecology and Evolution. 5. Linear ModelsAndres Lopez-Sepulcre
1. Fitting: Least Squares vs Maximum Likelihood
2. Anatomy of the Linear Model
- Interpretation and significance of parameters
- The Design Matrix
3. Discrete factors and planned comparisons
Foundations of Statistics for Ecology and Evolution. 4. Maximum LikelihoodAndres Lopez-Sepulcre
1. Maximum Likelihood Estimation
- The abductive method
- How to fit a model to data
2. Calculating parameter Uncertainty
3. Comparing Multiple Hypotheses
- Alternatives beyond rejection
- Parsimony and information
Foundations of Statistics for Ecology and Evolution. 1 Introduction.Andres Lopez-Sepulcre
PHILOSOPHICAL FOUNDATIONS
1. The Nature Scientific Inference
2. Statistical Models
-The mathematical beauty of nature
-The messy part: what is a Probability?
3. Integrating Models and Data
SAMPLING
1. The Nature of Induction
2. Statistical Inference
- Describing the Data
- Estimating the Truth
3. Error and Bias
Beyond Lifetime Reproductive Success: The posthumous reproductive dynamics of...Andres Lopez-Sepulcre
Talk on the use of State-Space Capture-Recapture models and Matrix Analysis to understand the dynamics of posthumous reproduction in guppies. Guppy females store male sperm, which means that males can produce offspring after death.
Welcome to TechSoup New Member Orientation and Q&A (May 2024).pdfTechSoup
In this webinar you will learn how your organization can access TechSoup's wide variety of product discount and donation programs. From hardware to software, we'll give you a tour of the tools available to help your nonprofit with productivity, collaboration, financial management, donor tracking, security, and more.
How to Split Bills in the Odoo 17 POS ModuleCeline George
Bills have a main role in point of sale procedure. It will help to track sales, handling payments and giving receipts to customers. Bill splitting also has an important role in POS. For example, If some friends come together for dinner and if they want to divide the bill then it is possible by POS bill splitting. This slide will show how to split bills in odoo 17 POS.
The Roman Empire A Historical Colossus.pdfkaushalkr1407
The Roman Empire, a vast and enduring power, stands as one of history's most remarkable civilizations, leaving an indelible imprint on the world. It emerged from the Roman Republic, transitioning into an imperial powerhouse under the leadership of Augustus Caesar in 27 BCE. This transformation marked the beginning of an era defined by unprecedented territorial expansion, architectural marvels, and profound cultural influence.
The empire's roots lie in the city of Rome, founded, according to legend, by Romulus in 753 BCE. Over centuries, Rome evolved from a small settlement to a formidable republic, characterized by a complex political system with elected officials and checks on power. However, internal strife, class conflicts, and military ambitions paved the way for the end of the Republic. Julius Caesar’s dictatorship and subsequent assassination in 44 BCE created a power vacuum, leading to a civil war. Octavian, later Augustus, emerged victorious, heralding the Roman Empire’s birth.
Under Augustus, the empire experienced the Pax Romana, a 200-year period of relative peace and stability. Augustus reformed the military, established efficient administrative systems, and initiated grand construction projects. The empire's borders expanded, encompassing territories from Britain to Egypt and from Spain to the Euphrates. Roman legions, renowned for their discipline and engineering prowess, secured and maintained these vast territories, building roads, fortifications, and cities that facilitated control and integration.
The Roman Empire’s society was hierarchical, with a rigid class system. At the top were the patricians, wealthy elites who held significant political power. Below them were the plebeians, free citizens with limited political influence, and the vast numbers of slaves who formed the backbone of the economy. The family unit was central, governed by the paterfamilias, the male head who held absolute authority.
Culturally, the Romans were eclectic, absorbing and adapting elements from the civilizations they encountered, particularly the Greeks. Roman art, literature, and philosophy reflected this synthesis, creating a rich cultural tapestry. Latin, the Roman language, became the lingua franca of the Western world, influencing numerous modern languages.
Roman architecture and engineering achievements were monumental. They perfected the arch, vault, and dome, constructing enduring structures like the Colosseum, Pantheon, and aqueducts. These engineering marvels not only showcased Roman ingenuity but also served practical purposes, from public entertainment to water supply.
Students, digital devices and success - Andreas Schleicher - 27 May 2024..pptxEduSkills OECD
Andreas Schleicher presents at the OECD webinar ‘Digital devices in schools: detrimental distraction or secret to success?’ on 27 May 2024. The presentation was based on findings from PISA 2022 results and the webinar helped launch the PISA in Focus ‘Managing screen time: How to protect and equip students against distraction’ https://www.oecd-ilibrary.org/education/managing-screen-time_7c225af4-en and the OECD Education Policy Perspective ‘Students, digital devices and success’ can be found here - https://oe.cd/il/5yV
2. HYPOTHESIS TESTING
1. Science and Falsification
2. Significance Testing
2.1. What is a p-value?
2.2. How to build a Null Hypothesis
3. How about the Alternative Hypothesis?
3.1. False Alarms and Power
3. FALSIFICATIONISM
● Denying the consequent (modum tollens)
((P → Q) ^ ¬Q) → ¬P
(model → data) ^ ¬data) → ¬model
● Models can only be disproven
● Not explicitly probabilistic
4. STATISTICAL FALSIFICATIONISM
● Data is a consequence of the true model
● That consequence is probabilistic
Likelihood (Model) = P(Data | Model)
● Model unlikely if data obtained would have low
probability under that model.
6. TEST INGREDIENTS
● A hypothesis to reject: the null model (H0
)
● Some data
● A summary of the data: a statistic
● A way to calculate the probability
distribution of the statistic given H0
NULL HYPOTHESIS SIGNIFICANCE TESTING
8. NHST
Null model (H0
)
Parameter
Data (X)
Statistic
Probability
Null model (H0
) Lady can’t tell the difference
Parameter Probability of mistake (pm
= 0.5)
Data (X) 1 mistake out of 10 (n = 10)
Statistic Proportion of mistakes (Pm
=0.1)
Probability What is the probability of 1/10 mistakes
if H0
is true and pm
= 0.5?
11. pr
(1-p)n-rn!
r! (n-r)!P(r, n | p ) =
What is the probability of making
r mistakes out of n trials given p?
p = probability of mistake r = number of mistakes
n = number of trials
12. The BINOMIAL TEST
Probability of 1 or less
mistakes= 0.0107
IF H0
(pm
= 0.5)
p-value
0.0009
0.0098
0.0439
0.1171
0.2051
0.2461
0.1171
0.2051
0.0439
0.0098
0.0009
14. P-vALUES
● NOT the probability of the null hypothesis being true
● NOT applicable to all distributions
15. P-vALUES
● NOT the probability of the null hypothesis being true
● NOT applicable to all distributions
● NOT a measure of effect size or importance
16. NHST
Null model (H0
) Lady can’t tell the difference
Parameter Probability of mistake (pm
= 0.5)
Data (X) 450 mistakes out of 1000 (n = 1000)
Statistic Proportion of mistakes (Pm
= 0.45)
P-value What is the probability of making
≤ 450/1000 mistakes if pm
= 0.5?
18. P-vALUES
● NOT the probability of the null hypothesis being true
● NOT applicable to all distributions
● NOT a measure of effect size or importance
● ANY effect will be significant given enough data
19. SIGNIFICANCE VS. MAGNITUDE
10% mistakes
p = 0.0008p = 0.0107
45% mistakes
How good is 0.45?
What would be the a
better null hypothesis?
20. NHST
Null model (H0
) One in three mistakes
Parameter Probability of mistake (pm
= 0.33)
Data (X) 1 mistake out of 10 (n = 10)
Statistic Proportion of mistakes (Pm
=0.1)
P-value What is the probability of making
≤1/10 mistakes if pm
= 0.33?
25. RANDOMIZATION
1. Draw a random sample
2. Calculate statistic
3. Do it many times
re
= 40.2 re
= 47.2 re
= 58.7 re
= 56.1 re
= 44.4 re
= 51.4
26. RANDOMIZATION
1. Draw a random sample
2. Calculate statistic
3. Do it many times
re
= 40.2 re
= 47.2 re
= 58.7 re
= 56.1 re
= 44.4 re
= 51.4
27. RANDOMIZATION
1. Draw a random sample
2. Calculate statistic
3. Do it many times
4. Distribution of those statistics
Distribution of the test statistic (re
)
under the NULL HYPOTHESIS
30. P-vALUES
● NOT the probability of the null hypothesis being true
● NOT applicable to all distributions
● NOT a measure of effect size or importance
● NOT appropriate for modeling rare events
31. What is the probability of a Scientist winning a (science)
Nobel Prize?
P(Nobel | Scientist) = 0.00001
Marie Curie won 2 Nobel Prizes
p-value = P(≥2 Nobel | Scientist) ≅ 0.00000000001
Therefore, Marie Curie is unlikely to be a Scientist?
WHY IS THIS WRONG?
32. CONSIDERING the ALTERNATIVE
Probability of a Scientist winning a Nobel Prize?
P(2 Nobel | Scientist) = 0.000012
P(2 Nobel |¬ Scientist) ≅ 0.000000000012
Likelihood of
being a scientist
Likelihood of
NOT being a scientist
LIKELIHOOD RATIO = = 1012
0.000000000012
0.000012
33. NULL vs. ALTERNATIVE
H0
is true Ha
is true
Accept H0 ✓ Type II error
Accept Ha
Type I error ✓
● Consider both a NULL and an ALTERNATIVE hypothesis
34. NULL vs. ALTERNATIVE
H0
is true Ha
is true
Accept H0
1 − α 1 − β
Accept Ha
α β
False Positives
You’re
pregnant
POWER
37. Null model (H0
) Even sex ratio (1:1)
Parameter Probability of producing a male ( = 0.5)
Data (X) Number of males and females (n = 15)
Statistic Proportion of males
Probability
inspired by
Hamilton 1967.
Science
38. Null model (H0
) Even sex ratio (1:1)
Parameter Probability of producing a male ( = 0.5)
Data (X) Number of males and females (n = 15)
Statistic Proportion of males
Alternative (HA
)
Model
inspired by
Hamilton 1967.
Science
39. Null model (H0
) Even sex ratio (1:1)
Parameter Probability of producing a male ( = 0.5)
Data (X) Number of males and females (n = 15)
Statistic Proportion of males
Alternative (HA
) Biased sex ratio (1:2)
Model Probability of producing a male ( = 0.33)
inspired by
Hamilton 1967.
Science
41. NULL vs. ALTERNATIVE
α = 0.05
P(data|H0
)
critical
value
NULL MODEL
( = 0.5)
Number of males
Accept HA
Accept H0
42. NULL vs. ALTERNATIVE
α = 0.05
P(data|H0
)
NULL MODEL
( = 0.5)
power = 0.41
Number of males
ALTERNATIVE MODEL
( = 0.33)
Accept HA
Accept H0
P(data|HA
)
48. Type I errorp-value
● Refers to single test
● Data-based random value
● Property of the data
● Inductive evidence
● Refers to multiple tests
● Fixed quantity set a priori
● Property of the test
● Deductive assessment
FISHER’s APPROACH NEYMAN-PEARSON APPROACH
52. HOMEWORK
● Work in groups
● Read one of the assigned articles applying a
nonparametric test in biological research
● Try to understand the test in question
● Present your findings to the class
30.01.17
10:00h
53. QUESTIONS
1. What is the question? What is the purpose of the test?
2. What is the statistic and what does it measure?
3. How is the null hypothesis built and what does it assume?
4. How does the test answer the question?
5. Find out how to implement the test in R
6. What other applications could this test have?
55. EvALUATION
● Questions: Relate lecture concepts to the new test
● Delivery: Quality and clarity of the presentation
● Discussion: Both asking and answering questions
● Group-level AND individual-level
Group work ≠ Dividing tasks
(except in presenting)