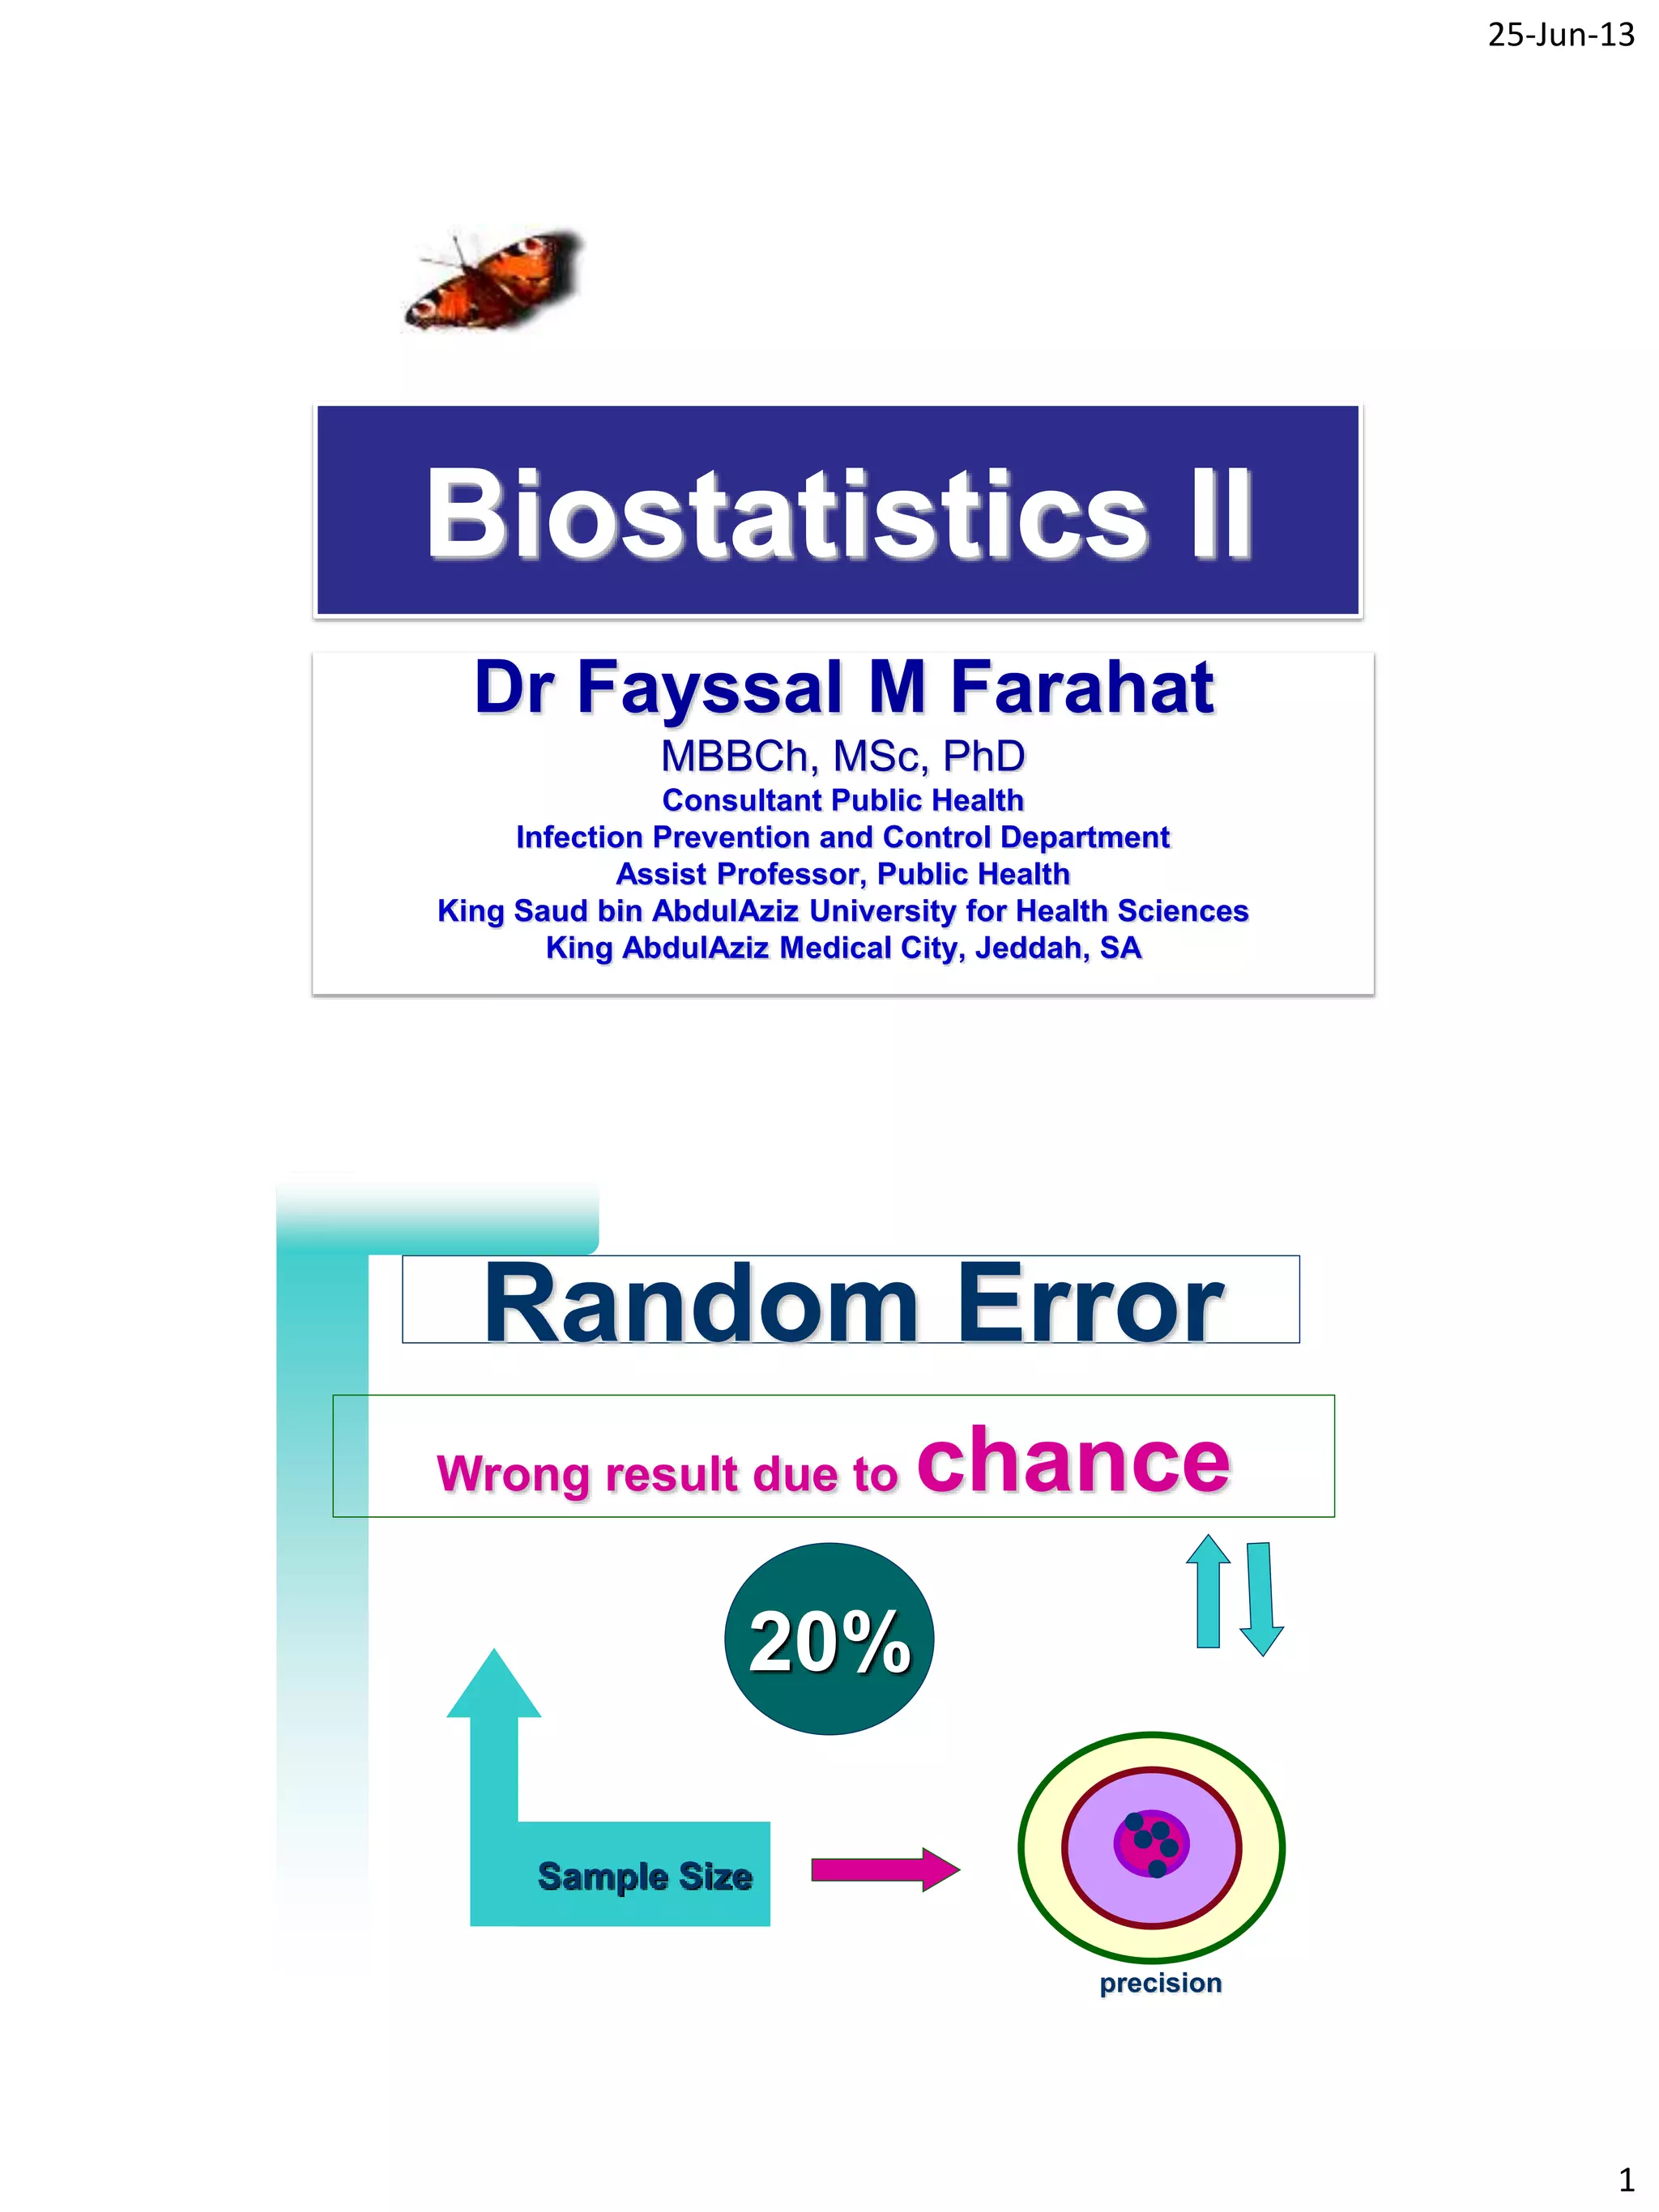
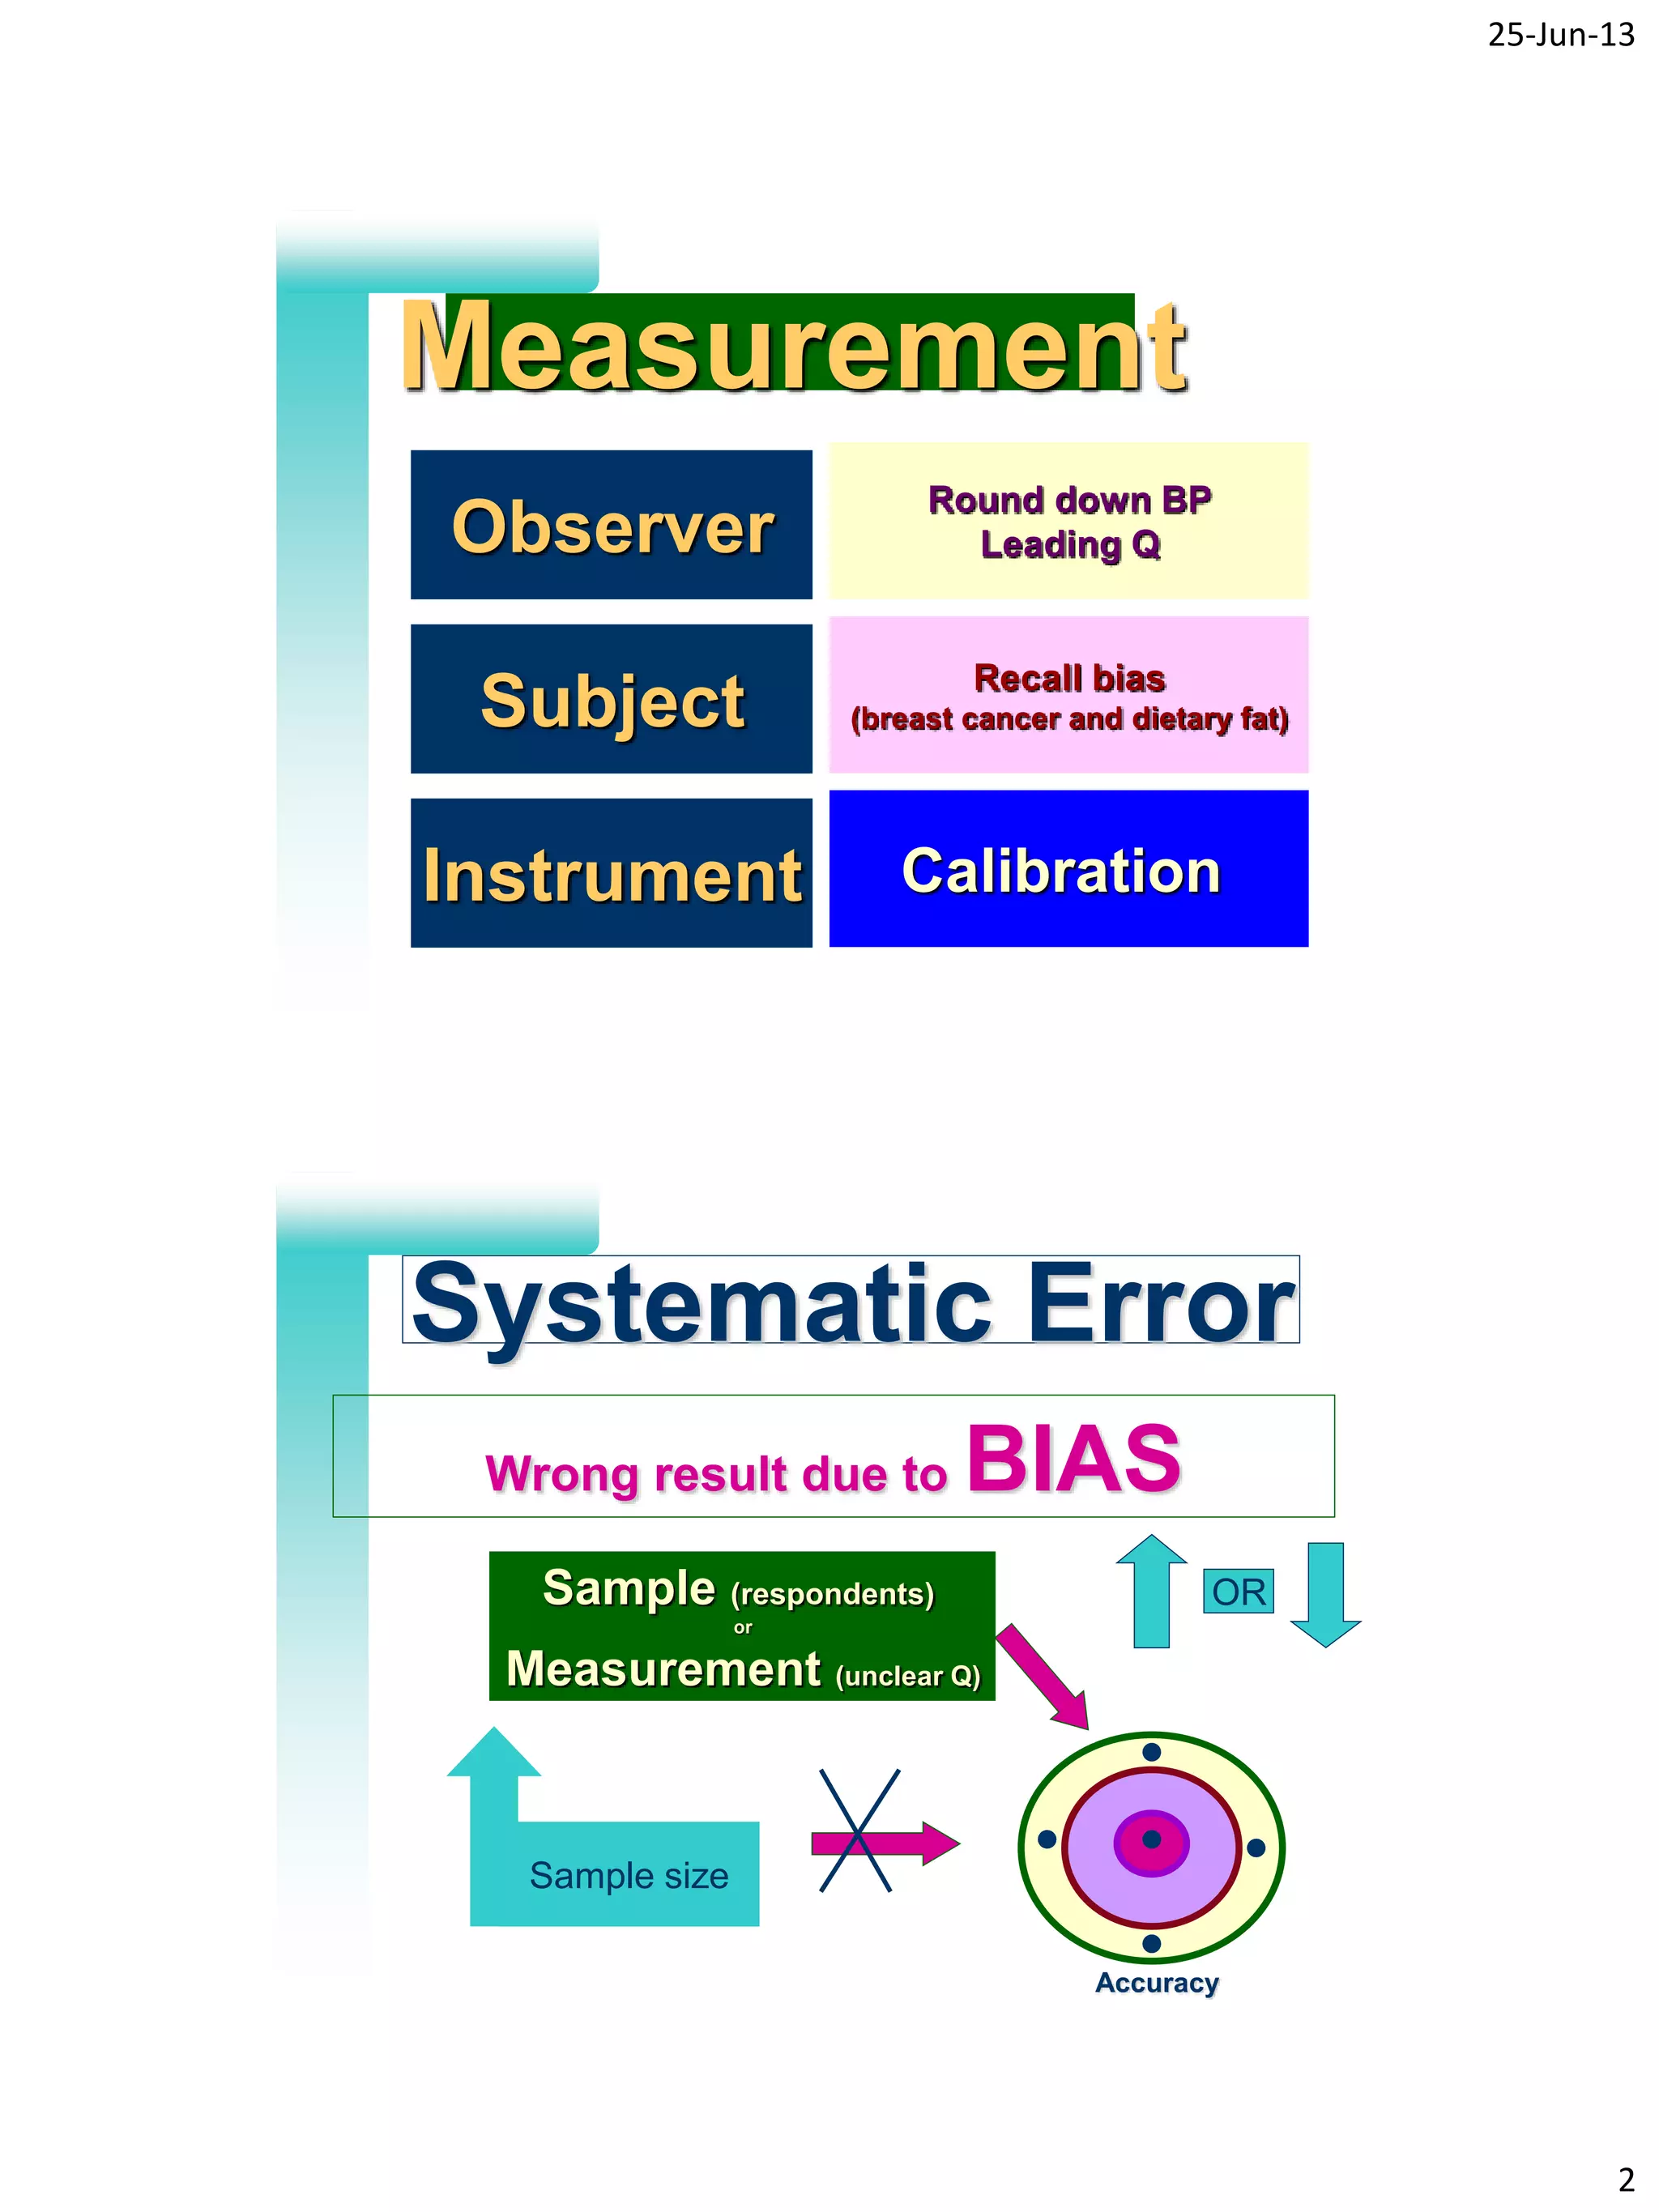
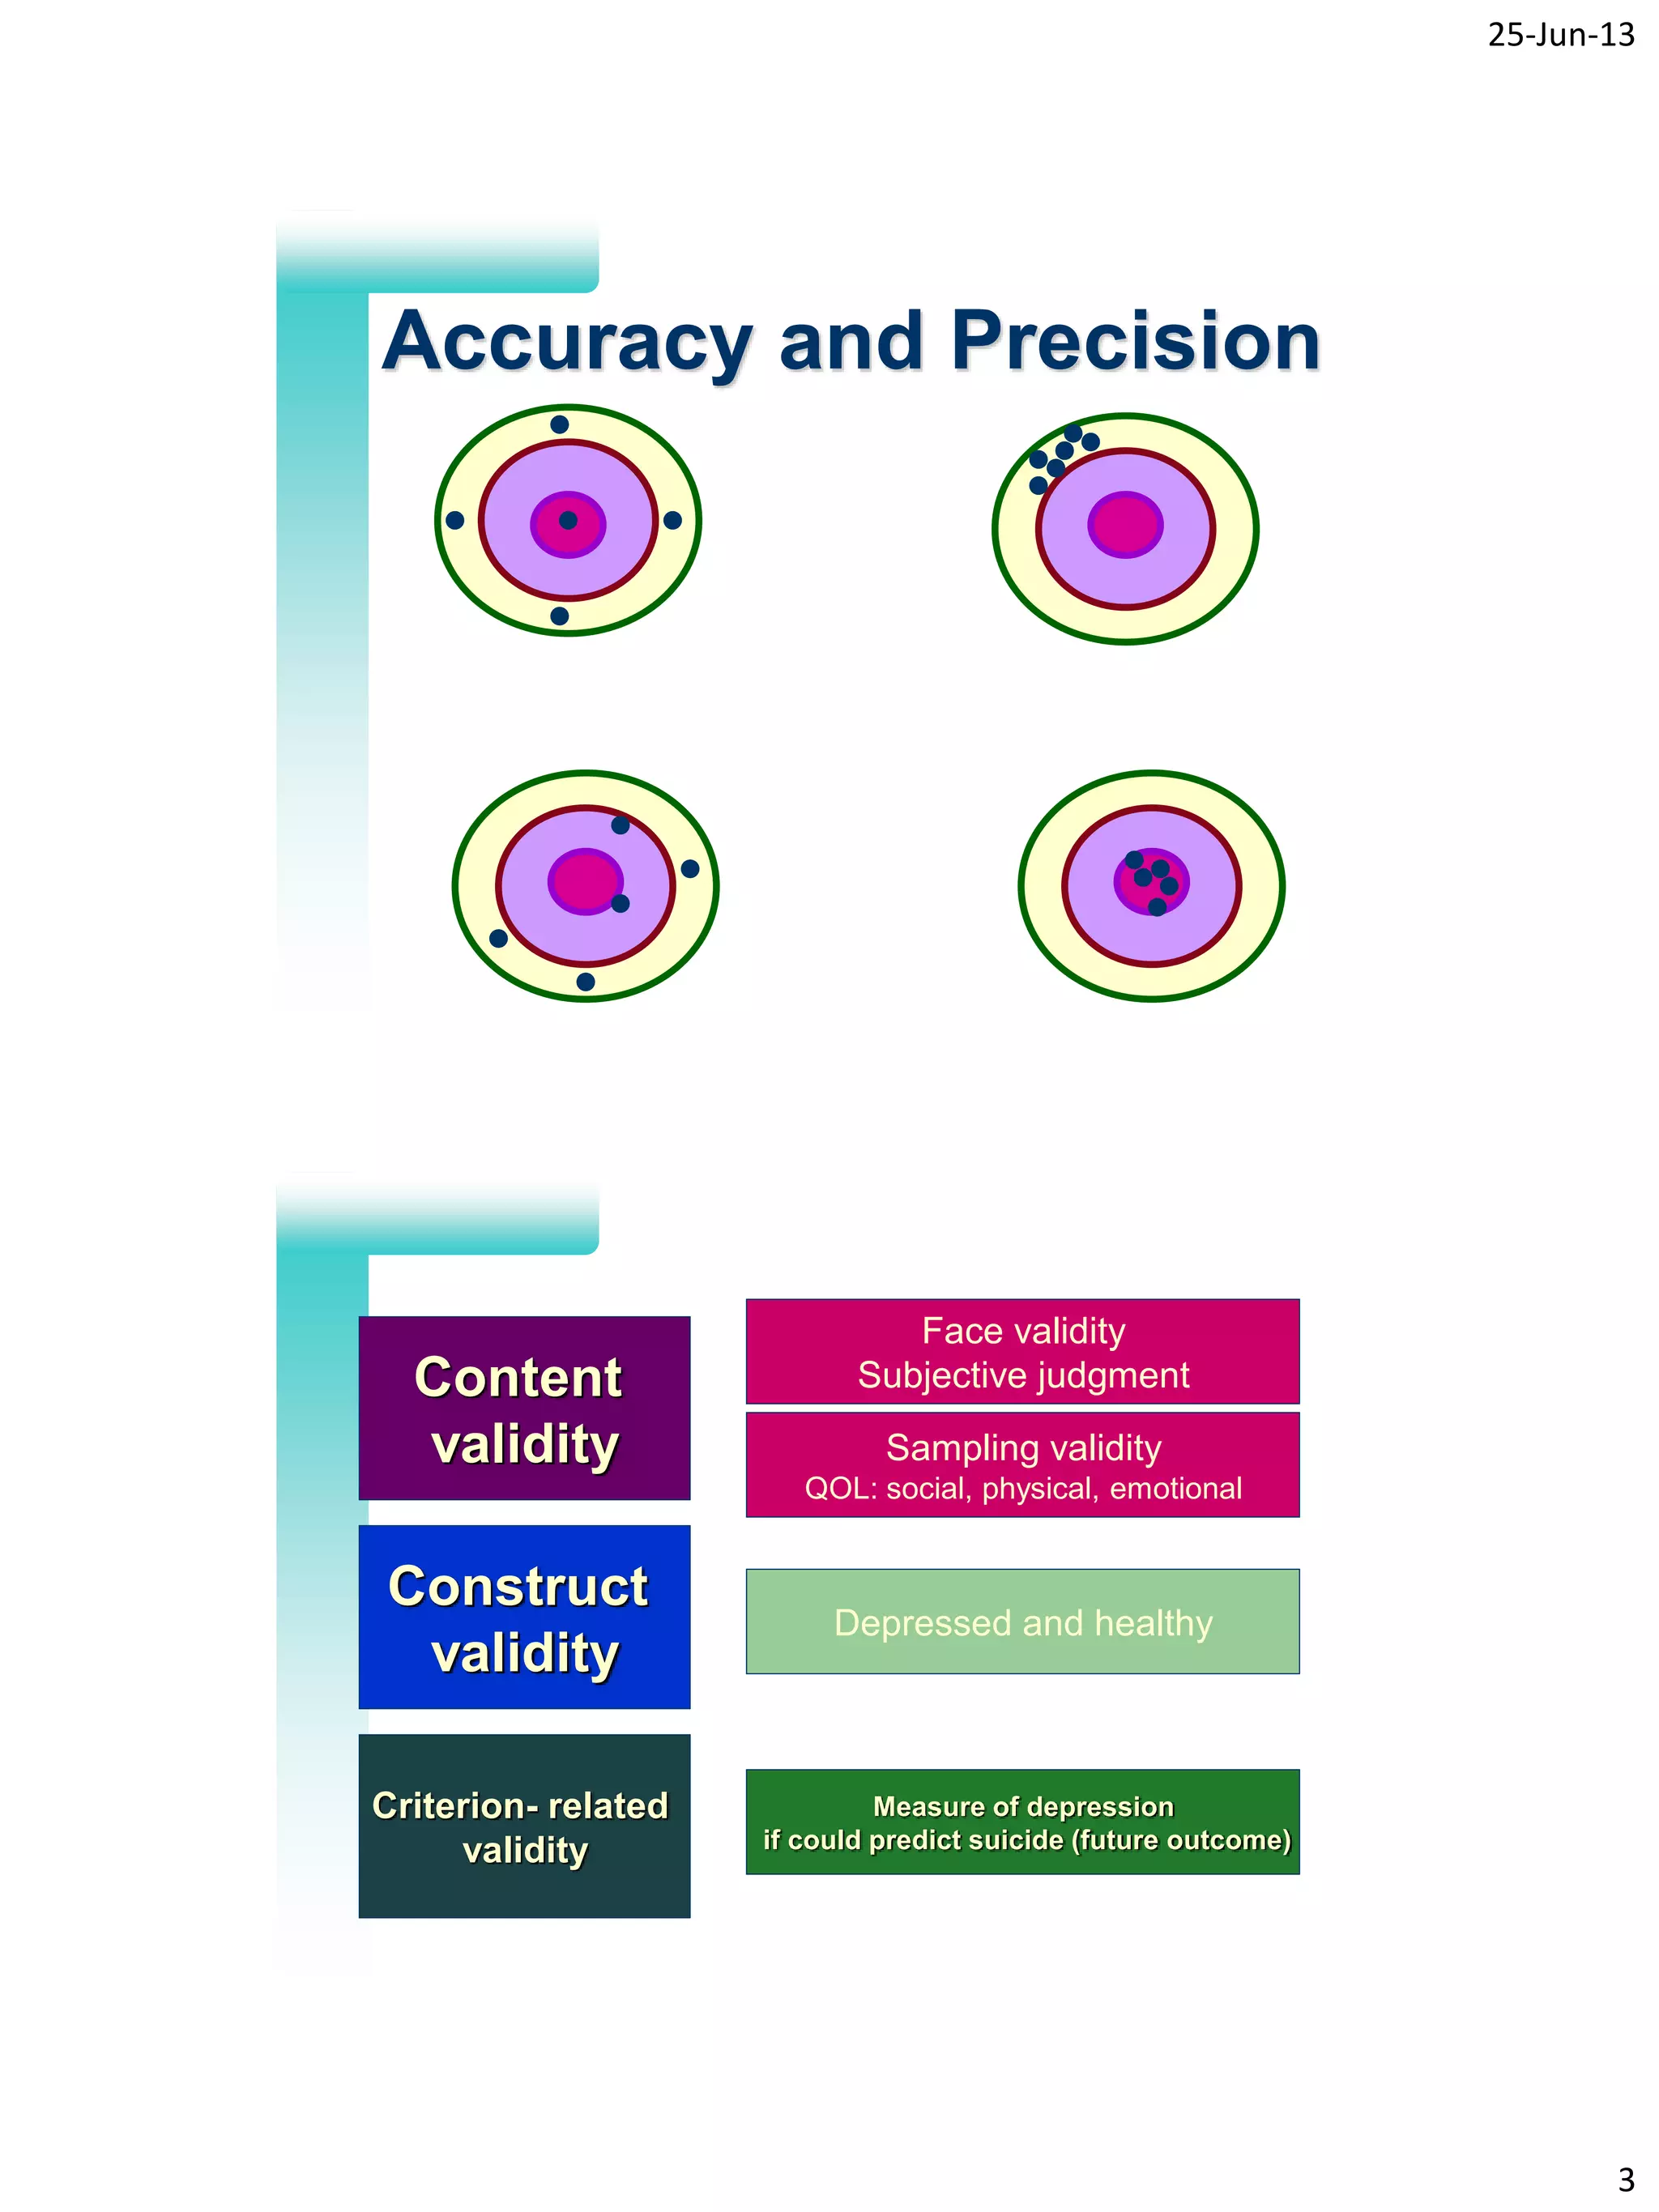
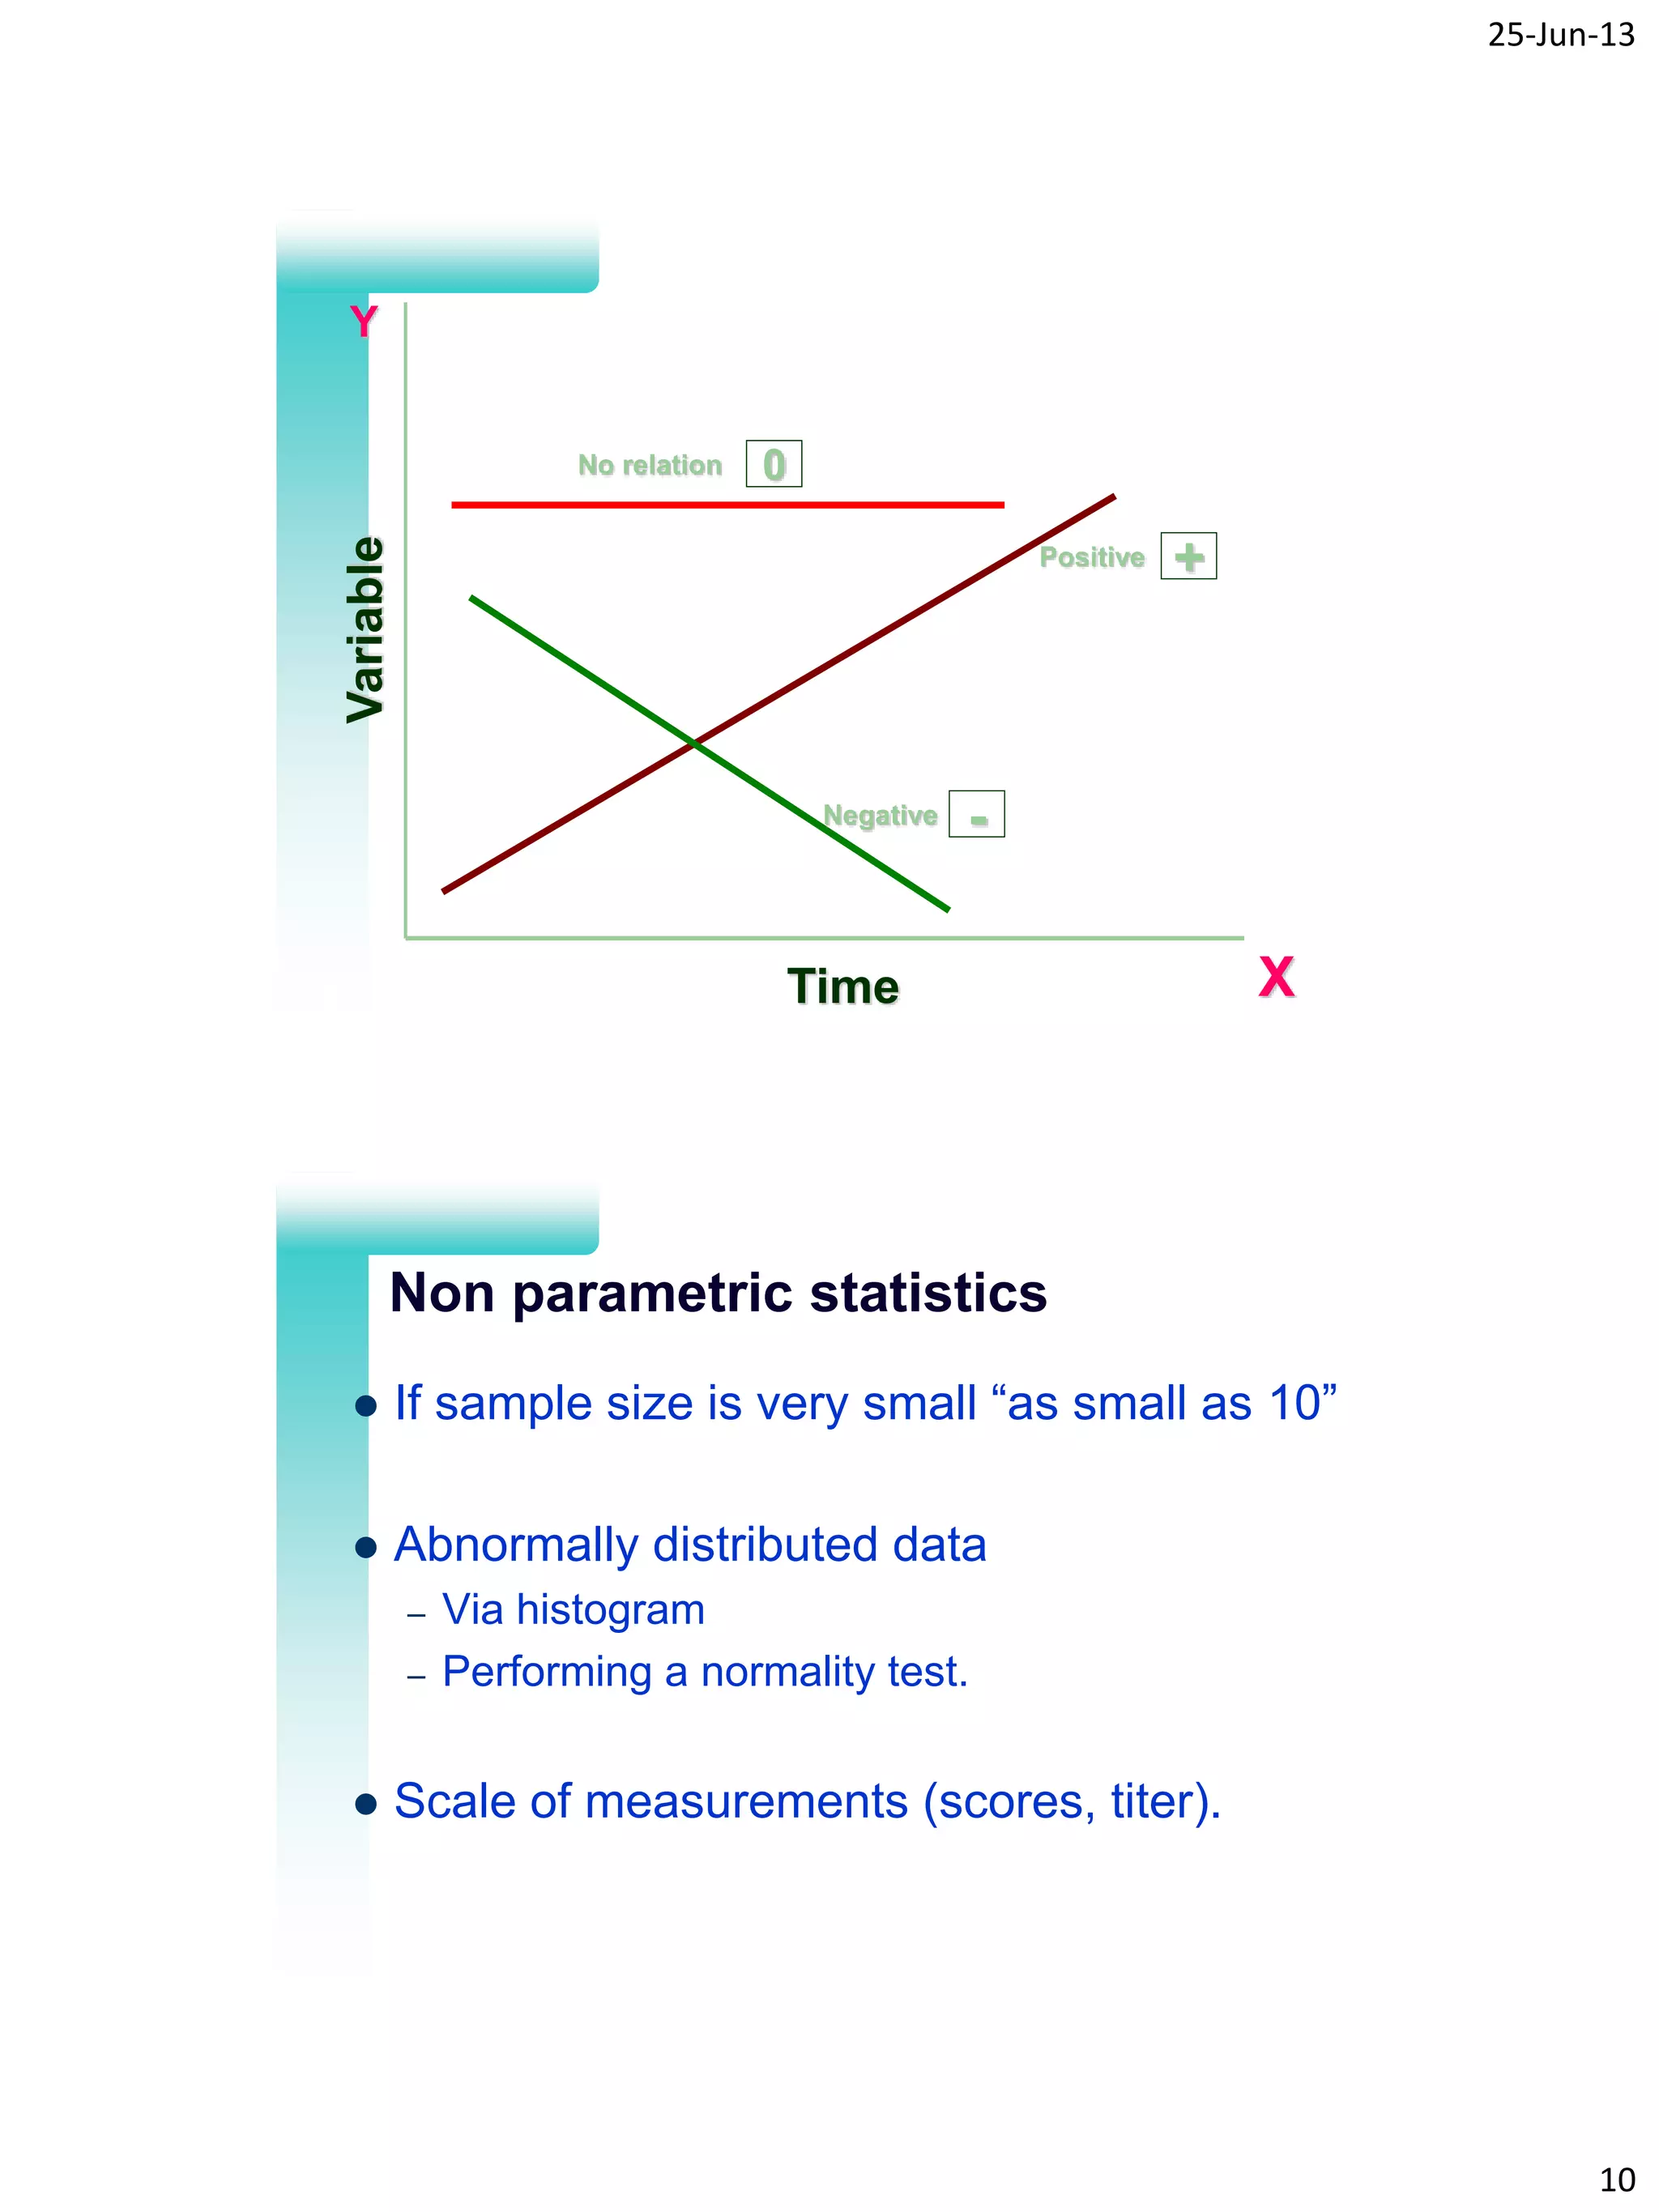
25-Jun-13
1
Biostatistics II
Dr Fayssal M Farahat
MBBCh, MSc, PhD
Consultant Public Health
Infection Prevention and Control Department
Assist Professor, Public Health
King Saud bin AbdulAziz University for Health Sciences
King AbdulAziz Medical City, Jeddah, SA
2
Random Error
Wrong result due to chance
20%
Sample Size
precision
25-Jun-13
2
3
Measurement
Observer
Round down BP
Leading Q
Instrument
Subject Recall bias
(breast cancer and dietary fat)
Calibration
4
Systematic Error
Wrong result due to BIAS
Sample (respondents)
or
Measurement (unclear Q)
OR
Accuracy
Sample size
25-Jun-13
3
5
Accuracy and Precision
6
Content
validity
Face validity
Subjective judgment
Sampling validity
QOL: social, physical, emotional
Construct
validity
Criterion- related
validity
Depressed and healthy
Measure of depression
if could predict suicide (future outcome)
25-Jun-13
4
7
Confounding Variable
Exposure Disease
Confounding
8
Types of hypotheses
NULL Ho
NO association between predictor and outcome
No difference between the aspirin and placebo
The formal basis for testing statistical significance
The association observed in a study is due to chance
25-Jun-13
5
9
ALTERNATIVE H1
association between predictor and outcome
Accepted by default,
if test of significance
rejects the null hypothesis
Types of hypotheses
10
Truth in the population
Association between
predictor and outcome
No Association between
predictor and outcome
Results in the
study sample
Reject
null hypothesis
Fail to Reject
null hypothesis
Correct Type I error
Type II error Correct
alpha
beta
False +ve
False -ve
25-Jun-13
6
11
False +ve
 The investigators can reject the
null hypothesis and conclude
that there is a difference
between the two treatment
groups, when in fact there is no
such difference exist.
The probability of making such error is called
p value
ART
12
False negative
 The investigators may fail to
reject the null hypothesis that
there is no difference between
the two interventions, when in
fact there is difference.
The probability of making such error is called
Beta
BAF
25-Jun-13
7
13
CI vs. P Value
 Significance and precision
14
Statistic and clinical significance
 Statistically sig results might not be clinically
sig.
 Statistically non sig results might be still
clinically sig.
 Effect of Bupropion on smoking cessation=
 OR= 2.35 , P > 0.05  nothing to tell regarding
clinical importance
 OR= 2.35 (0.85, 6.47), CI lying in the side that
favor treatment > 1 = there is a trend of positive
effect of this medication 
clinical sig although statistically non sig.
25-Jun-13
8
15
Commonly used statistical tests
 Chi-square test: To examine the relationship
(association or difference) between two
categorical variables.
 2 by 2 or r by c
Lung
cancer
control
smokers A B
Non-smokers C D
McNemar’s test
16
Cont. statistical tests
 Paired t test: used to compare the means of
one variable in the same group (pre and post
an event).
 Wilcoxon’s matched pairs test
25-Jun-13
9
17
Cont. statistical tests
 Student’ t test: To evaluate the difference in
means between two groups
 Mann-Whitney test
18
Cont. statistical tests
 ANOVA (F test): To test for the difference of
means of the same variable between more
than two groups.
 Kruskall-Wallis test
 LSD: To test for the difference of the means
of the same variable between each two
groups individually.
 Following a significant F test
25-Jun-13
10
19 Time
Positive
No relation
Negative
Variable
X
Y
+
-
0
20
Non parametric statistics
 If sample size is very small “as small as 10”
 Abnormally distributed data
– Via histogram
– Performing a normality test.
 Scale of measurements (scores, titer).
25-Jun-13
11
21
 Statistically non significant findings are of the
same importance as statistically significant
findings.
 Be sure of the distribution of your data before
doing any statistical analysis.
Student’s t test, Mann Whitney,
Sign and Wilcoxon Signed
Rank Tests
25-Jun-13
12
• A single group of subjects and the goal is
to compare an observed value or a norm
or standard.
• A single group that is measured twice and
the goal is to estimate how much the
mean in the group changes between
measurements.
• To determine if a difference exists
between 2 independent groups.
Group 1
Mean 1
SD 1
N 1
Group 2
Mean 2
SD 2
N 2
25-Jun-13
13
Assumptions for the t distribution
Assumption # 1
• The observations in each group follow a
normal distribution.
• Violating assumption of normality gives p
values that are lower than they should be,
making it easier to reject the null
hypothesis and say there is difference
when none exist.
Assumption # 2
• SDs in the two samples are equal
(homogenous variances).
• The null hypothesis states that the two
means are equal, or from the same
population, so SDs are equal.
• This assumption can be ignored when the
sample sizes are equal.
• t test is robust with equal sample sizes.
25-Jun-13
14
Assumption # 3
• Independence= knowing observations in one
group tells us nothing about the observations in
the other group.
• In the paired t test, we can expect that a subject
with relatively low value at the first measurement
to have a relatively low second measurement as
well.
• No statistical test can tell us about
independence, so the best way is to design
properly to ensure they are independent.
Wilcoxon Signed Rank Test
• No disadvantage in using Wilcoxon signed
rank test in any situation with a small
sample size, even when observations are
normally distributed.
• Non parametric statistic when paired t test
is not the appropriate.
25-Jun-13
15
Mann-Whitney-Wilcoxon rank test
• Whether medians are different.
• Rank all observations, then analyze the
ranks as they were the original
observations.
• Mean and standard deviation of the ranks
are calculated for the t test.
• Test the hypothesis that the means of the
ranks are equal in the two groups.
Association between exposure of women to pesticides
during pregnancy and birth defects in their offspring
using data from a cohort study.
Exposure Birth defects
Yes
Birth defects
No
Total
Yes 20 980
1000
No 25 3975
4000
Total 45 4955
5000
Incidence (of birth defects) in exposed 20/1000= 0.02
Incidence (of birth defects) in unexposed 25/4000= 0.00625
Relative Risk 0.02/0.00625= 3.20 (1.78, 5.74)
If you would like to calculate Odds Ratio?
(20 X 3975) / (25 X 980) = 3.24 (1.79, 5.87)
25-Jun-13
16
31
The most important is to
understand the concepts to
interpret the clinical
research.

Biostatistics II

  • 1.
    25-Jun-13 1 Biostatistics II Dr FayssalM Farahat MBBCh, MSc, PhD Consultant Public Health Infection Prevention and Control Department Assist Professor, Public Health King Saud bin AbdulAziz University for Health Sciences King AbdulAziz Medical City, Jeddah, SA 2 Random Error Wrong result due to chance 20% Sample Size precision
  • 2.
    25-Jun-13 2 3 Measurement Observer Round down BP LeadingQ Instrument Subject Recall bias (breast cancer and dietary fat) Calibration 4 Systematic Error Wrong result due to BIAS Sample (respondents) or Measurement (unclear Q) OR Accuracy Sample size
  • 3.
    25-Jun-13 3 5 Accuracy and Precision 6 Content validity Facevalidity Subjective judgment Sampling validity QOL: social, physical, emotional Construct validity Criterion- related validity Depressed and healthy Measure of depression if could predict suicide (future outcome)
  • 4.
    25-Jun-13 4 7 Confounding Variable Exposure Disease Confounding 8 Typesof hypotheses NULL Ho NO association between predictor and outcome No difference between the aspirin and placebo The formal basis for testing statistical significance The association observed in a study is due to chance
  • 5.
    25-Jun-13 5 9 ALTERNATIVE H1 association betweenpredictor and outcome Accepted by default, if test of significance rejects the null hypothesis Types of hypotheses 10 Truth in the population Association between predictor and outcome No Association between predictor and outcome Results in the study sample Reject null hypothesis Fail to Reject null hypothesis Correct Type I error Type II error Correct alpha beta False +ve False -ve
  • 6.
    25-Jun-13 6 11 False +ve  Theinvestigators can reject the null hypothesis and conclude that there is a difference between the two treatment groups, when in fact there is no such difference exist. The probability of making such error is called p value ART 12 False negative  The investigators may fail to reject the null hypothesis that there is no difference between the two interventions, when in fact there is difference. The probability of making such error is called Beta BAF
  • 7.
    25-Jun-13 7 13 CI vs. PValue  Significance and precision 14 Statistic and clinical significance  Statistically sig results might not be clinically sig.  Statistically non sig results might be still clinically sig.  Effect of Bupropion on smoking cessation=  OR= 2.35 , P > 0.05  nothing to tell regarding clinical importance  OR= 2.35 (0.85, 6.47), CI lying in the side that favor treatment > 1 = there is a trend of positive effect of this medication  clinical sig although statistically non sig.
  • 8.
    25-Jun-13 8 15 Commonly used statisticaltests  Chi-square test: To examine the relationship (association or difference) between two categorical variables.  2 by 2 or r by c Lung cancer control smokers A B Non-smokers C D McNemar’s test 16 Cont. statistical tests  Paired t test: used to compare the means of one variable in the same group (pre and post an event).  Wilcoxon’s matched pairs test
  • 9.
    25-Jun-13 9 17 Cont. statistical tests Student’ t test: To evaluate the difference in means between two groups  Mann-Whitney test 18 Cont. statistical tests  ANOVA (F test): To test for the difference of means of the same variable between more than two groups.  Kruskall-Wallis test  LSD: To test for the difference of the means of the same variable between each two groups individually.  Following a significant F test
  • 10.
    25-Jun-13 10 19 Time Positive No relation Negative Variable X Y + - 0 20 Nonparametric statistics  If sample size is very small “as small as 10”  Abnormally distributed data – Via histogram – Performing a normality test.  Scale of measurements (scores, titer).
  • 11.
    25-Jun-13 11 21  Statistically nonsignificant findings are of the same importance as statistically significant findings.  Be sure of the distribution of your data before doing any statistical analysis. Student’s t test, Mann Whitney, Sign and Wilcoxon Signed Rank Tests
  • 12.
    25-Jun-13 12 • A singlegroup of subjects and the goal is to compare an observed value or a norm or standard. • A single group that is measured twice and the goal is to estimate how much the mean in the group changes between measurements. • To determine if a difference exists between 2 independent groups. Group 1 Mean 1 SD 1 N 1 Group 2 Mean 2 SD 2 N 2
  • 13.
    25-Jun-13 13 Assumptions for thet distribution Assumption # 1 • The observations in each group follow a normal distribution. • Violating assumption of normality gives p values that are lower than they should be, making it easier to reject the null hypothesis and say there is difference when none exist. Assumption # 2 • SDs in the two samples are equal (homogenous variances). • The null hypothesis states that the two means are equal, or from the same population, so SDs are equal. • This assumption can be ignored when the sample sizes are equal. • t test is robust with equal sample sizes.
  • 14.
    25-Jun-13 14 Assumption # 3 •Independence= knowing observations in one group tells us nothing about the observations in the other group. • In the paired t test, we can expect that a subject with relatively low value at the first measurement to have a relatively low second measurement as well. • No statistical test can tell us about independence, so the best way is to design properly to ensure they are independent. Wilcoxon Signed Rank Test • No disadvantage in using Wilcoxon signed rank test in any situation with a small sample size, even when observations are normally distributed. • Non parametric statistic when paired t test is not the appropriate.
  • 15.
    25-Jun-13 15 Mann-Whitney-Wilcoxon rank test •Whether medians are different. • Rank all observations, then analyze the ranks as they were the original observations. • Mean and standard deviation of the ranks are calculated for the t test. • Test the hypothesis that the means of the ranks are equal in the two groups. Association between exposure of women to pesticides during pregnancy and birth defects in their offspring using data from a cohort study. Exposure Birth defects Yes Birth defects No Total Yes 20 980 1000 No 25 3975 4000 Total 45 4955 5000 Incidence (of birth defects) in exposed 20/1000= 0.02 Incidence (of birth defects) in unexposed 25/4000= 0.00625 Relative Risk 0.02/0.00625= 3.20 (1.78, 5.74) If you would like to calculate Odds Ratio? (20 X 3975) / (25 X 980) = 3.24 (1.79, 5.87)
  • 16.
    25-Jun-13 16 31 The most importantis to understand the concepts to interpret the clinical research.