Science 7 - LAND and SEA BREEZE and its Characteristics
Introduction to biostatistics
1. 1
June 22, 2013 Dr Fayssal Farahat, MD 1
Dr. Fayssal M Farahat,
MBBCh, MSc, PhD
Consultant Public Health
Infection Prevention and Control
King AbdulAziz Medical City–Jeddah
National Guard Health Affairs
Descriptive Statistics
June 22, 2013 Dr Fayssal Farahat, MD 2
“Whatever you can not
measure, you can not
manage”
June 22, 2013 Dr Fayssal Farahat, MD 3
Statistics
business education psychology
Biology and Medicine
Biostatistics
2. 2
June 22, 2013 Dr Fayssal Farahat, MD 4
Statistics
Collection Presentation Analysis
Draw inferences
June 22, 2013 Dr Fayssal Farahat, MD 5
Data = numbers
Measurement Counting
A nurse takes a
patient’s
temperature
A hospital
administrator counts
number of discharged
patients on a given
day.
June 22, 2013 Dr Fayssal Farahat, MD 6
Data
Data
Data
Data
Decision
The procedure by
which we reach a
conclusion about a
population on the
basis of information
contained in a sample
drawn from this
population
3. 3
June 22, 2013 Dr Fayssal Farahat, MD 7
Students’ scores:
75, 95, 60, 93, 85, 84, 76, 92, 62, 83,
80, 90, 64, 75,79, 32, 78, 64, 98,
73,88, 61, 82, 86, 79, 78, 80, 55
How useful would that list of number be to you?
How to get information out of data …
FIRST STEP, the data have to be organized and Summarized.
Data INFO
June 22, 2013 Dr Fayssal Farahat, MD 8
Sources of Data
Primary Data
Collection & Analysis
Secondary Data
Collection & Analysis
Client satisfaction & Identification Surveys
Lifestyle and health behavior surveys
Focus Group discussions
Hospital Records
inpatients outpatients Birth Death
External sources (published reports)
June 22, 2013 Dr Fayssal Farahat, MD 9
Measurement
4. 4
June 22, 2013 Dr Fayssal Farahat, MD 10
Variable
=
Characteristicnot the same when observed in different possessors.
June 22, 2013 Dr Fayssal Farahat, MD 11
VARIABLES
June 22, 2013 Dr Fayssal Farahat, MD 12
Quantitative
Discrete
منفصلة
No fractions
عشرية كسور ال
Continuous
متصلة
Fractions
عشرية كسور
5. 5
June 22, 2013 Dr Fayssal Farahat, MD 13
Qualitative
Ordinal
ترتيبية
Nominal
اسمية
June 22, 2013 Dr Fayssal Farahat, MD 14
Discrete
منفصلة
• Number of pregnancies
• Number of children
• Family size
• Heart rate
• Respiratory rate
• Number of cigarettes
June 22, 2013 Dr Fayssal Farahat, MD 15
Continuous
متصلة
• WEIGHT
• HIGHT
• AGE
• TEPERATURE
• BLOOD PRESSURE
• RBS
• AMOUNT OF URINE
• BODY SURFACE AREA
6. 6
June 22, 2013 Dr Fayssal Farahat, MD 16
Nominal
- Gender :" Male – female. "
- Marital status: married, single, widow, divorced
(1) (2)
(1) (2) (3) (4)
June 22, 2013 Dr Fayssal Farahat, MD 17
Ordinal
- grade :" A+ A B+ B C+ C D+ D "
.
- Educational level: 1ry, 2ry, university
- Income: < 5000, 5000-10.000, >10.000
(1) (2) (3) (4) (5) (6) (7)
(1) (2) (3)
(1) (2) (3)
June 22, 2013 Dr Fayssal Farahat, MD 18
Quantitative Qualitative
High systole
Qualitative
x
Quantitative
200
x
7. 7
June 22, 2013 Dr Fayssal Farahat, MD 19
Measurement Scales
Nominal
Ordinal
Interval
Ratio
June 22, 2013 Dr Fayssal Farahat, MD 20
Temperature
True
zero
Weight
June 22, 2013 Dr Fayssal Farahat, MD 21
The distinction is not about
the value, but the association,
causality each variable
occupies in the equation.
8. 8
June 22, 2013 Dr Fayssal Farahat, MD 22
Frequency table
التكراري الجدول
Interval
الفترة
Frequency
التكرار
Valid %
المئوية النسبة
Cumulative %
التراكمية النسبة
<20
20-29
30-39
40-49
50-59
60-69
70-79
80-89
≥90
Total
46
70
108
106
74
72
42
29
33
580
7.9
12.1
18.6
18.3
12.8
12.4
7.2
5.0
5.7
100.0
7.9
20.0
38.6
56.9
69.7
82.1
89.3
94.3
100
Few
6-14
Overlap
40-49, 49-50
Equal width
Avoid
open-ended
Cumulative %=
Obs % + all lower %
<60
June 22, 2013 Dr Fayssal Farahat, MD 23
City
Male smokers المدخنون
Taif
Riyadh
Jeddah
TOTAL
Table (1). Number and percent of male smokers
less and more than 18 ys old in different cities
< 18 years > 18 years
n % n %
80
90
150
320
TOTAL
n %
40
30
30
32
120
210
350
680
60
70
70
68
200 100
300
500
1000
100
100
100
Tables
June 22, 2013 Dr Fayssal Farahat, MD 24
Tables
City
Male smokers
Taif
Riyadh
Jeddah
TOTAL
Table (1). Number and percent of male smokers
less and more than 18 ys old in different cities
< 18 years > 18 years
n % n %
80
90
150
320
TOTAL
n %
25
28
47
100
120
210
350
680
18
31
51
100
200 20
300
500
1000
30
50
100
9. 9
June 22, 2013 Dr Fayssal Farahat, MD 25
2 x 2
Exposure
Smoker
Non-smoker
Cancer Lung
Positive
N (%)
Negative
N (%)
June 22, 2013 Dr Fayssal Farahat, MD 26
Graphs
Line graph
Frequency Histogram
Frequency polygon
Bar chart
Pie chart
Pictogram
June 22, 2013 Dr Fayssal Farahat, MD 27
Time
Positive
No relation
Negative
Variable
X
Y
+
-
0
10. 10
June 22, 2013 Dr Fayssal Farahat, MD 28
X
Y
Equal width
June 22, 2013 Dr Fayssal Farahat, MD 29
Frequency Polygone
التكراري المنحنى
June 22, 2013 Dr Fayssal Farahat, MD 30
heal thy disease
group
2
4
6
8
10
Count
Healthy Diseased
Count
11. 11
June 22, 2013 Dr Fayssal Farahat, MD 31
39.7
58.8
gp 1
gp 2
Age
June 22, 2013 Dr Fayssal Farahat, MD 32
Sex distribution in different studied groups
0
10
20
30
40
50
60
70
80
Control Asthmatic COPD
%
Male
Female
June 22, 2013 Dr Fayssal Farahat, MD 33
healthy
disease
group
Pies show counts
Pie
44.44%
8.055.56%
10.0
Pie Chart
12. 12
June 22, 2013 Dr Fayssal Farahat, MD 34
Pictogram
1970 1980 1990 2000
June 22, 2013 Dr Fayssal Farahat, MD 35
0
2
4
6
8
10
12
14
Y1950 Y1960 Y1970 Y1980 Y1990 Y2000
Year
Mortality(per1000)
2
4
6
8
10
12
14
0
1
2
3
4
1970y 1980y 1990y 2000y
June 22, 2013 Dr Fayssal Farahat, MD 36
Summarizing qualitative data
Proportion
a / a + b (part / whole)
Percentage
Proportion X 100%
Ratio
a / b (part / another part)
Rate
a / a + b X base (1000, 10,000,100,000)
+ In a specific time (20 per 10,000 per year)
13. 13
June 22, 2013 Dr Fayssal Farahat, MD 37
Arithmetic Mean
ExtremesHR
variation
1
2
3
4
5
6
7
8
9
10
19.2
51.9
33.1
86.7
29.1
45.3
16.4
85.7
18.9
42.6
42.9
32.1
Consider each variable
X
June 22, 2013 Dr Fayssal Farahat, MD 38
Weighted Mean
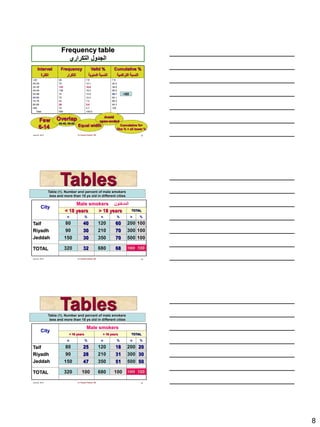
Interval Frequency Valid % Cumulative %
2-20
21-30
31-40
41-50
51-60
61-70
71-80
81-90
>90
Total
46
70
108
106
74
72
42
29
33
580
7.9
12.1
18.6
18.3
12.8
12.4
7.2
5.0
5.7
100.0
7.9
20.0
38.6
56.9
69.7
82.1
89.3
94.3
100
[(11 x 46) + (25 x 70) + ….+ (85 x 29) + (100 x 33)] / 580 = 49.1
X
?
June 22, 2013 Dr Fayssal Farahat, MD 39
Median
Middle observation
Odd Even
Extremes
Consider each variable
Ordinal data
14. 14
June 22, 2013 Dr Fayssal Farahat, MD 40
Mode
Most frequent value
Uni-modal Bi-modal
Most frequent interval
Most frequent diagnosis
June 22, 2013 Dr Fayssal Farahat, MD 41
Measures of Spread
التشتت مقاييس
Range
SD
CV
Percentiles
Interquartile
Range
المدى
المعياري االنحراف
التغير معامل
Percentiles
الربعي المدى
June 22, 2013 Dr Fayssal Farahat, MD 42
The Range
The largest – the smallest
15. 15
June 22, 2013 Dr Fayssal Farahat, MD 43
June 22, 2013 Dr Fayssal Farahat, MD 44
Coefficient of Variation
التغير معامل
Measure 1 70 (31)
Measure 2
105 (48)
Can
we
Compare
2 different scales
2 different investigators
CV = (SD / Mean) x 100
44.3 % 45.7 %
Quality
Control
June 22, 2013 Dr Fayssal Farahat, MD 45
16. 16
June 22, 2013 Dr Fayssal Farahat, MD 46
Interquartile Range
الربعي المدى
= the difference between the 25th and 75th percentiles
25th 75th
Central 50%
6.5 kg 7.5 kg
1st 3rd
June 22, 2013 Dr Fayssal Farahat, MD 47
STEM
الساق
LEAF
الورقة
2
3
4
5
6
5689
0011369
0269
03
027
30.00
33.00
31.00
29.00
30.00
31.00
26.00
28.00
36.00
39.00
40.00
49.00
50.00
60.00
67.00
46.00
42.00
25.00
62.00
53.00
Stem and Leaf Plot
June 22, 2013 Dr Fayssal Farahat, MD 48
Box – and whisker plot
17. 17
June 22, 2013 Dr Fayssal Farahat, MD 49
Normal Distribution Curve
Gaussian Distribution Curve
June 22, 2013 Dr Fayssal Farahat, MD 50
Mean
Median
Mode
Bell Shape
68%
Symmetric
June 22, 2013 Dr Fayssal Farahat, MD 51
Mean
Median
Mode
Bell Shape
95%
Symmetric
18. 18
Normal curves
(μ=0, σ2=1) and (μ=5, σ 2=1)
-2 0 2 4 6 8
x
0.00.10.20.30.4
fx1
Normal curves
(μ=0, σ2=1) and (μ=0, σ2=2)
-3 -2 -1 0 1 2 3
x
0.00.10.20.30.4
y
Normal curves
(μ=0, σ2=1) and (μ=2, σ2=0.25)
-2 0 2 4 6 8
x
0.00.20.40.60.81.0
fx1
19. 19
June 22, 2013 Dr Fayssal Farahat, MD 55
8 0 9 0 1 0 0 1 1 0 1 2 0 1 3 0 1 4 0 1 5 0 1 6 0
0
5
1 0
1 5
2 0
2 5
P
e
r
c
e
n
t
P O U N D S
120 130110
68% of 100 = .68 x 100 = ~ 68 students
8 0 9 0 1 0 0 1 1 0 1 2 0 1 3 0 1 4 0 1 5 0 1 6 0
0
5
1 0
1 5
2 0
2 5
P
e
r
c
e
n
t
P O U N D S
120100
95% of 100 = .95 x 120 = ~ 95 students
140130110
20. 20
8 0 9 0 1 0 0 1 1 0 1 2 0 1 3 0 1 4 0 1 5 0 1 6 0
0
5
1 0
1 5
2 0
2 5
P
e
r
c
e
n
t
P O U N D S
120100 140130110
0 +1 +2-1-2
X
Z
130 – 120
10
x – μ
σ
8 0 9 0 1 0 0 1 1 0 1 2 0 1 3 0 1 4 0 1 5 0 1 6 0
0
5
1 0
1 5
2 0
2 5
P
e
r
c
e
n
t
P O U N D S
120100 140130110
126
0 +1 +2-1-2
x – μ
σ
Looking up probabilities in the
standard normal tableZ=0.60
Z=0.00
21. 21
What is the area to the
left of Z=1.51 in a
standard normal curve?
Z=1.51
Z=1.51
Area is
93.45%