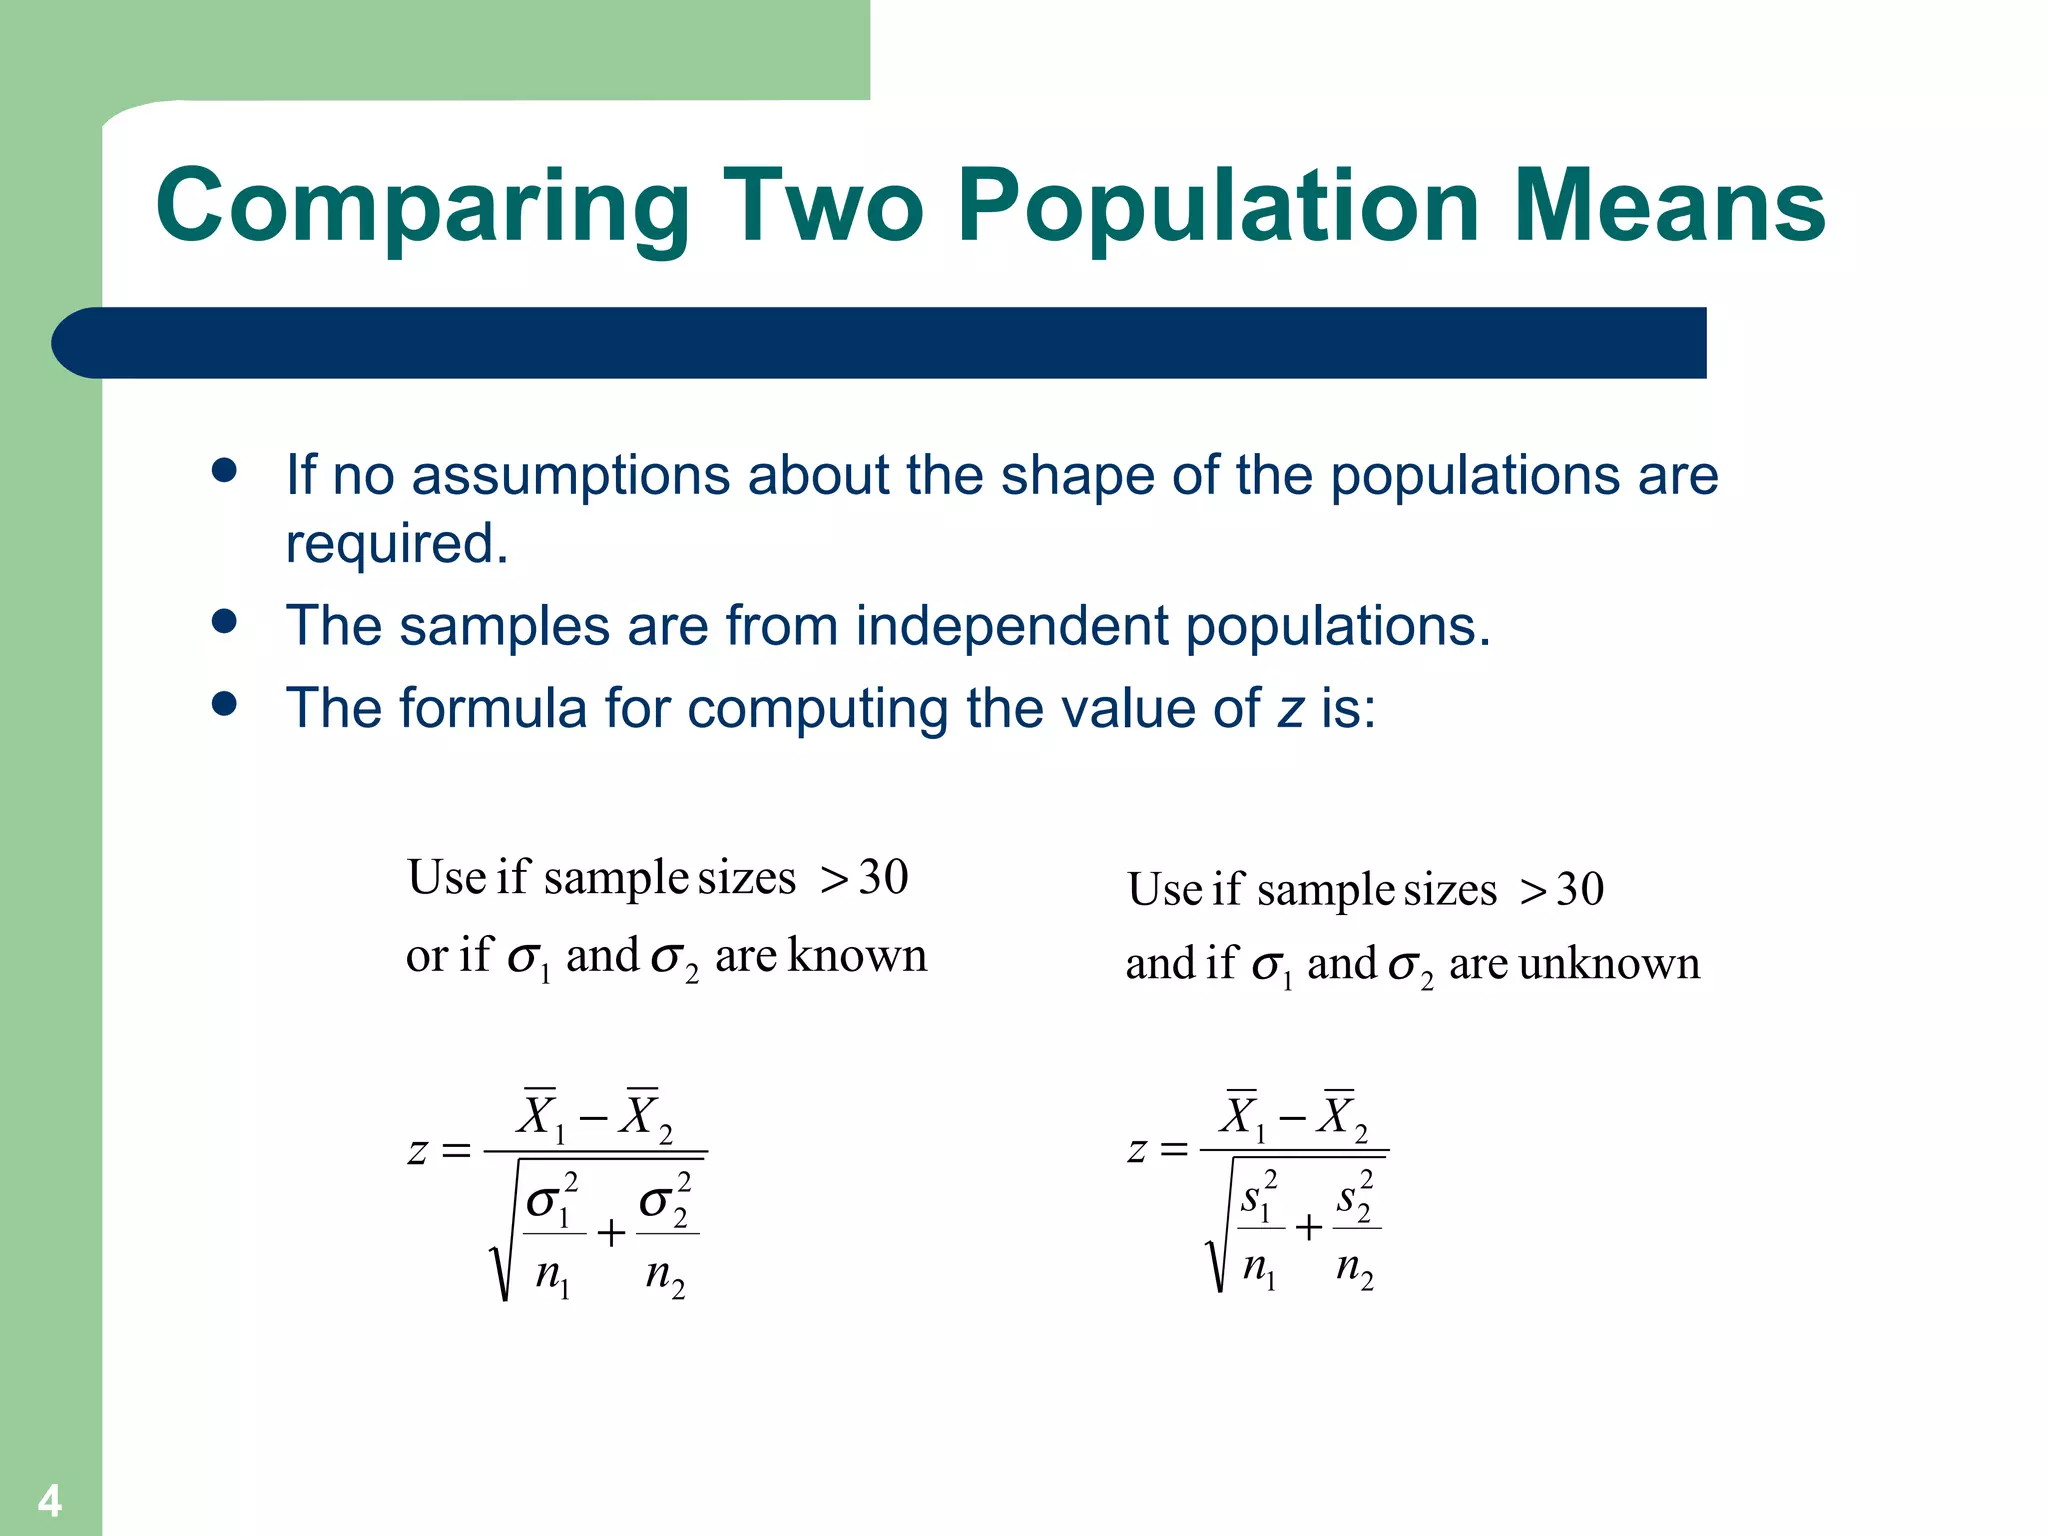
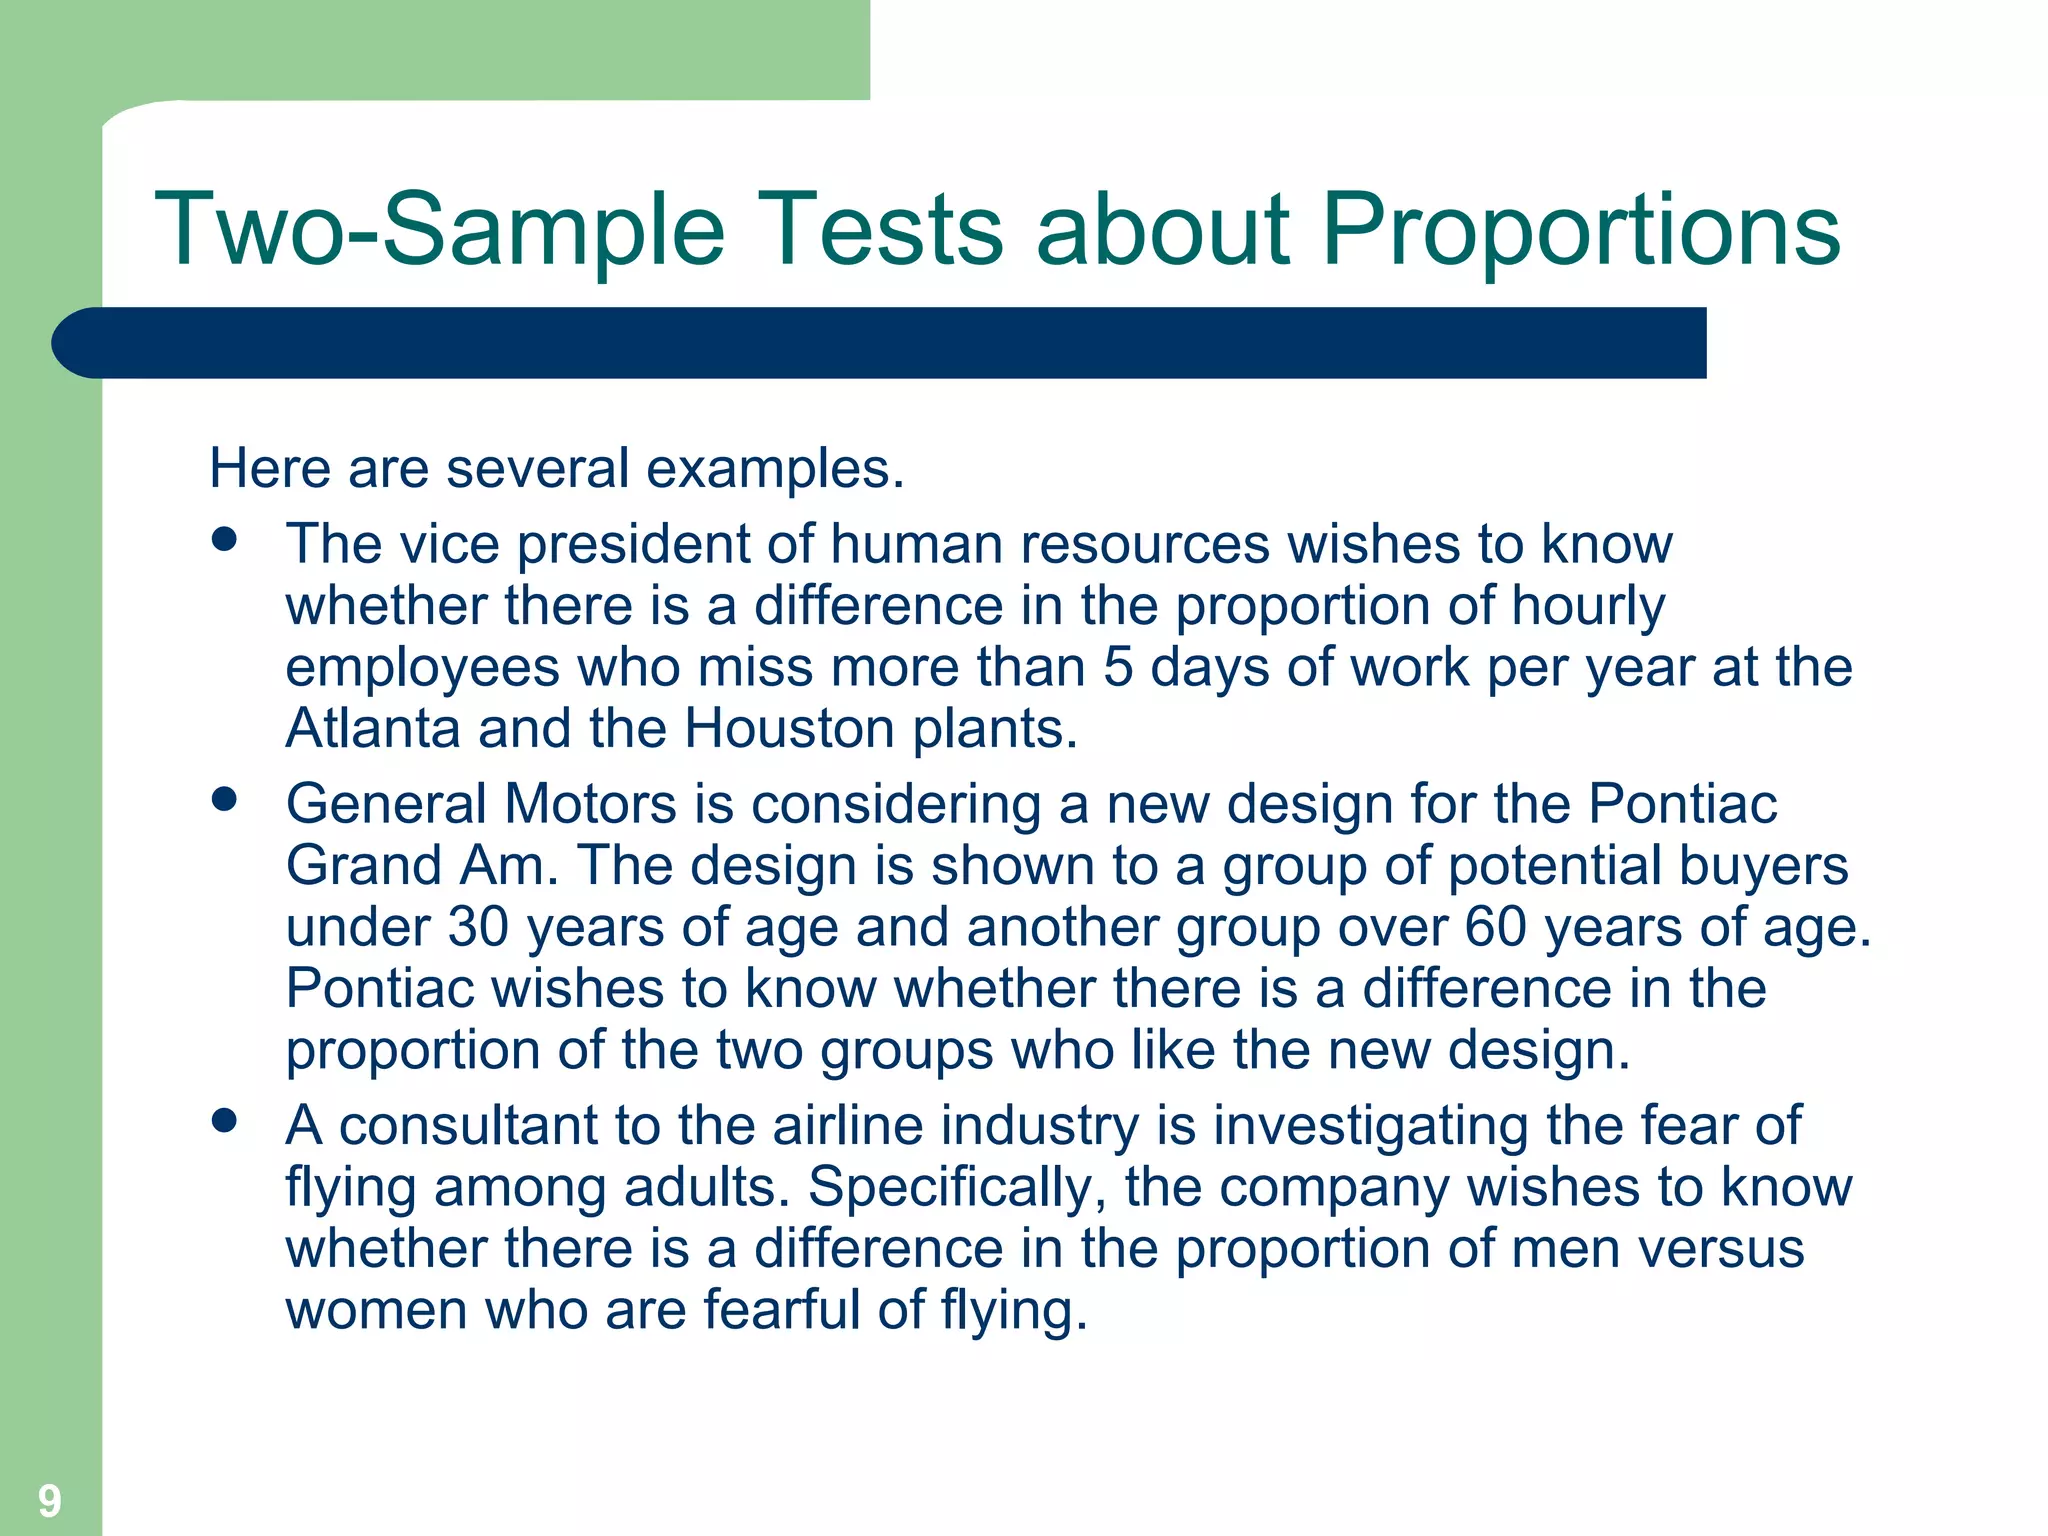
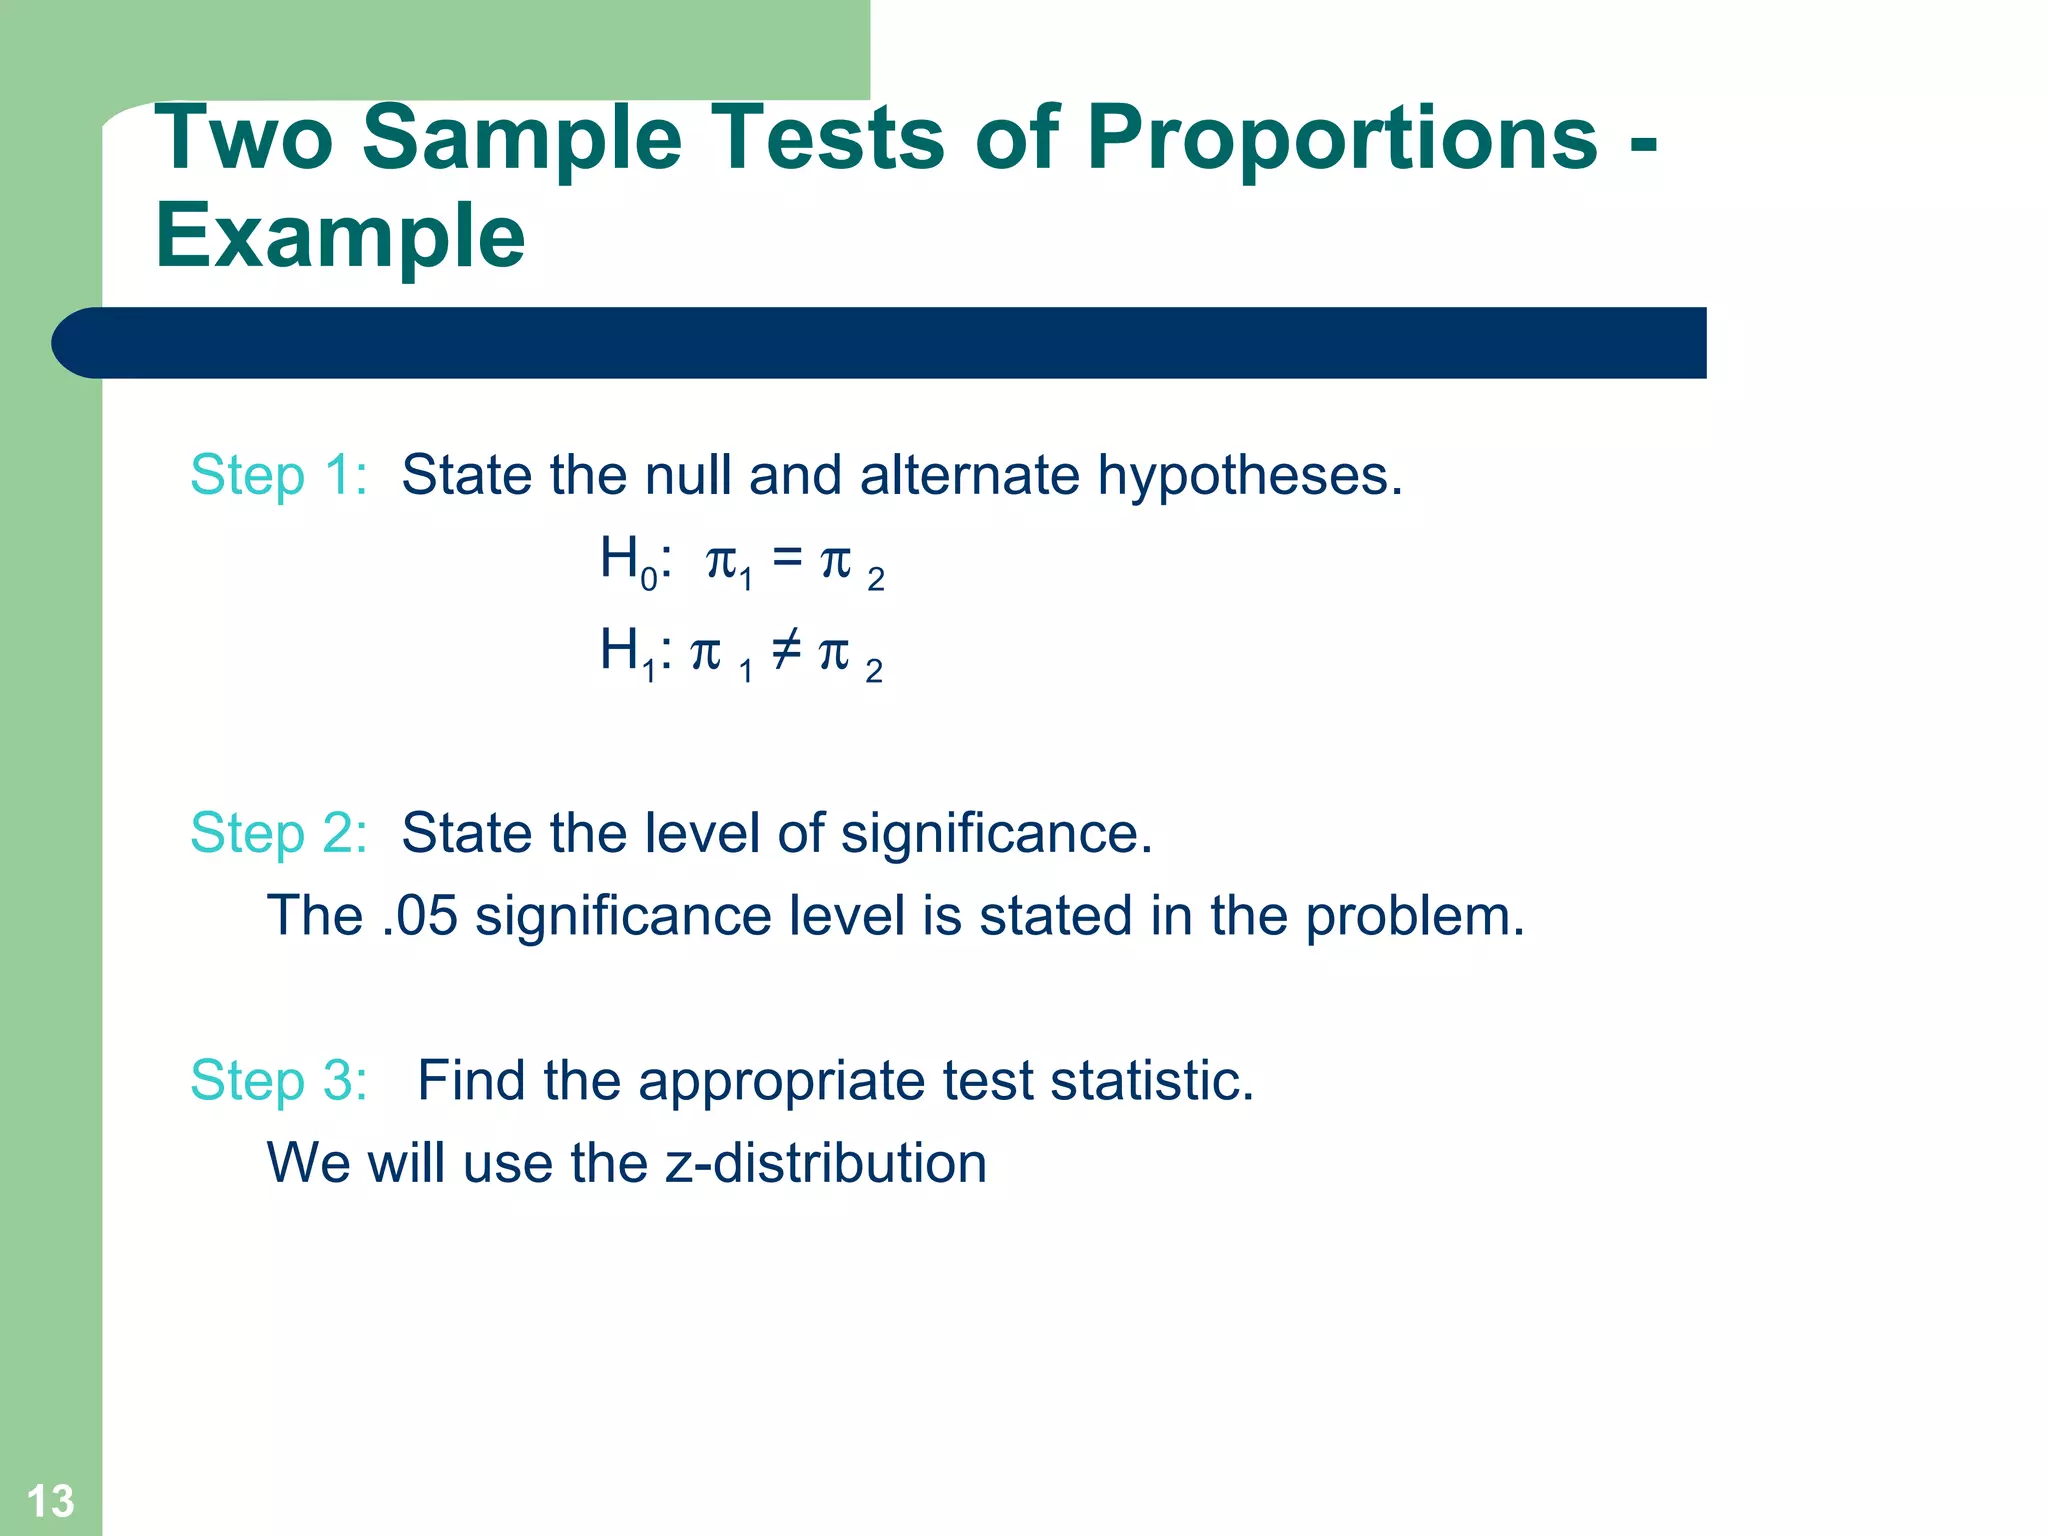
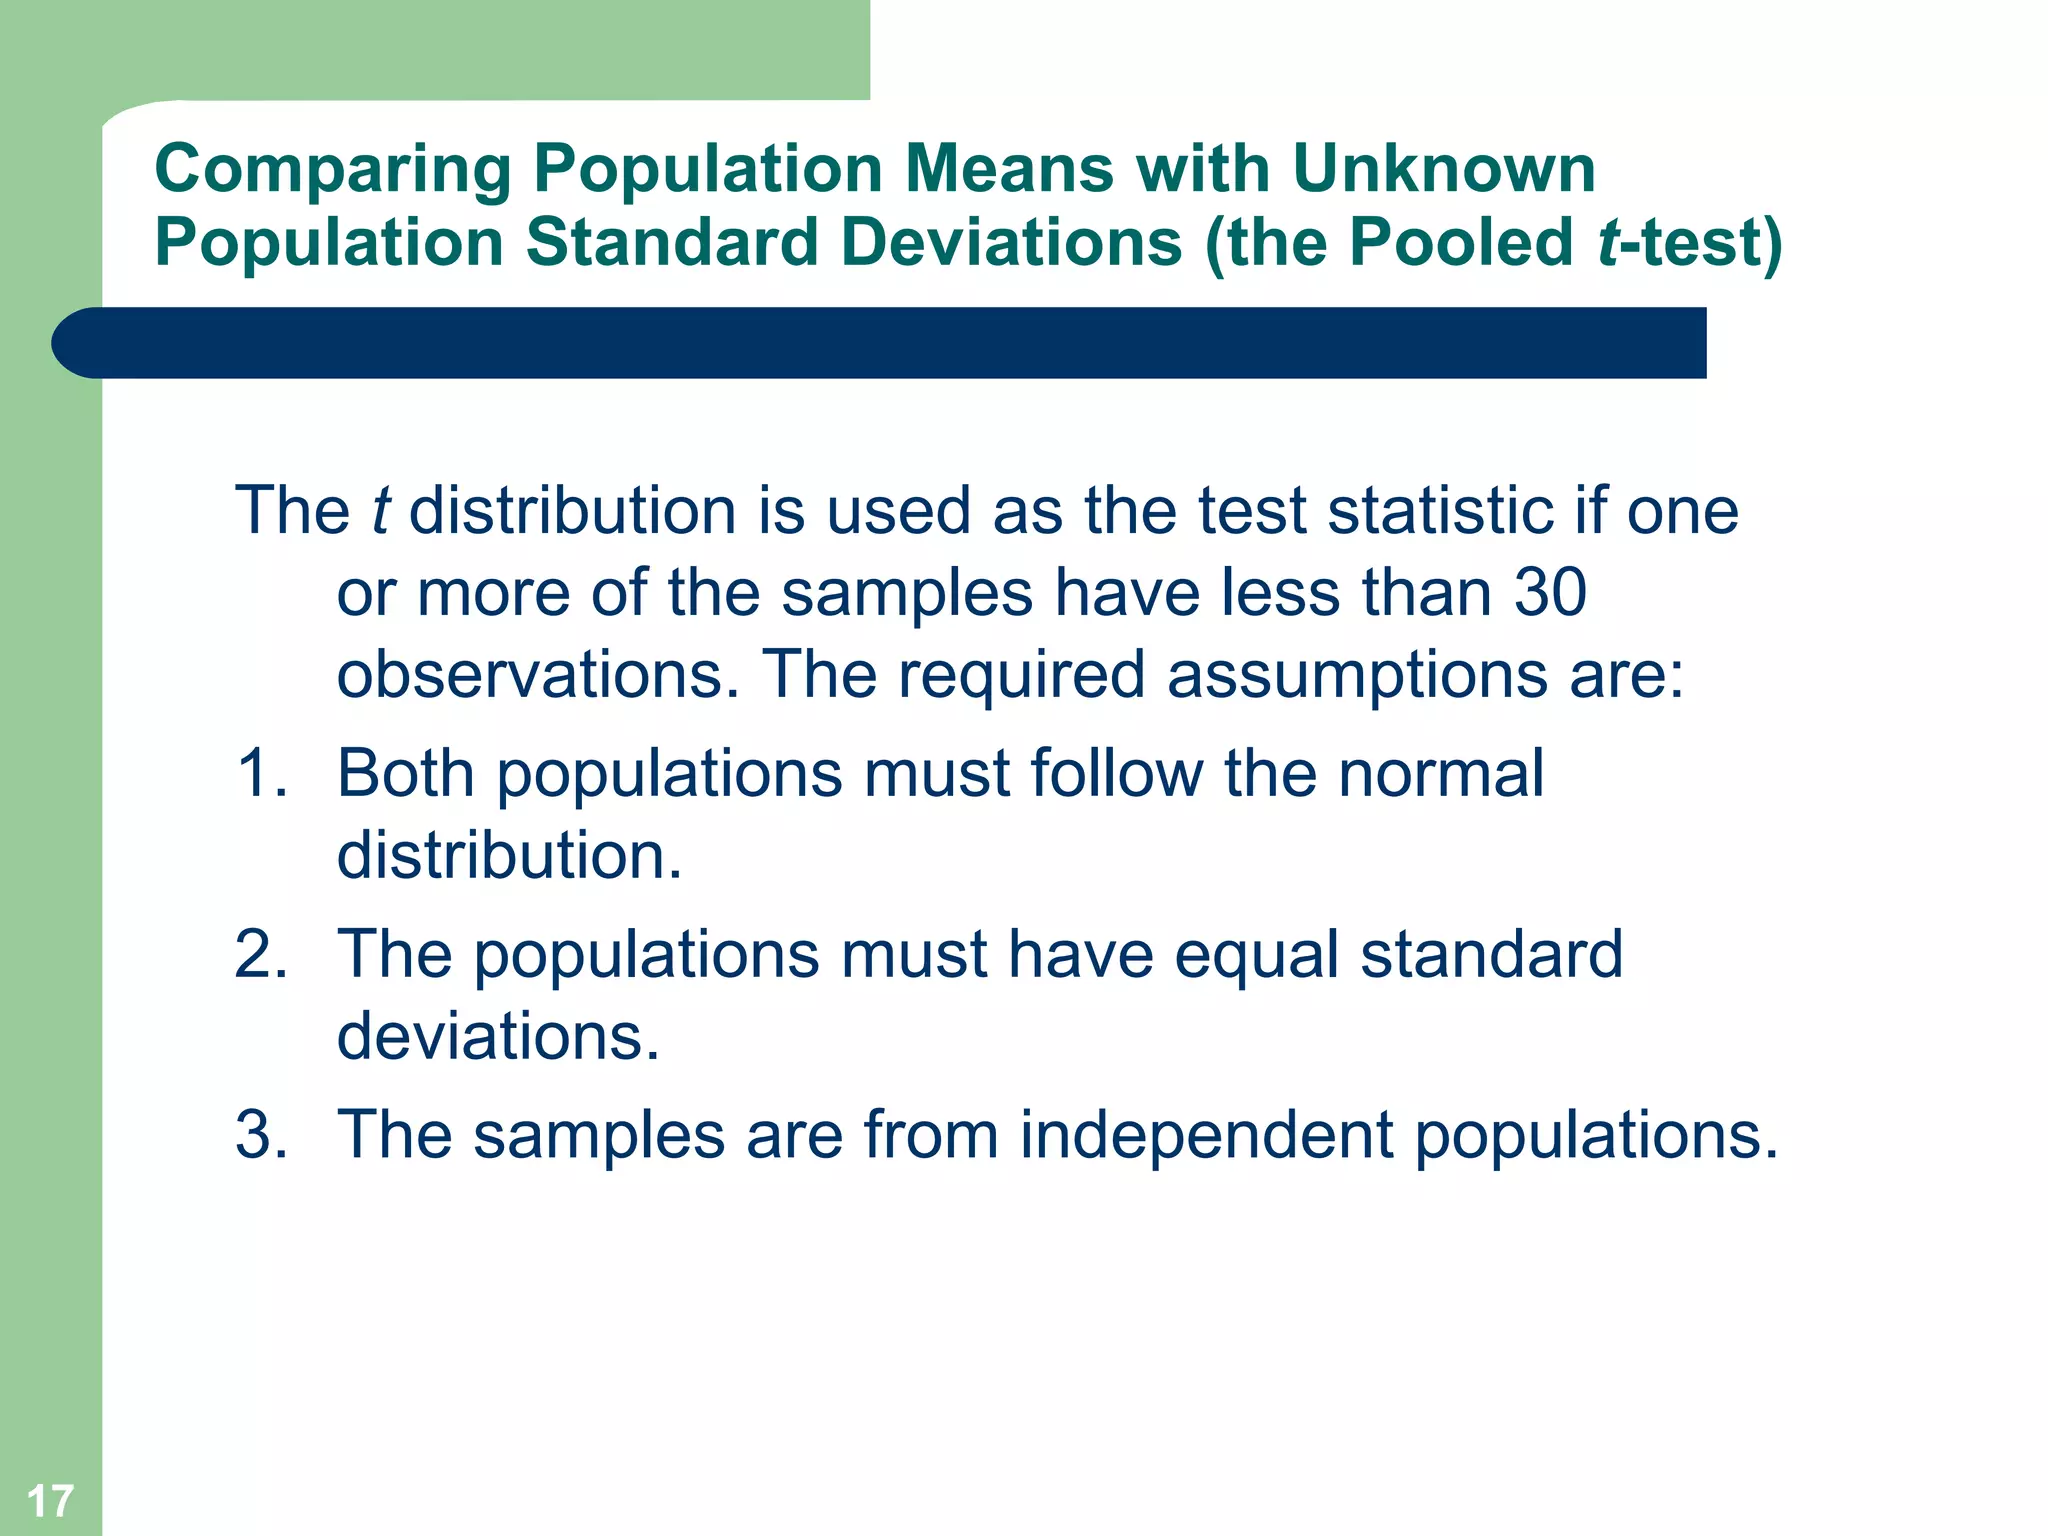
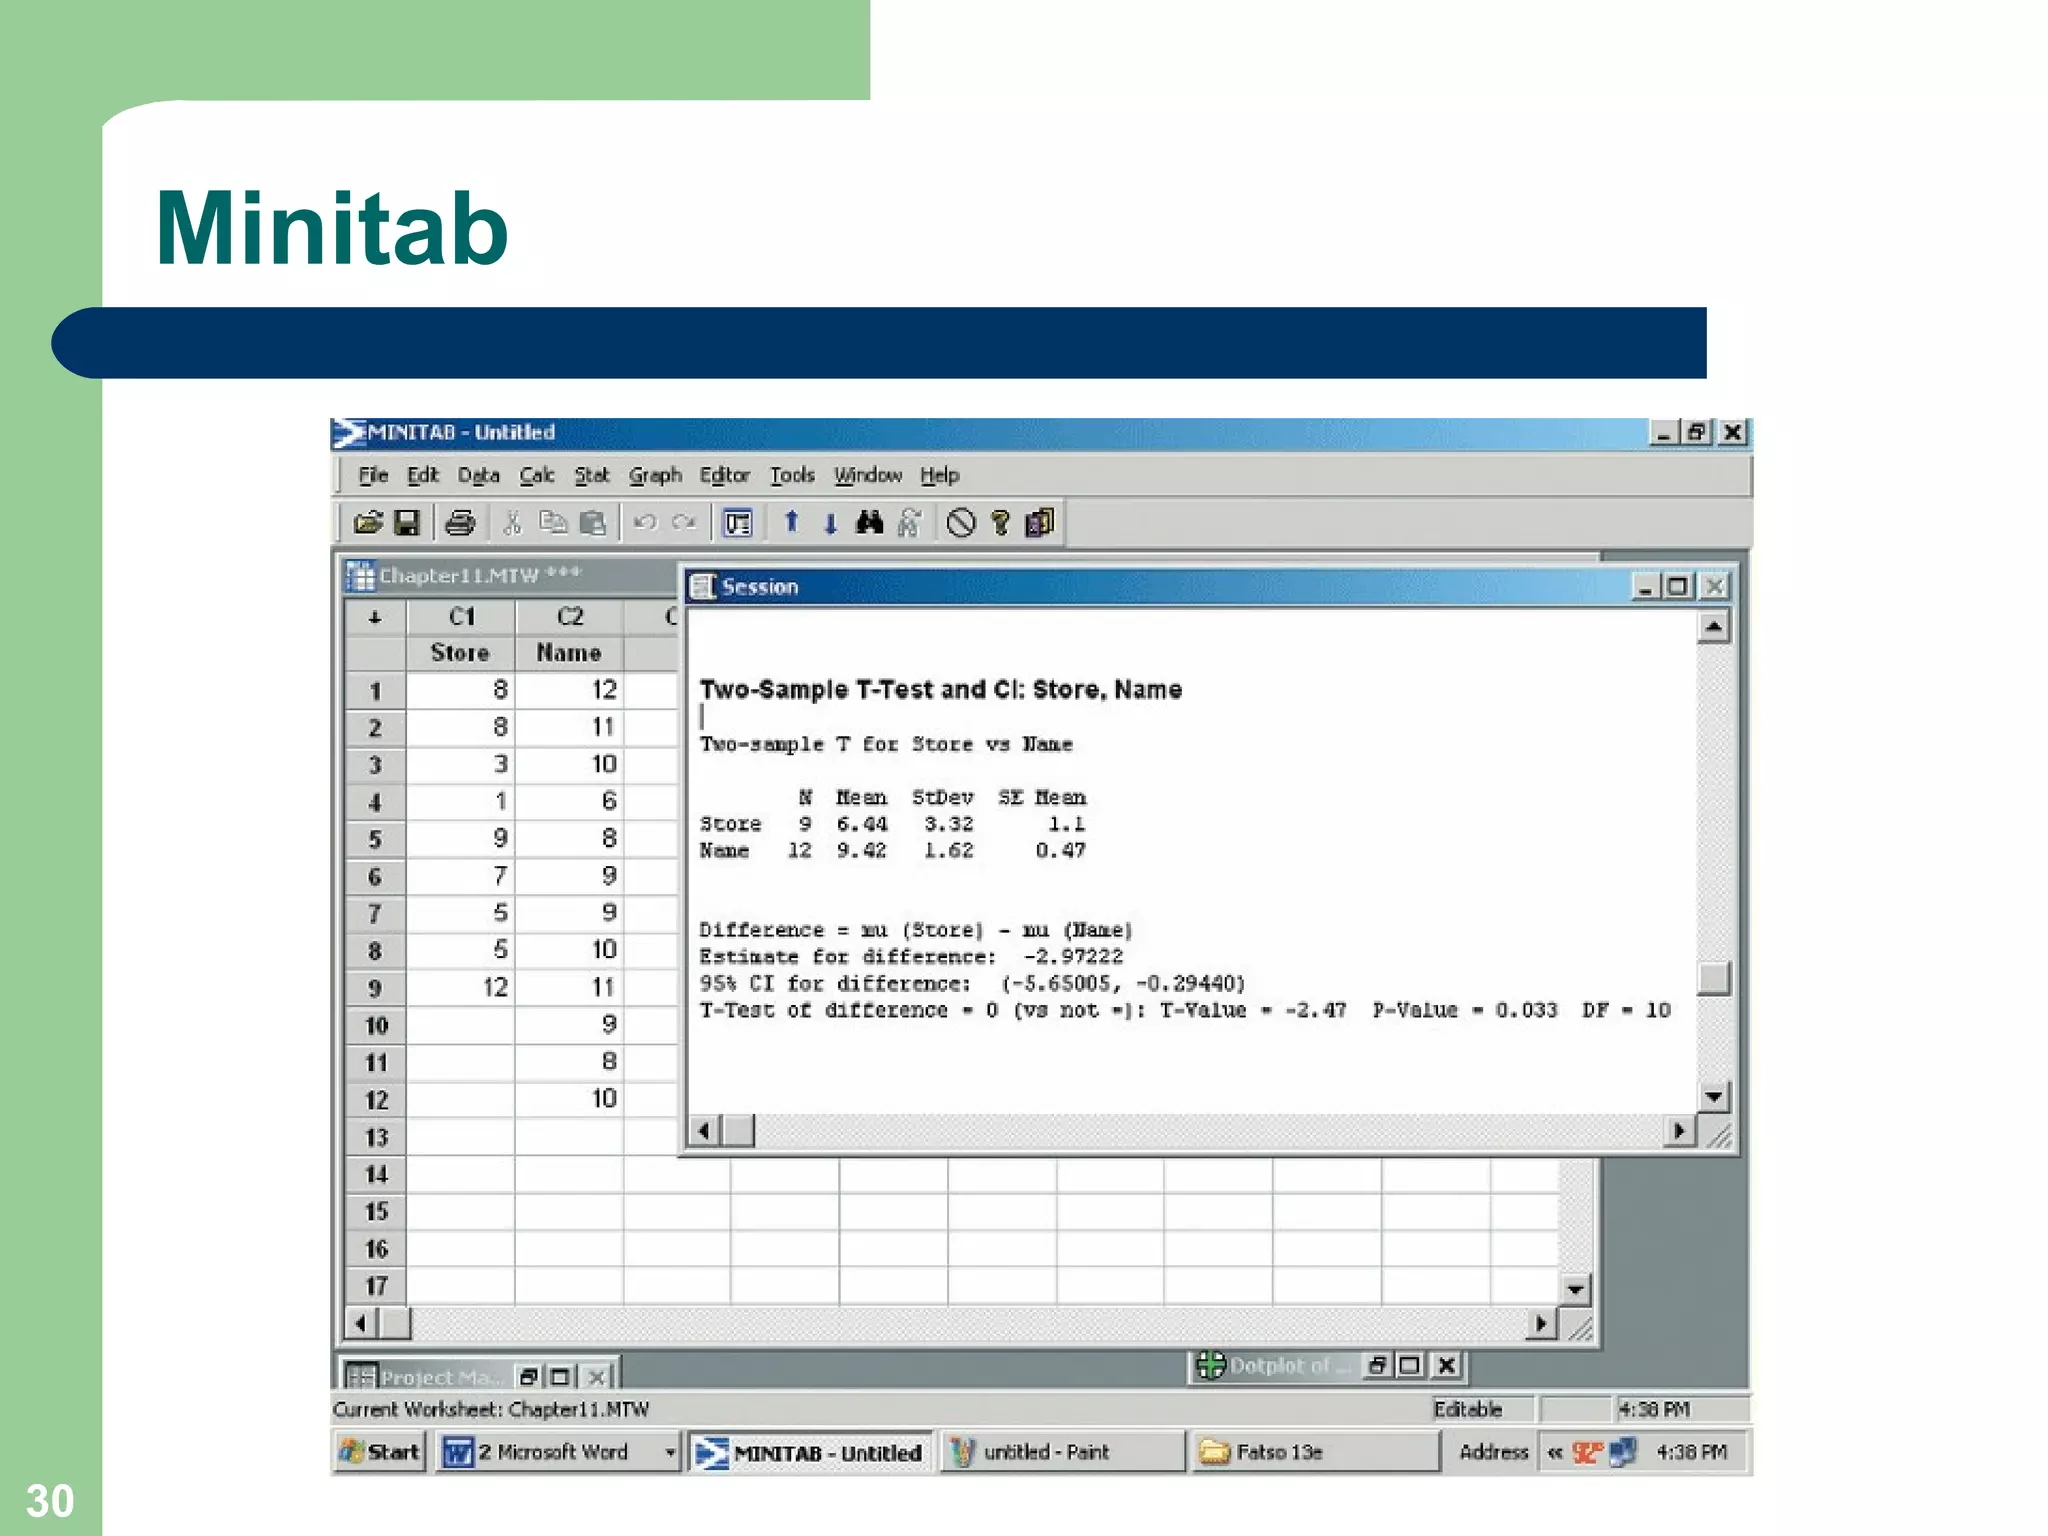
Two-sample Tests of Hypothesis Chapter 11
GOALS Conduct a test of a hypothesis about the difference between two independent population means. Conduct a test of a hypothesis about the difference between two population proportions. Conduct a test of a hypothesis about the mean difference between paired or dependent observations. Understand the difference between dependent and independent samples.
Comparing two populations – Some Examples  Is there a difference in the mean value of residential real estate sold by male agents and female agents in south Florida? Is there a difference in the mean number of defects produced on the day and the afternoon shifts at Kimble Products? Is there a difference in the mean number of days absent between young workers (under 21 years of age) and older workers (more than 60 years of age) in the fast-food industry? Is there is a difference in the proportion of Ohio State University graduates and University of Cincinnati graduates who pass the state Certified Public Accountant Examination on their first attempt? Is there an increase in the production rate if music is piped into the production area?
Comparing Two Population Means If no assumptions about the shape of the populations are required. The samples are from independent populations. The formula for computing the value of  z  is:
EXAMPLE 1 The U-Scan facility was recently installed at the Byrne Road Food-Town location. The store manager would like to know if the  mean checkout time  using the standard checkout method  is longer  than using the U-Scan. She gathered the following sample information. The time is measured from when the customer enters the line until their bags are in the cart. Hence the time includes both waiting in line and checking out.
EXAMPLE 1  continued Step 1:  State the null and alternate hypotheses.  H 0 :  µ S  ≤ µ U  H 1 :  µ S  > µ U Step 2:   State the level of significance.  The .01 significance level is stated in the problem. Step 3:  Find the appropriate test statistic.   Because both samples are more than 30, we can use  z-distribution  as the test statistic.
Example 1  continued Step 4:  State the decision rule.   Reject H 0  if Z > Z    Z > 2.33
Example 1  continued Step 5:   Compute the value of  z  and make a decision The computed value of 3.13 is larger than the critical value of 2.33. Our decision is to reject the null hypothesis. The difference of .20 minutes between the mean checkout time using the standard method is too large to have occurred by chance. We conclude the U-Scan method is faster.
Two-Sample Tests about Proportions Here are several examples. The vice president of human resources wishes to know whether there is a difference in the proportion of hourly employees who miss more than 5 days of work per year at the Atlanta and the Houston plants. General Motors is considering a new design for the Pontiac Grand Am. The design is shown to a group of potential buyers under 30 years of age and another group over 60 years of age. Pontiac wishes to know whether there is a difference in the proportion of the two groups who like the new design. A consultant to the airline industry is investigating the fear of flying among adults. Specifically, the company wishes to know whether there is a difference in the proportion of men versus women who are fearful of flying.
Two Sample Tests of Proportions We investigate whether two samples came from populations with an equal proportion of successes. The two samples are pooled using the following formula.
Two Sample Tests of Proportions  continued The value of the test statistic is computed from the following formula.
Two Sample Tests of Proportions - Example Manelli Perfume Company recently developed a new fragrance that it plans to market under the name Heavenly. A number of market studies indicate that Heavenly has very good market potential. The Sales Department at Manelli is particularly interested in whether  there is a difference in the proportions of younger and older  women who would purchase Heavenly if it were marketed. There are two independent populations, a population consisting of the younger women and a population consisting of the older women. Each sampled woman will be asked to smell Heavenly and indicate whether she likes the fragrance well enough to purchase a bottle.
Step 1:  State the null and alternate hypotheses.  H 0 :   1  =     2  H 1 :     1  ≠     2 Step 2:   State the level of significance.  The .05 significance level is stated in the problem. Step 3:  Find the appropriate test statistic.   We will use the z-distribution Two Sample Tests of Proportions - Example
Step 4:  State the decision rule.   Reject H 0  if Z > Z  /2   or  Z < - Z  /2   Z > 1.96 or Z < -1.96  Two Sample Tests of Proportions - Example
Step 5:   Compute the value of  z  and make a decision Two Sample Tests of Proportions - Example The computed value of 2.21 is in the area of rejection.  Therefore, the null hypothesis is rejected at the .05 significance level. To put it another way, we reject the null hypothesis that the proportion of young women who would purchase Heavenly is equal to the proportion of older women who would purchase Heavenly.
Two Sample Tests of Proportions – Example (Minitab Solution)
Comparing Population Means with Unknown Population Standard Deviations (the Pooled  t -test) The  t  distribution is used as the test statistic if one or more of the samples have less than 30 observations. The required assumptions are: 1. Both populations must follow the normal distribution. 2. The populations must have equal standard deviations. 3. The samples are from independent populations.
Small sample test of means  continued Finding the value of the test statistic requires two steps. Pool the sample standard deviations.  Use the pooled standard deviation in the formula.
Comparing Population Means with Unknown Population Standard Deviations (the Pooled  t -test) Owens Lawn Care, Inc., manufactures and assembles lawnmowers that are shipped to dealers throughout the United States and Canada. Two different procedures have been proposed for mounting the engine on the frame of the lawnmower. The question is: Is there a difference in the mean time to mount the engines on the frames of the lawnmowers? The first procedure was developed by longtime Owens employee Herb Welles (designated as procedure 1), and the other procedure was developed by Owens Vice President of Engineering William Atkins (designated as procedure 2). To evaluate the two methods, it was decided to conduct a time and motion study.  A sample of five employees was timed using the Welles method and six using the Atkins method. The results, in minutes, are shown on the right.  Is there a difference in the mean mounting times? Use the .10 significance level.
Step 1:  State the null and alternate hypotheses.  H 0 :  µ 1  = µ 2  H 1 :  µ 1  ≠ µ 2 Step 2:   State the level of significance. The .10 significance level is stated in the problem. Step 3:  Find the appropriate test statistic.   Because the population standard deviations are not known but are assumed to be equal, we use the pooled  t -test. Comparing Population Means with Unknown Population Standard Deviations (the Pooled  t -test) - Example
Step 4:  State the decision rule.   Reject H 0  if t > t  /2,n1+n2-2  or  t < - t  /2,n1+n2-2  t > t .05,9  or  t < - t .05,9  t > 1.833   or  t < - 1.833   Comparing Population Means with Unknown Population Standard Deviations (the Pooled  t -test) - Example
Step 5:   Compute the value of  t  and make a decision Comparing Population Means with Unknown Population Standard Deviations (the Pooled  t -test) - Example (a) Calculate the sample standard deviations
Step 5:   Compute the value of  t  and make a decision Comparing Population Means with Unknown Population Standard Deviations (the Pooled  t -test) - Example The decision is  not to reject the null hypothesis , because  0.662 falls in the region between -1.833 and 1.833 . We conclude that there is  no difference  in the mean times to mount the engine on the frame using the two methods.  -0.662
Comparing Population Means with Unknown Population Standard Deviations (the Pooled  t -test) - Example
Comparing Population Means with Unequal Population Standard Deviations If it is not reasonable to assume the population standard deviations are equal, then we compute the  t -statistic shown on the right. The sample standard deviations  s 1  and  s 2  are used in place of the respective population standard deviations.  In addition, the degrees of freedom are adjusted downward by a rather complex  approximation formula. The effect is to reduce the number of degrees of freedom in the test, which will require a larger value of the test statistic to reject the null hypothesis.
Comparing Population Means with Unequal Population Standard Deviations - Example Personnel in a consumer testing laboratory are evaluating the absorbency of paper towels. They wish to compare a set of store brand towels to a similar group of name brand ones. For each brand they dip a ply of the paper into a tub of fluid, allow  the paper to drain back into the vat for two minutes, and then evaluate the amount of liquid the paper has taken up from the vat. A random sample of 9 store brand paper towels absorbed the following amounts of liquid in milliliters.  8  8  3  1  9  7  5  5  12 An independent random sample of 12 name brand towels absorbed the following amounts of liquid in milliliters: 12  11  10  6  8  9  9  10  11  9  8  10 Use the .10 significance level and test if there is a  difference  in the mean amount of liquid absorbed by the two types of paper towels.
Comparing Population Means with Unequal Population Standard Deviations - Example The  following dot plot provided by MINITAB shows the variances to be unequal.
Step 1:  State the null and alternate hypotheses.  H 0 :   1  =   2  H 1 :   1  ≠   2 Step 2:   State the level of significance.  The .10 significance level is stated in the problem. Step 3:  Find the appropriate test statistic.   We will use  unequal variances   t -test  Comparing Population Means with Unequal Population Standard Deviations - Example
Step 4:  State the decision rule. Reject H 0  if  t  >  t  /2d.f.   or  t  < -  t  /2,d.f.   t  >  t .05,10   or  t  < -  t . 05, 10 t  > 1.812 or  t  < - 1 .812   Step 5:   Compute the value of  t  and make a decision  Comparing Population Means with Unequal Population Standard Deviations - Example The computed value of  t  is less than the lower critical value, so our decision is to reject the null hypothesis. We conclude that the mean absorption rate for the two towels is not the same.
Minitab
Two-Sample Tests of Hypothesis: Dependent Samples Dependent samples  are samples that are paired or related in some fashion.  For example: If you wished to buy a car you would look at the  same  car at two (or more)  different  dealerships and compare the prices.  If you wished to measure the effectiveness of a new diet you would weigh the dieters at the start and at the finish of the program.
Hypothesis Testing Involving Paired Observations Use the following test when the samples are  dependent: Where is the mean of the differences s d   is the standard deviation of the differences n  is the number of pairs (differences)
Nickel Savings and Loan wishes to compare the two companies it uses to appraise the value of residential homes. Nickel Savings selected a sample of 10 residential properties and scheduled both firms for an appraisal. The results, reported in $000, are shown on the table (right).  At the .05 significance level, can we conclude there is a difference in the mean appraised values of the homes? Hypothesis Testing Involving Paired Observations - Example
Step 1:  State the null and alternate hypotheses.  H 0 :   d  = 0   H 1 :   d  ≠ 0 Step 2:   State the level of significance.  The .05 significance level is stated in the problem. Step 3:  Find the appropriate test statistic.   We will use the  t -test  Hypothesis Testing Involving Paired Observations - Example
Step 4:  State the decision rule. Reject H 0  if  t  >  t  /2, n-1   or  t  < -  t  /2,n-1   t  >  t .025,9   or  t  < -  t . 025, 9 t  > 2.262 or  t  < -2.262   Hypothesis Testing Involving Paired Observations - Example
Step 5:   Compute the value of  t  and make a decision  Hypothesis Testing Involving Paired Observations - Example The computed value of  t  is greater than the higher critical value, so our decision is to reject the null hypothesis. We conclude that  there is a difference  in the mean appraised values of the homes.
Hypothesis Testing Involving Paired Observations – Excel Example
Reasons for Pairing Before and after analysis.  Performance measured before and after some intervention Differing treatments (2 of them) to same object.  Example:  appraisals by different appraisers.  Measurements by different experts—blood sugar by different labs
End of Chapter 11

Chapter 11

  • 1.
    Two-sample Tests ofHypothesis Chapter 11
  • 2.
    GOALS Conduct atest of a hypothesis about the difference between two independent population means. Conduct a test of a hypothesis about the difference between two population proportions. Conduct a test of a hypothesis about the mean difference between paired or dependent observations. Understand the difference between dependent and independent samples.
  • 3.
    Comparing two populations– Some Examples Is there a difference in the mean value of residential real estate sold by male agents and female agents in south Florida? Is there a difference in the mean number of defects produced on the day and the afternoon shifts at Kimble Products? Is there a difference in the mean number of days absent between young workers (under 21 years of age) and older workers (more than 60 years of age) in the fast-food industry? Is there is a difference in the proportion of Ohio State University graduates and University of Cincinnati graduates who pass the state Certified Public Accountant Examination on their first attempt? Is there an increase in the production rate if music is piped into the production area?
  • 4.
    Comparing Two PopulationMeans If no assumptions about the shape of the populations are required. The samples are from independent populations. The formula for computing the value of z is:
  • 5.
    EXAMPLE 1 TheU-Scan facility was recently installed at the Byrne Road Food-Town location. The store manager would like to know if the mean checkout time using the standard checkout method is longer than using the U-Scan. She gathered the following sample information. The time is measured from when the customer enters the line until their bags are in the cart. Hence the time includes both waiting in line and checking out.
  • 6.
    EXAMPLE 1 continued Step 1: State the null and alternate hypotheses. H 0 : µ S ≤ µ U H 1 : µ S > µ U Step 2: State the level of significance. The .01 significance level is stated in the problem. Step 3: Find the appropriate test statistic. Because both samples are more than 30, we can use z-distribution as the test statistic.
  • 7.
    Example 1 continued Step 4: State the decision rule. Reject H 0 if Z > Z  Z > 2.33
  • 8.
    Example 1 continued Step 5: Compute the value of z and make a decision The computed value of 3.13 is larger than the critical value of 2.33. Our decision is to reject the null hypothesis. The difference of .20 minutes between the mean checkout time using the standard method is too large to have occurred by chance. We conclude the U-Scan method is faster.
  • 9.
    Two-Sample Tests aboutProportions Here are several examples. The vice president of human resources wishes to know whether there is a difference in the proportion of hourly employees who miss more than 5 days of work per year at the Atlanta and the Houston plants. General Motors is considering a new design for the Pontiac Grand Am. The design is shown to a group of potential buyers under 30 years of age and another group over 60 years of age. Pontiac wishes to know whether there is a difference in the proportion of the two groups who like the new design. A consultant to the airline industry is investigating the fear of flying among adults. Specifically, the company wishes to know whether there is a difference in the proportion of men versus women who are fearful of flying.
  • 10.
    Two Sample Testsof Proportions We investigate whether two samples came from populations with an equal proportion of successes. The two samples are pooled using the following formula.
  • 11.
    Two Sample Testsof Proportions continued The value of the test statistic is computed from the following formula.
  • 12.
    Two Sample Testsof Proportions - Example Manelli Perfume Company recently developed a new fragrance that it plans to market under the name Heavenly. A number of market studies indicate that Heavenly has very good market potential. The Sales Department at Manelli is particularly interested in whether there is a difference in the proportions of younger and older women who would purchase Heavenly if it were marketed. There are two independent populations, a population consisting of the younger women and a population consisting of the older women. Each sampled woman will be asked to smell Heavenly and indicate whether she likes the fragrance well enough to purchase a bottle.
  • 13.
    Step 1: State the null and alternate hypotheses. H 0 :  1 =  2 H 1 :  1 ≠  2 Step 2: State the level of significance. The .05 significance level is stated in the problem. Step 3: Find the appropriate test statistic. We will use the z-distribution Two Sample Tests of Proportions - Example
  • 14.
    Step 4: State the decision rule. Reject H 0 if Z > Z  /2 or Z < - Z  /2 Z > 1.96 or Z < -1.96 Two Sample Tests of Proportions - Example
  • 15.
    Step 5: Compute the value of z and make a decision Two Sample Tests of Proportions - Example The computed value of 2.21 is in the area of rejection. Therefore, the null hypothesis is rejected at the .05 significance level. To put it another way, we reject the null hypothesis that the proportion of young women who would purchase Heavenly is equal to the proportion of older women who would purchase Heavenly.
  • 16.
    Two Sample Testsof Proportions – Example (Minitab Solution)
  • 17.
    Comparing Population Meanswith Unknown Population Standard Deviations (the Pooled t -test) The t distribution is used as the test statistic if one or more of the samples have less than 30 observations. The required assumptions are: 1. Both populations must follow the normal distribution. 2. The populations must have equal standard deviations. 3. The samples are from independent populations.
  • 18.
    Small sample testof means continued Finding the value of the test statistic requires two steps. Pool the sample standard deviations. Use the pooled standard deviation in the formula.
  • 19.
    Comparing Population Meanswith Unknown Population Standard Deviations (the Pooled t -test) Owens Lawn Care, Inc., manufactures and assembles lawnmowers that are shipped to dealers throughout the United States and Canada. Two different procedures have been proposed for mounting the engine on the frame of the lawnmower. The question is: Is there a difference in the mean time to mount the engines on the frames of the lawnmowers? The first procedure was developed by longtime Owens employee Herb Welles (designated as procedure 1), and the other procedure was developed by Owens Vice President of Engineering William Atkins (designated as procedure 2). To evaluate the two methods, it was decided to conduct a time and motion study. A sample of five employees was timed using the Welles method and six using the Atkins method. The results, in minutes, are shown on the right. Is there a difference in the mean mounting times? Use the .10 significance level.
  • 20.
    Step 1: State the null and alternate hypotheses. H 0 : µ 1 = µ 2 H 1 : µ 1 ≠ µ 2 Step 2: State the level of significance. The .10 significance level is stated in the problem. Step 3: Find the appropriate test statistic. Because the population standard deviations are not known but are assumed to be equal, we use the pooled t -test. Comparing Population Means with Unknown Population Standard Deviations (the Pooled t -test) - Example
  • 21.
    Step 4: State the decision rule. Reject H 0 if t > t  /2,n1+n2-2 or t < - t  /2,n1+n2-2 t > t .05,9 or t < - t .05,9 t > 1.833 or t < - 1.833 Comparing Population Means with Unknown Population Standard Deviations (the Pooled t -test) - Example
  • 22.
    Step 5: Compute the value of t and make a decision Comparing Population Means with Unknown Population Standard Deviations (the Pooled t -test) - Example (a) Calculate the sample standard deviations
  • 23.
    Step 5: Compute the value of t and make a decision Comparing Population Means with Unknown Population Standard Deviations (the Pooled t -test) - Example The decision is not to reject the null hypothesis , because 0.662 falls in the region between -1.833 and 1.833 . We conclude that there is no difference in the mean times to mount the engine on the frame using the two methods. -0.662
  • 24.
    Comparing Population Meanswith Unknown Population Standard Deviations (the Pooled t -test) - Example
  • 25.
    Comparing Population Meanswith Unequal Population Standard Deviations If it is not reasonable to assume the population standard deviations are equal, then we compute the t -statistic shown on the right. The sample standard deviations s 1 and s 2 are used in place of the respective population standard deviations. In addition, the degrees of freedom are adjusted downward by a rather complex approximation formula. The effect is to reduce the number of degrees of freedom in the test, which will require a larger value of the test statistic to reject the null hypothesis.
  • 26.
    Comparing Population Meanswith Unequal Population Standard Deviations - Example Personnel in a consumer testing laboratory are evaluating the absorbency of paper towels. They wish to compare a set of store brand towels to a similar group of name brand ones. For each brand they dip a ply of the paper into a tub of fluid, allow the paper to drain back into the vat for two minutes, and then evaluate the amount of liquid the paper has taken up from the vat. A random sample of 9 store brand paper towels absorbed the following amounts of liquid in milliliters. 8 8 3 1 9 7 5 5 12 An independent random sample of 12 name brand towels absorbed the following amounts of liquid in milliliters: 12 11 10 6 8 9 9 10 11 9 8 10 Use the .10 significance level and test if there is a difference in the mean amount of liquid absorbed by the two types of paper towels.
  • 27.
    Comparing Population Meanswith Unequal Population Standard Deviations - Example The following dot plot provided by MINITAB shows the variances to be unequal.
  • 28.
    Step 1: State the null and alternate hypotheses. H 0 :  1 =  2 H 1 :  1 ≠  2 Step 2: State the level of significance. The .10 significance level is stated in the problem. Step 3: Find the appropriate test statistic. We will use unequal variances t -test Comparing Population Means with Unequal Population Standard Deviations - Example
  • 29.
    Step 4: State the decision rule. Reject H 0 if t > t  /2d.f. or t < - t  /2,d.f. t > t .05,10 or t < - t . 05, 10 t > 1.812 or t < - 1 .812 Step 5: Compute the value of t and make a decision Comparing Population Means with Unequal Population Standard Deviations - Example The computed value of t is less than the lower critical value, so our decision is to reject the null hypothesis. We conclude that the mean absorption rate for the two towels is not the same.
  • 30.
  • 31.
    Two-Sample Tests ofHypothesis: Dependent Samples Dependent samples are samples that are paired or related in some fashion. For example: If you wished to buy a car you would look at the same car at two (or more) different dealerships and compare the prices. If you wished to measure the effectiveness of a new diet you would weigh the dieters at the start and at the finish of the program.
  • 32.
    Hypothesis Testing InvolvingPaired Observations Use the following test when the samples are dependent: Where is the mean of the differences s d is the standard deviation of the differences n is the number of pairs (differences)
  • 33.
    Nickel Savings andLoan wishes to compare the two companies it uses to appraise the value of residential homes. Nickel Savings selected a sample of 10 residential properties and scheduled both firms for an appraisal. The results, reported in $000, are shown on the table (right). At the .05 significance level, can we conclude there is a difference in the mean appraised values of the homes? Hypothesis Testing Involving Paired Observations - Example
  • 34.
    Step 1: State the null and alternate hypotheses. H 0 :  d = 0 H 1 :  d ≠ 0 Step 2: State the level of significance. The .05 significance level is stated in the problem. Step 3: Find the appropriate test statistic. We will use the t -test Hypothesis Testing Involving Paired Observations - Example
  • 35.
    Step 4: State the decision rule. Reject H 0 if t > t  /2, n-1 or t < - t  /2,n-1 t > t .025,9 or t < - t . 025, 9 t > 2.262 or t < -2.262 Hypothesis Testing Involving Paired Observations - Example
  • 36.
    Step 5: Compute the value of t and make a decision Hypothesis Testing Involving Paired Observations - Example The computed value of t is greater than the higher critical value, so our decision is to reject the null hypothesis. We conclude that there is a difference in the mean appraised values of the homes.
  • 37.
    Hypothesis Testing InvolvingPaired Observations – Excel Example
  • 38.
    Reasons for PairingBefore and after analysis. Performance measured before and after some intervention Differing treatments (2 of them) to same object. Example: appraisals by different appraisers. Measurements by different experts—blood sugar by different labs
  • 39.