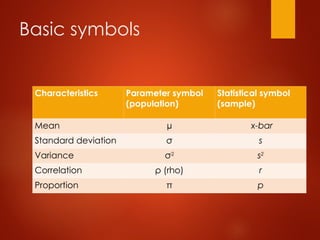
Basic symbols
Characteristics Parametersymbol
(population)
Statistical symbol
(sample)
Mean µ x-bar
Standard deviation σ s
Variance σ2
s2
Correlation ρ (rho) r
Proportion π p
3.
Basic related principles
Definesampling and population
Define alpha and beta errors - why to understand them is
important
Major types of sampling
4.
Sampling and Population
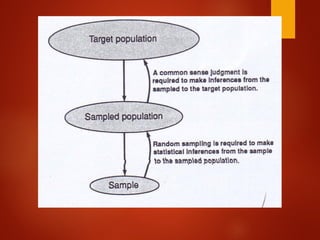
Theideal thing - to have all those eligible respondents/
subjects in the target population
Target population - need to define; based on title and
objectives
However, the ideal thing is IMPOSSIBLE!!
We need sampling procedure - each eligible respondents has
equal probability to be chosen as the respondents/ subjects
5.
Sampling and Population
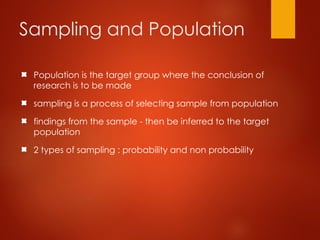
Populationis the target group where the conclusion of
research is to be made
sampling is a process of selecting sample from population
findings from the sample - then be inferred to the target
population
2 types of sampling : probability and non probability
8.
Major types ofsampling
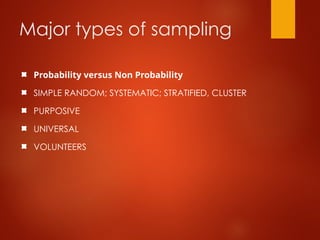
Probability versus Non Probability
SIMPLE RANDOM; SYSTEMATIC; STRATIFIED, CLUSTER
PURPOSIVE
UNIVERSAL
VOLUNTEERS
9.
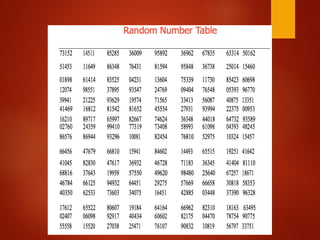
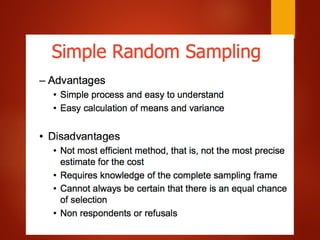
Simple random sampling
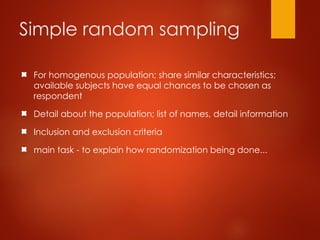
Forhomogenous population; share similar characteristics;
available subjects have equal chances to be chosen as
respondent
Detail about the population; list of names, detail information
Inclusion and exclusion criteria
main task - to explain how randomization being done...
12.
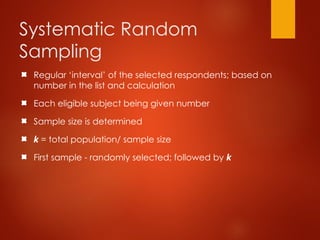
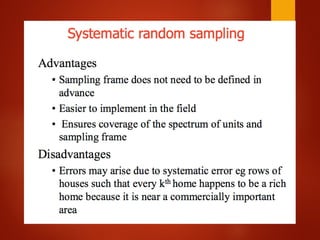
Systematic Random
Sampling
Regular ‘interval’of the selected respondents; based on
number in the list and calculation
Each eligible subject being given number
Sample size is determined
k = total population/ sample size
First sample - randomly selected; followed by k
14.
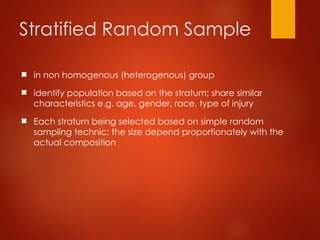
Stratified Random Sample
innon homogenous (heterogenous) group
identify population based on the stratum; share similar
characteristics e.g. age, gender, race, type of injury
Each stratum being selected based on simple random
sampling technic; the size depend proportionately with the
actual composition
15.
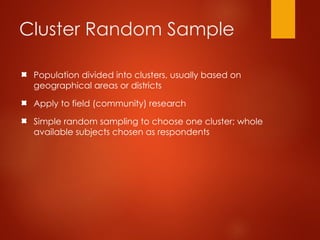
Cluster Random Sample
Populationdivided into clusters, usually based on
geographical areas or districts
Apply to field (community) research
Simple random sampling to choose one cluster; whole
available subjects chosen as respondents
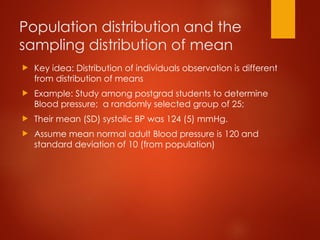
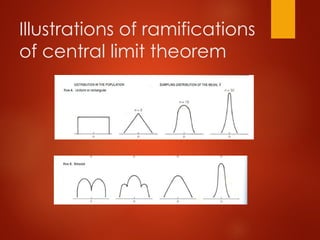
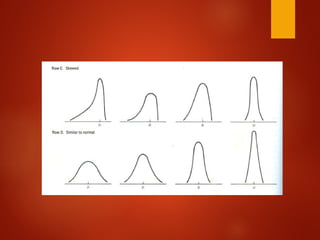
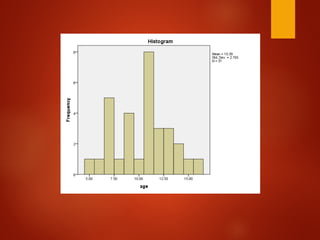
Population distribution andthe
sampling distribution of mean
Key idea: Distribution of individuals observation is different
from distribution of means
Example: Study among postgrad students to determine
Blood pressure; a randomly selected group of 25;
Their mean (SD) systolic BP was 124 (5) mmHg.
Assume mean normal adult Blood pressure is 120 and
standard deviation of 10 (from population)
20.
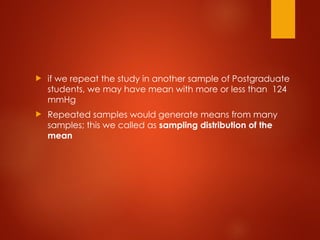
if werepeat the study in another sample of Postgraduate
students, we may have mean with more or less than 124
mmHg
Repeated samples would generate means from many
samples; this we called as sampling distribution of the
mean
21.
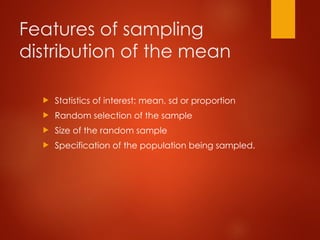
Features of sampling
distributionof the mean
Statistics of interest; mean, sd or proportion
Random selection of the sample
Size of the random sample
Specification of the population being sampled.
22.
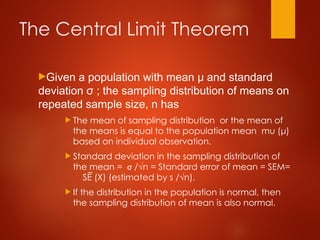
The Central LimitTheorem
Given a population with mean μ and standard
deviation σ ; the sampling distribution of means on
repeated sample size, n has
The mean of sampling distribution or the mean of
the means is equal to the population mean mu (μ)
based on individual observation.
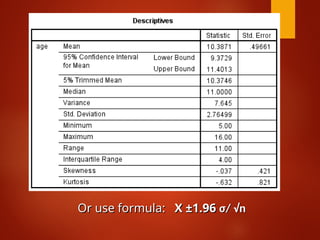
Standard deviation in the sampling distribution of
the mean = σ /√n = Standard error of mean = SEM=
SE (X) (estimated by s /√n).
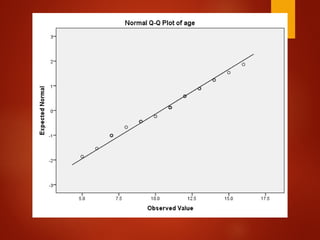
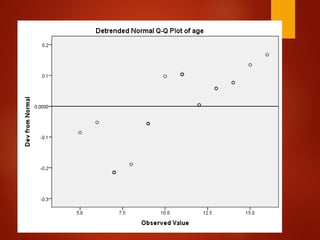
If the distribution in the population is normal, then
the sampling distribution of mean is also normal.
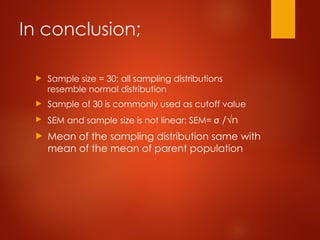
In conclusion;
Samplesize = 30; all sampling distributions
resemble normal distribution
Sample of 30 is commonly used as cutoff value
SEM and sample size is not linear; SEM= σ /√n
Mean of the sampling distribution same with
mean of the mean of parent population
26.
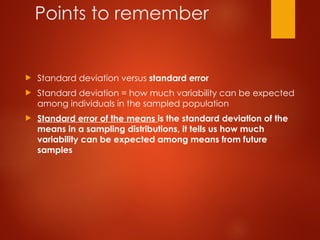
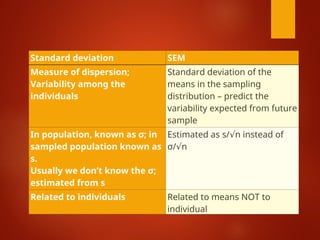
Points to remember
Standard deviation versus standard error
Standard deviation = how much variability can be expected
among individuals in the sampled population
Standard error of the means is the standard deviation of the
means in a sampling distributions, it tells us how much
variability can be expected among means from future
samples
27.
Interval definedby mean (2 sd) contains
approximately 95% of the individual observation;
similarly form mean (2 SE) contains 95%of the
means that would be observed in repeated same
size samples
28.
Standard deviation SEM
Measureof dispersion;
Variability among the
individuals
Standard deviation of the
means in the sampling
distribution – predict the
variability expected from future
sample
In population, known as σ; in
sampled population known as
s.
Usually we don’t know the σ;
estimated from s
Estimated as s/ n instead of
√
σ/ n
√
Related to individuals Related to means NOT to
individual
29.
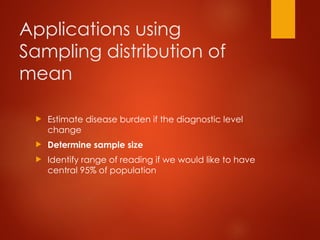
Applications using
Sampling distributionof
mean
Estimate disease burden if the diagnostic level
change
Determine sample size
Identify range of reading if we would like to have
central 95% of population
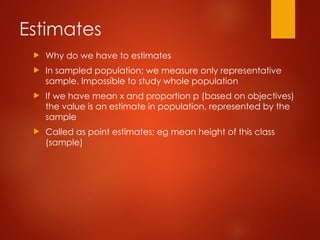
Estimates
Why dowe have to estimates
In sampled population; we measure only representative
sample. Impossible to study whole population
If we have mean x and proportion p (based on objectives)
the value is an estimate in population, represented by the
sample
Called as point estimates; eg mean height of this class
(sample)
32.
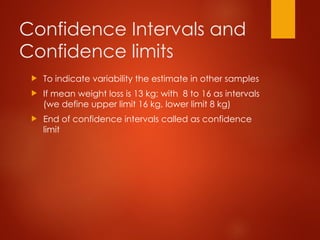
Confidence Intervals and
Confidencelimits
To indicate variability the estimate in other samples
If mean weight loss is 13 kg; with 8 to 16 as intervals
(we define upper limit 16 kg, lower limit 8 kg)
End of confidence intervals called as confidence
limit


![[DSC Europe 25] Dubravko Culibrk - Deep Learning for Mammography.pptx](https://cdn.slidesharecdn.com/ss_thumbnails/yiscimuktacgqoiu4dkp-deep-learning-for-mammography-260119121559-aad59182-thumbnail.jpg?width=640&height=640&fit=bounds)


![[DSC Europe 25] Bojan Djuricic - Predictive Design Process.pdf](https://cdn.slidesharecdn.com/ss_thumbnails/5awdrbedqdek3gqu2ezy-4-the-predictive-design-bojan-djuricic-260120105856-6c399e9b-thumbnail.jpg?width=640&height=640&fit=bounds)


![[DSC Europe 25] Harshvardhan Jain - From Pre-Trained to Purpose-Built: Fine-T...](https://cdn.slidesharecdn.com/ss_thumbnails/zru4zmiseku5tgvu2dgw-harshvardhan-jain-from-pre-trained-to-purpose-built-fine-tuning-llms-for-high-i-260119101520-8335585f-thumbnail.jpg?width=640&height=640&fit=bounds)

![[DSC Europe 25] Mikhail Rozhkov - AI Product Canvas: From Business Goals to T...](https://cdn.slidesharecdn.com/ss_thumbnails/d53doddtpgfqivmzqel6-mikhail-rozhkov-ai-product-canvas-v1-260121115910-9dd517a7-thumbnail.jpg?width=640&height=640&fit=bounds)

![[DSC Europe 25] Egor Krasheninnikov - The Control Stack: Building Guardrails ...](https://cdn.slidesharecdn.com/ss_thumbnails/3lzcz7hxqmo51mtalv4u-the-control-stack-260119101520-ea90841a-thumbnail.jpg?width=640&height=640&fit=bounds)

![[DSC Europe 25] Tali Fulman - Guild Meetings, Then What? Building Data Commun...](https://cdn.slidesharecdn.com/ss_thumbnails/fgohhi33rwmhqdowdj5k-tali-fulman-guild-meetings-then-what-building-data-communities-that-actually-ch-260120105855-528492c3-thumbnail.jpg?width=640&height=640&fit=bounds)


