Download to read offline
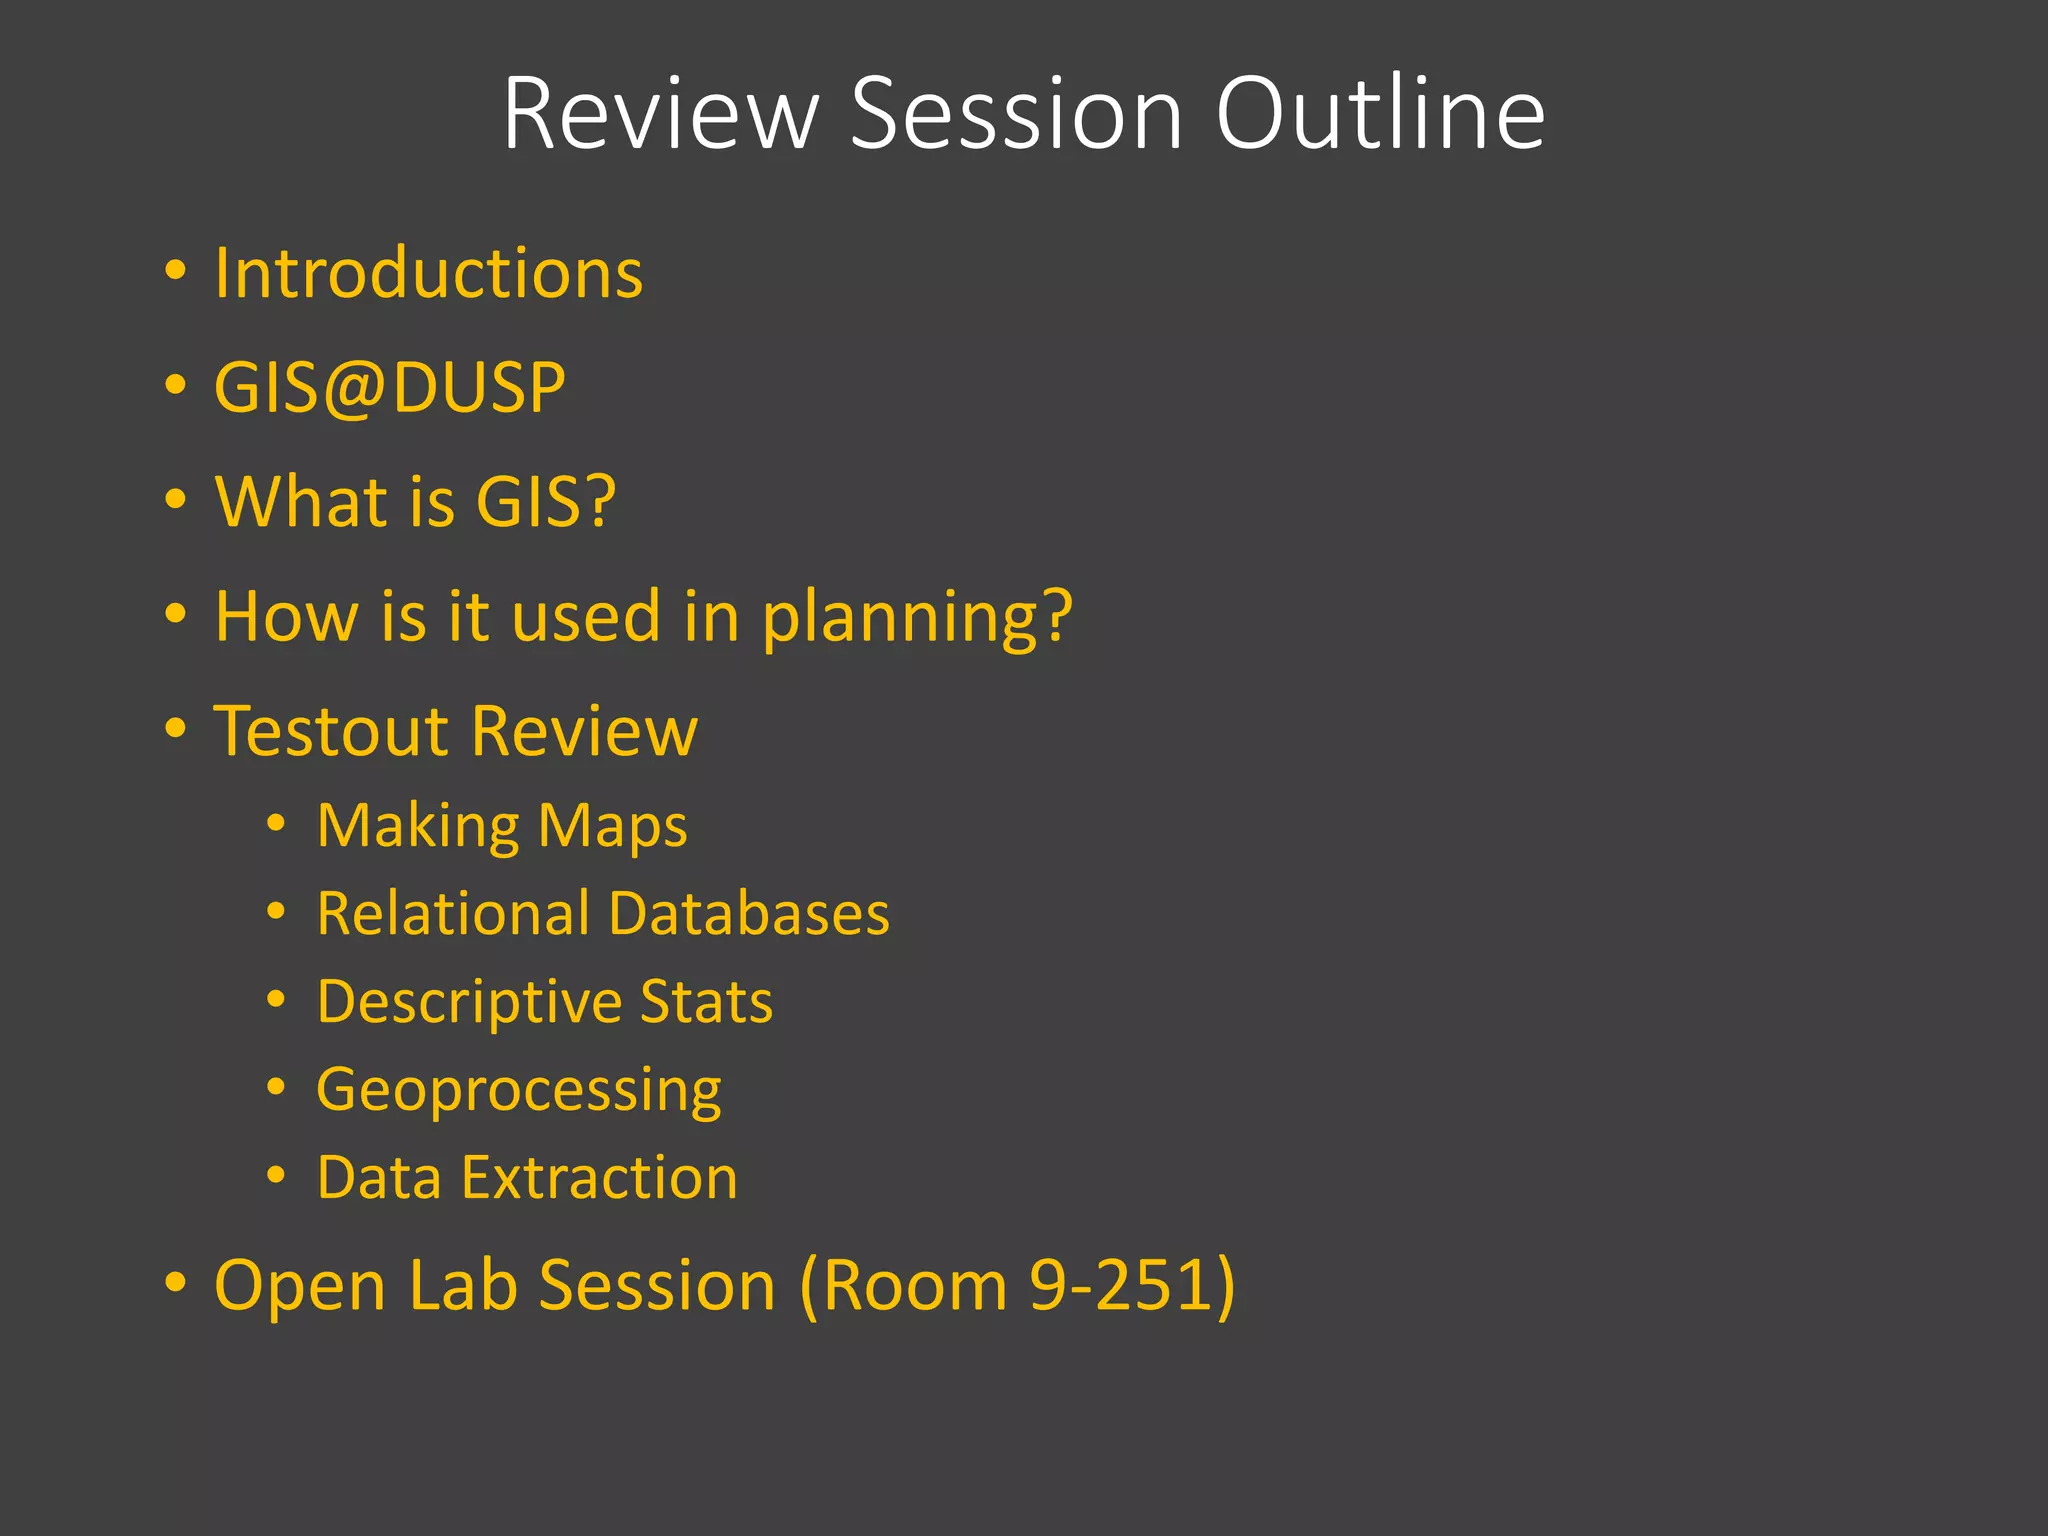
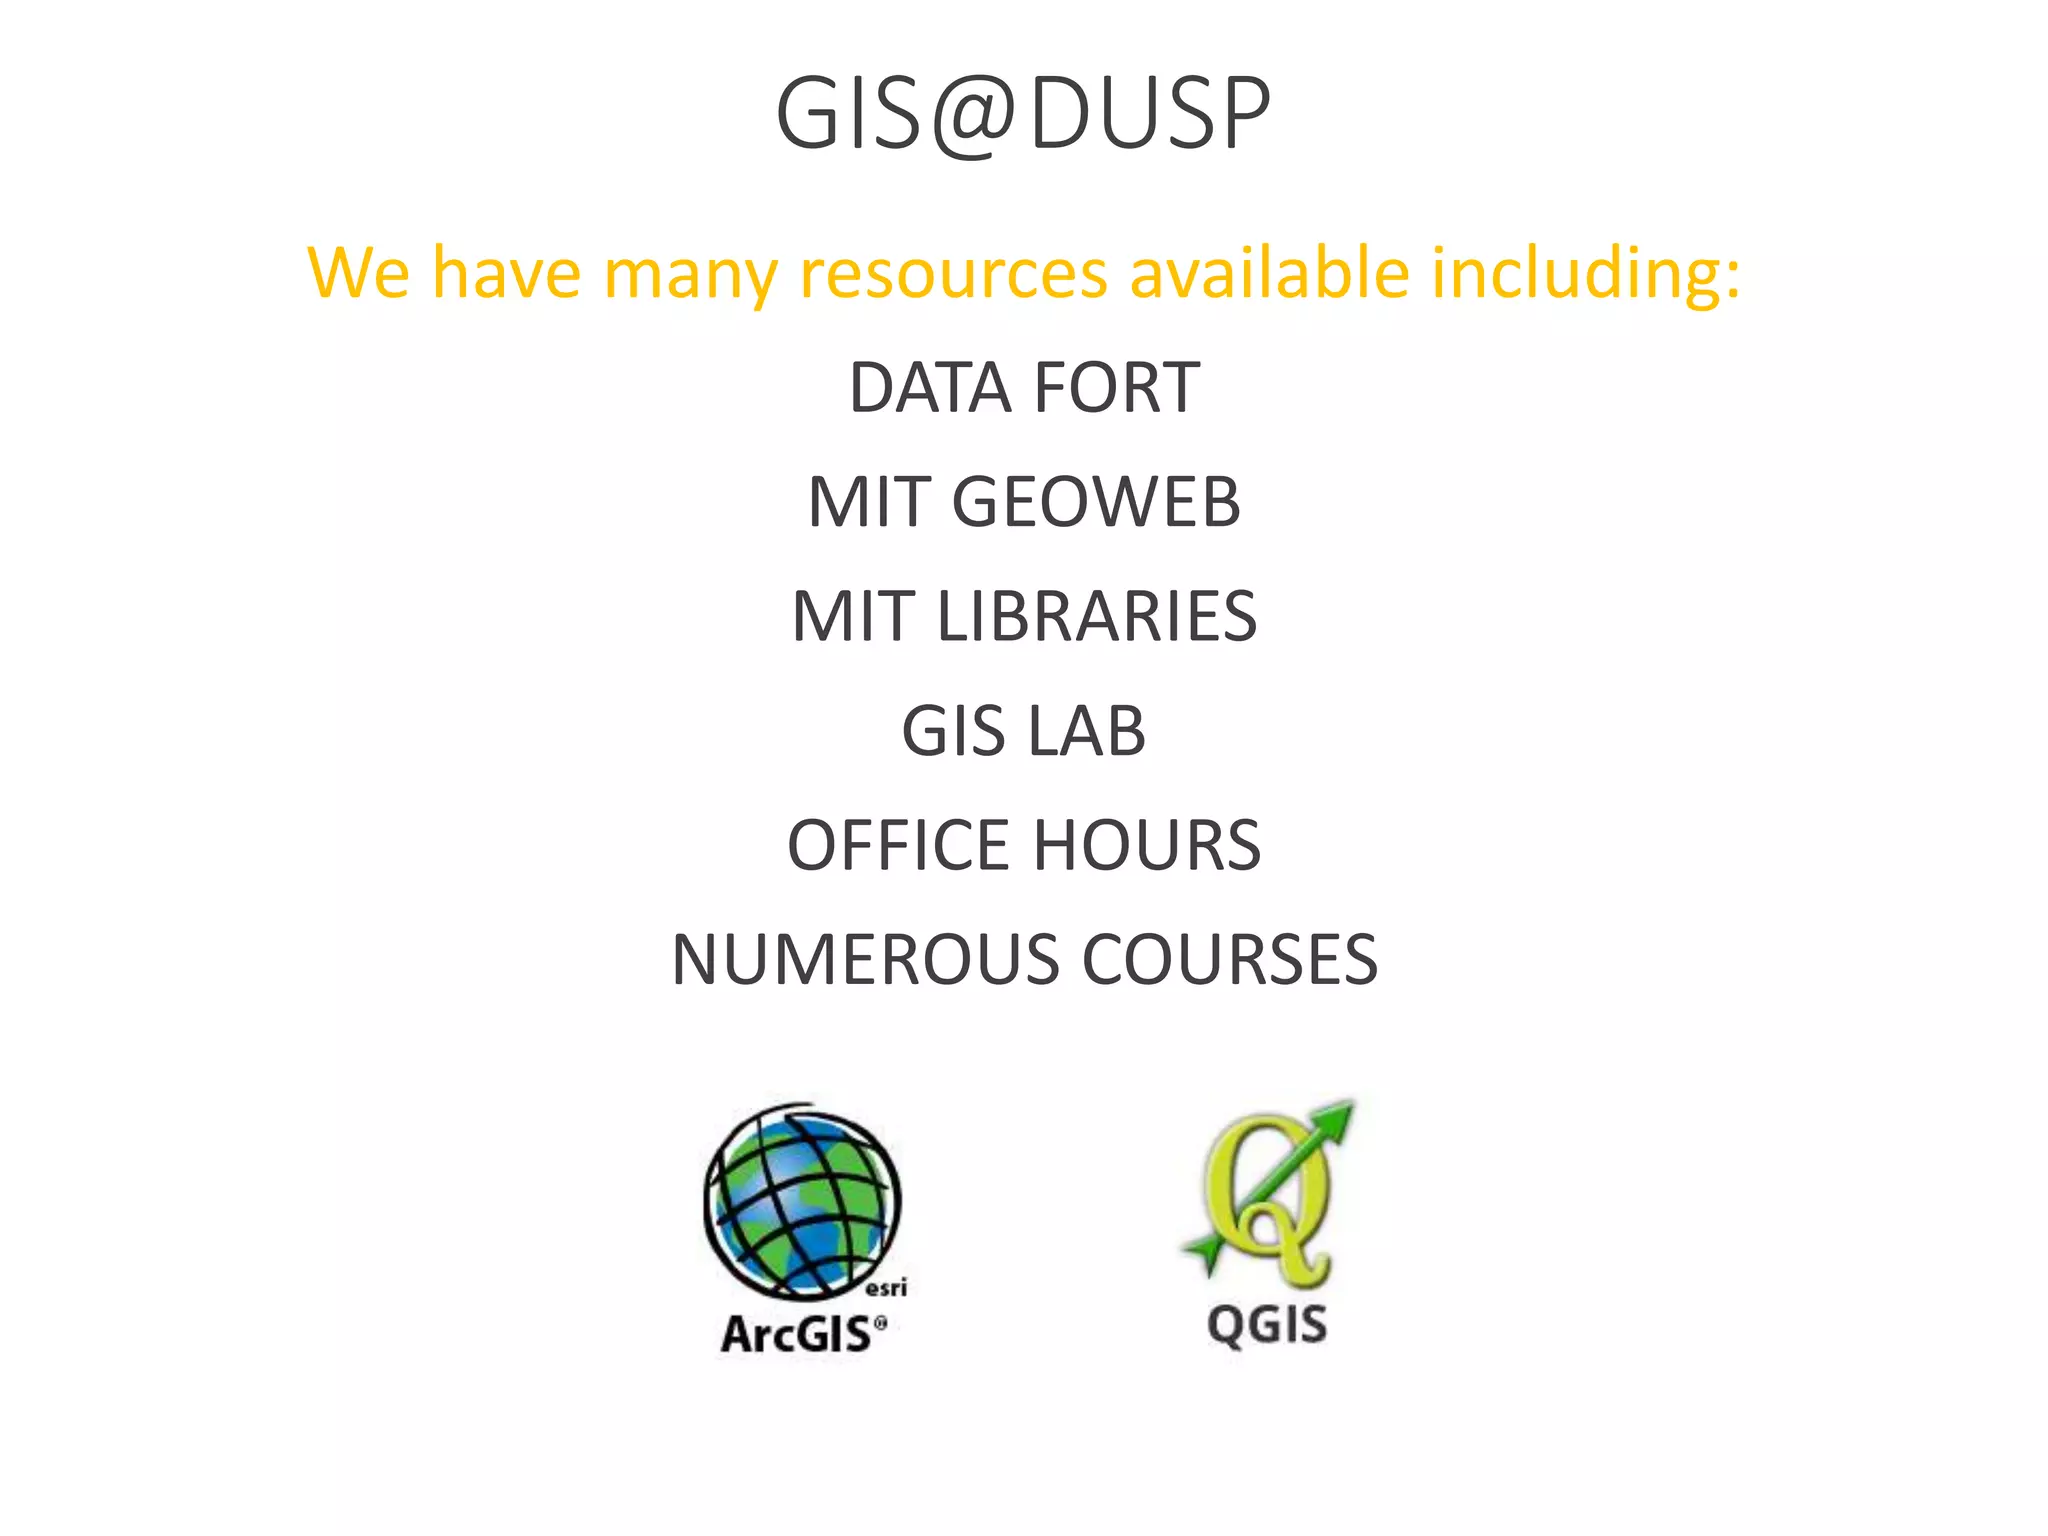
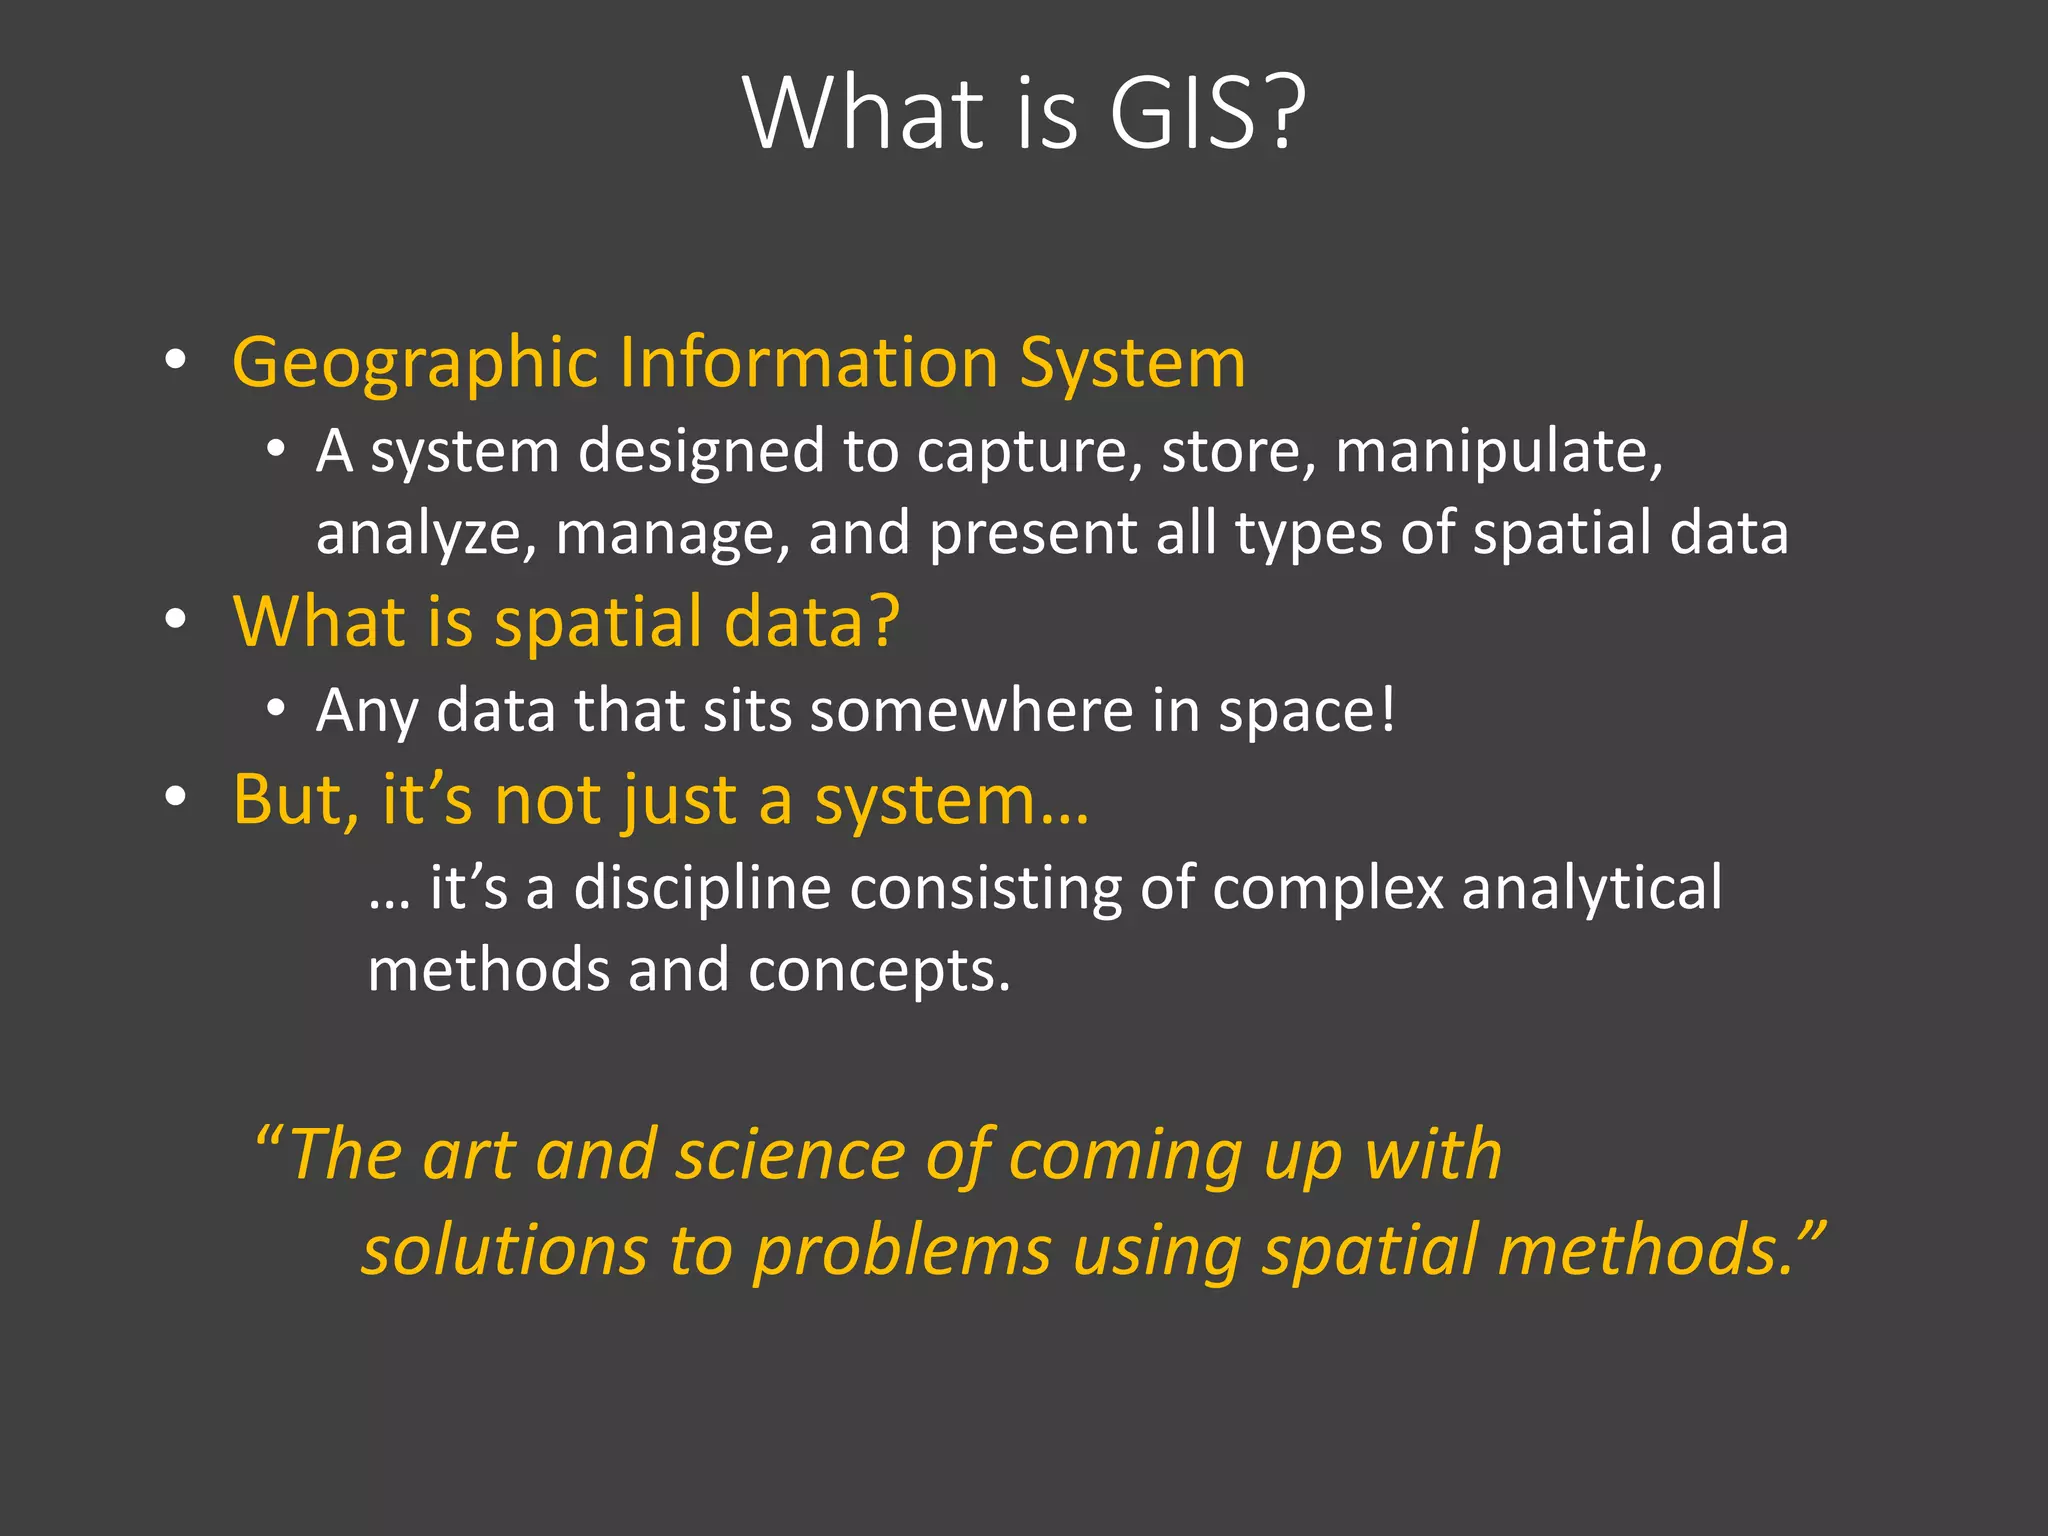
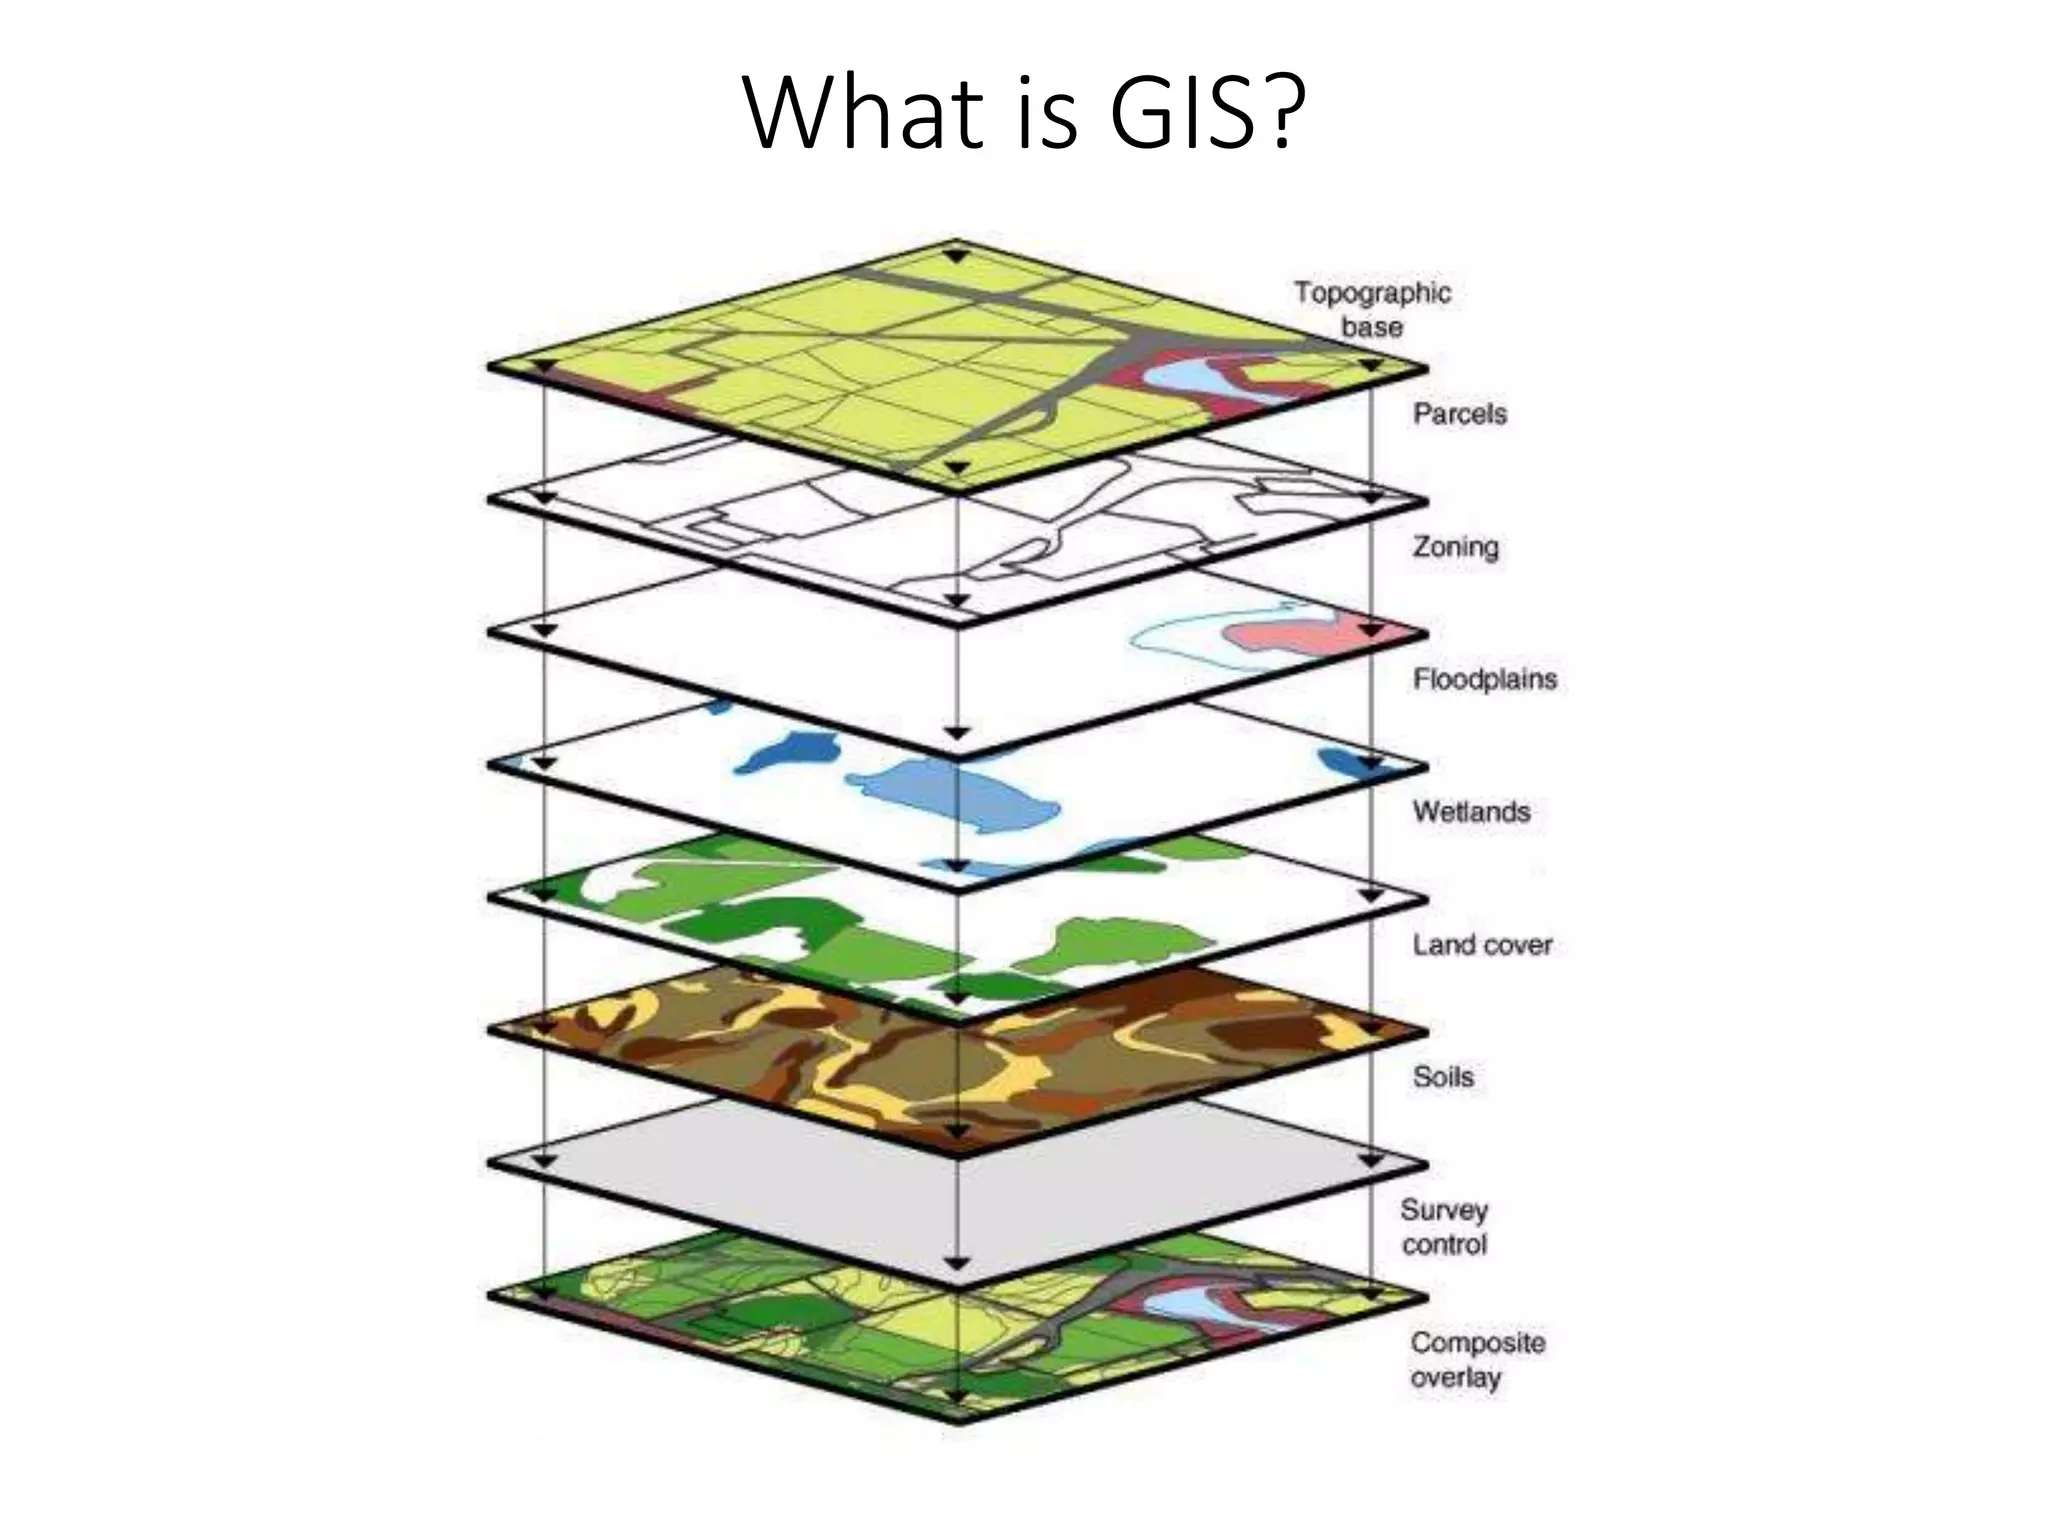


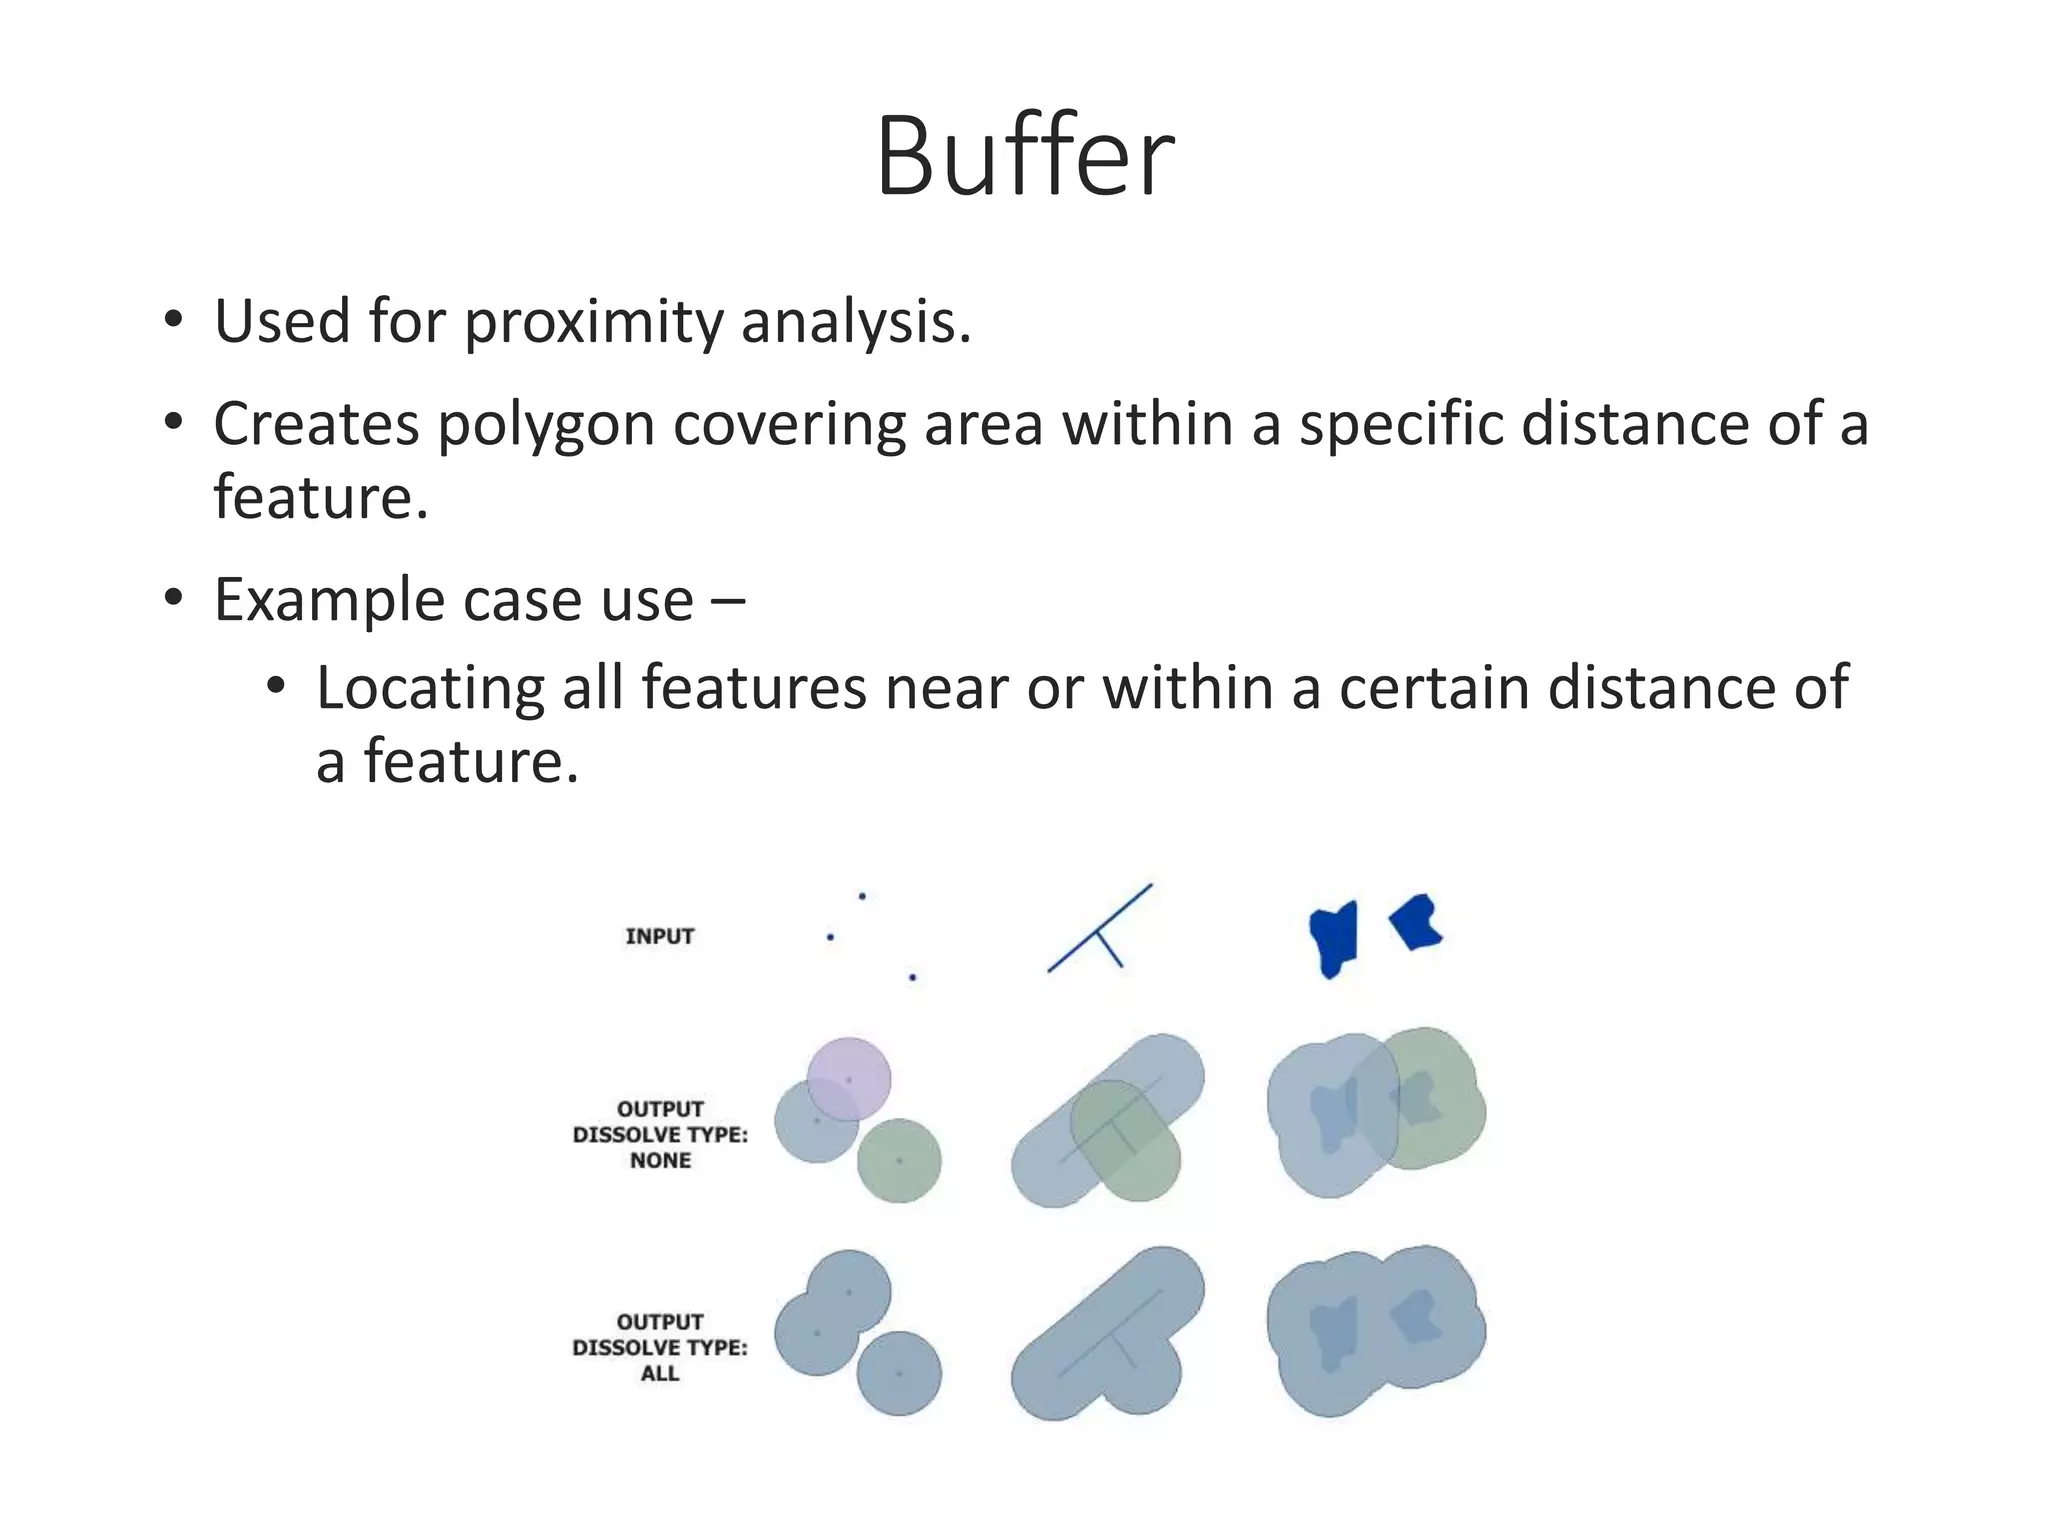
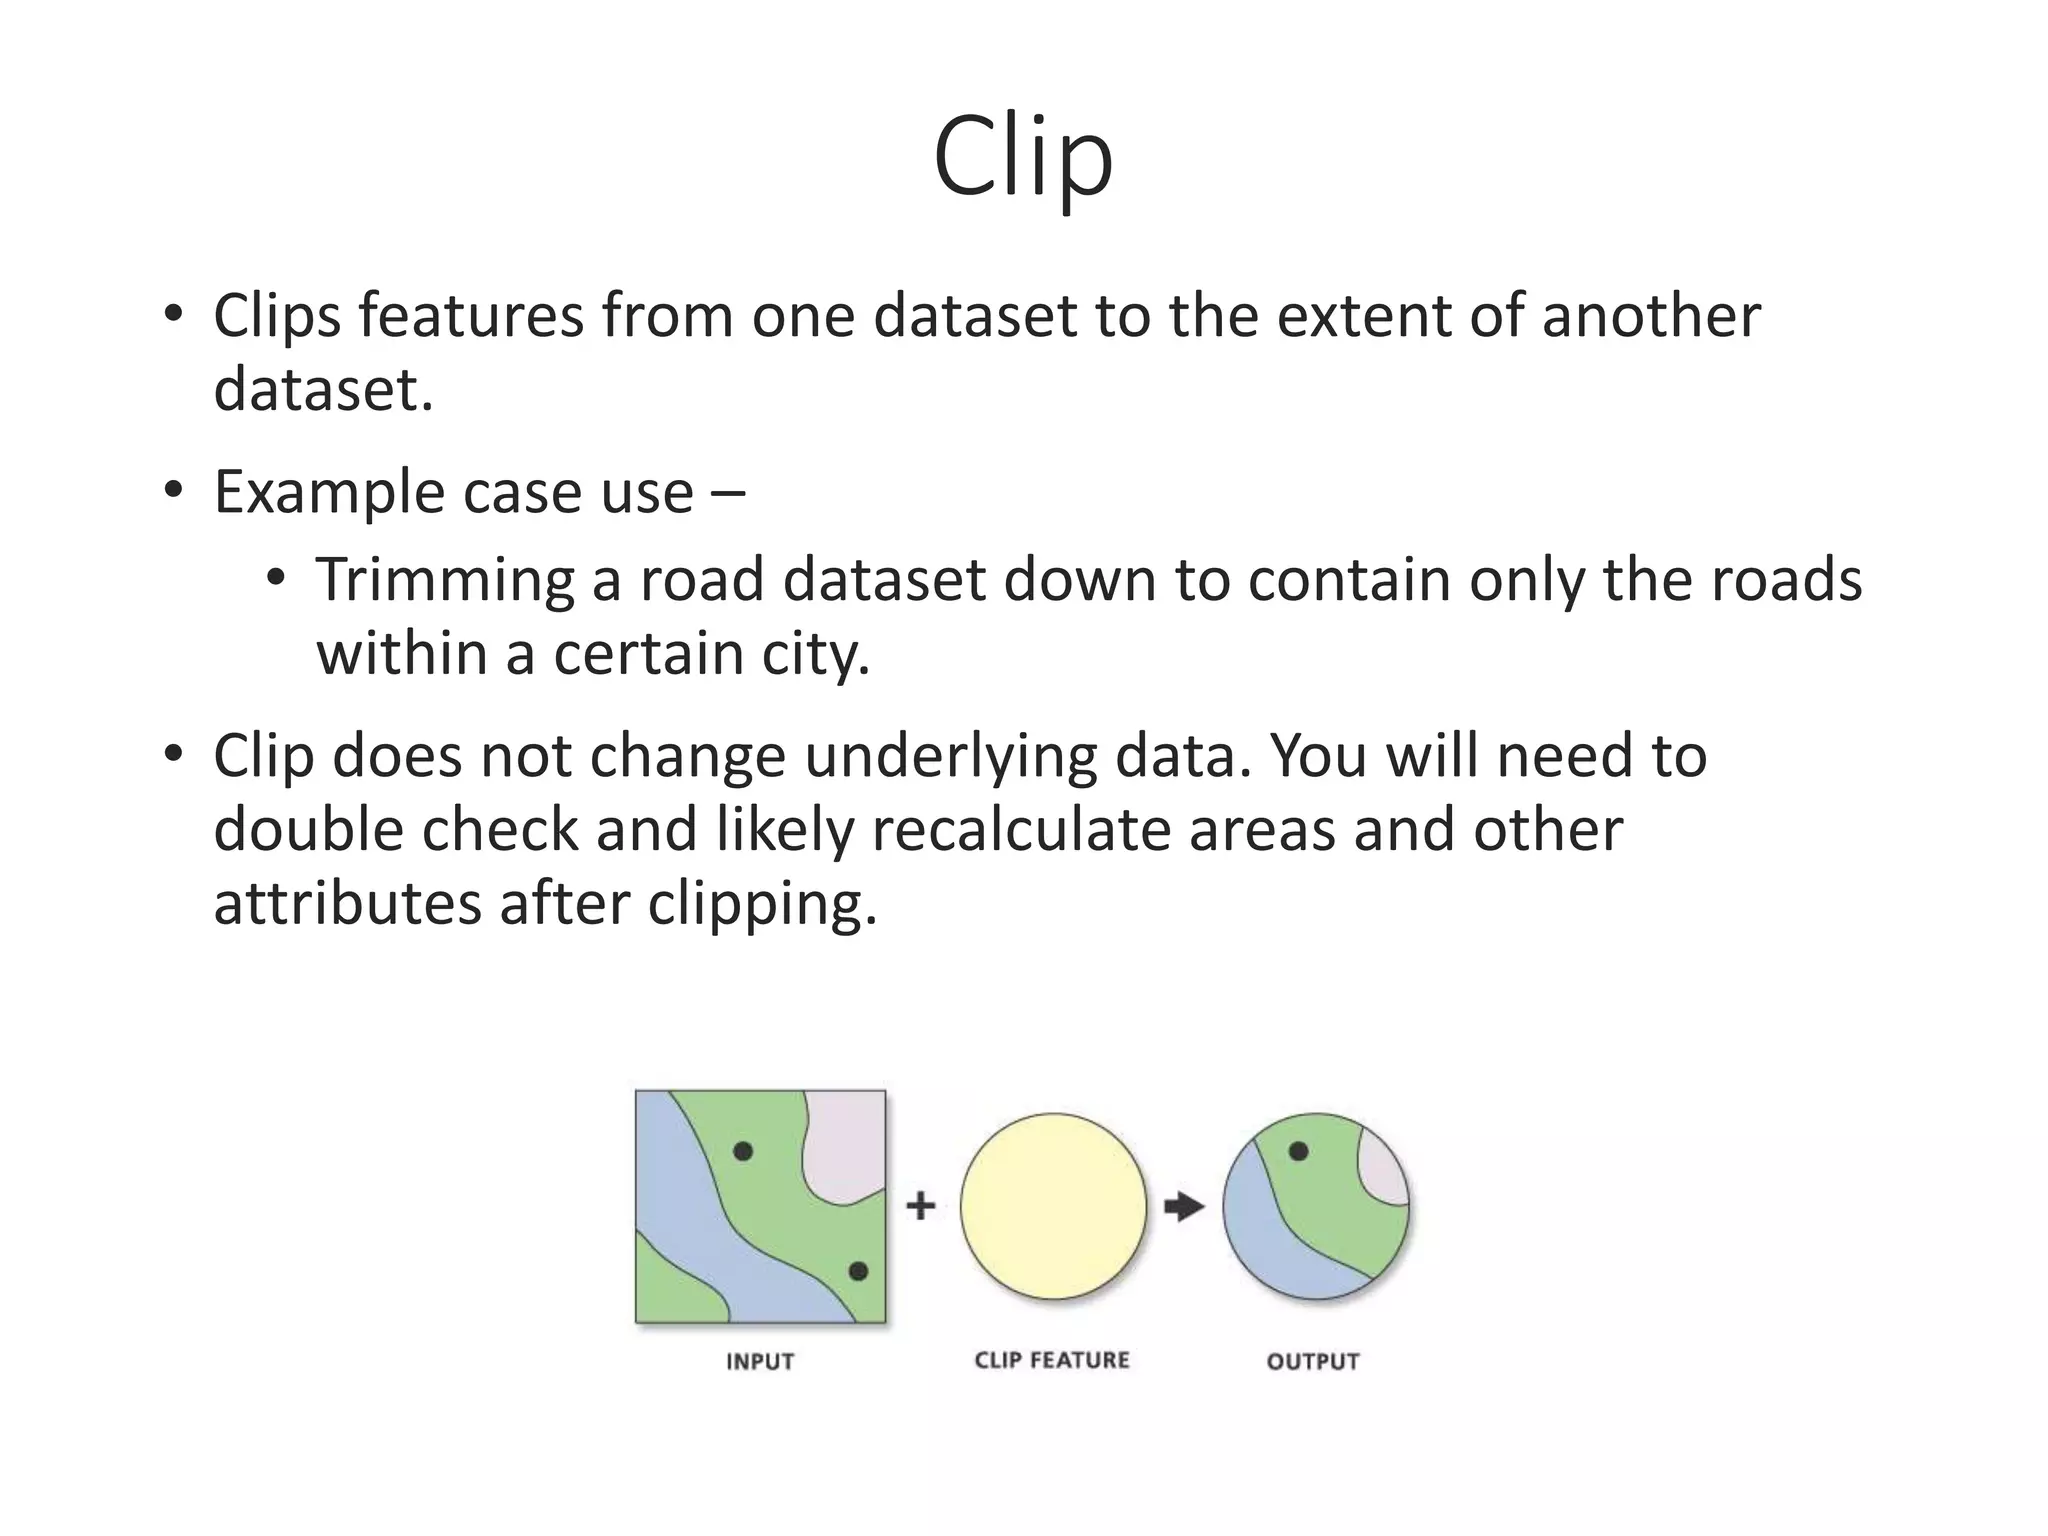
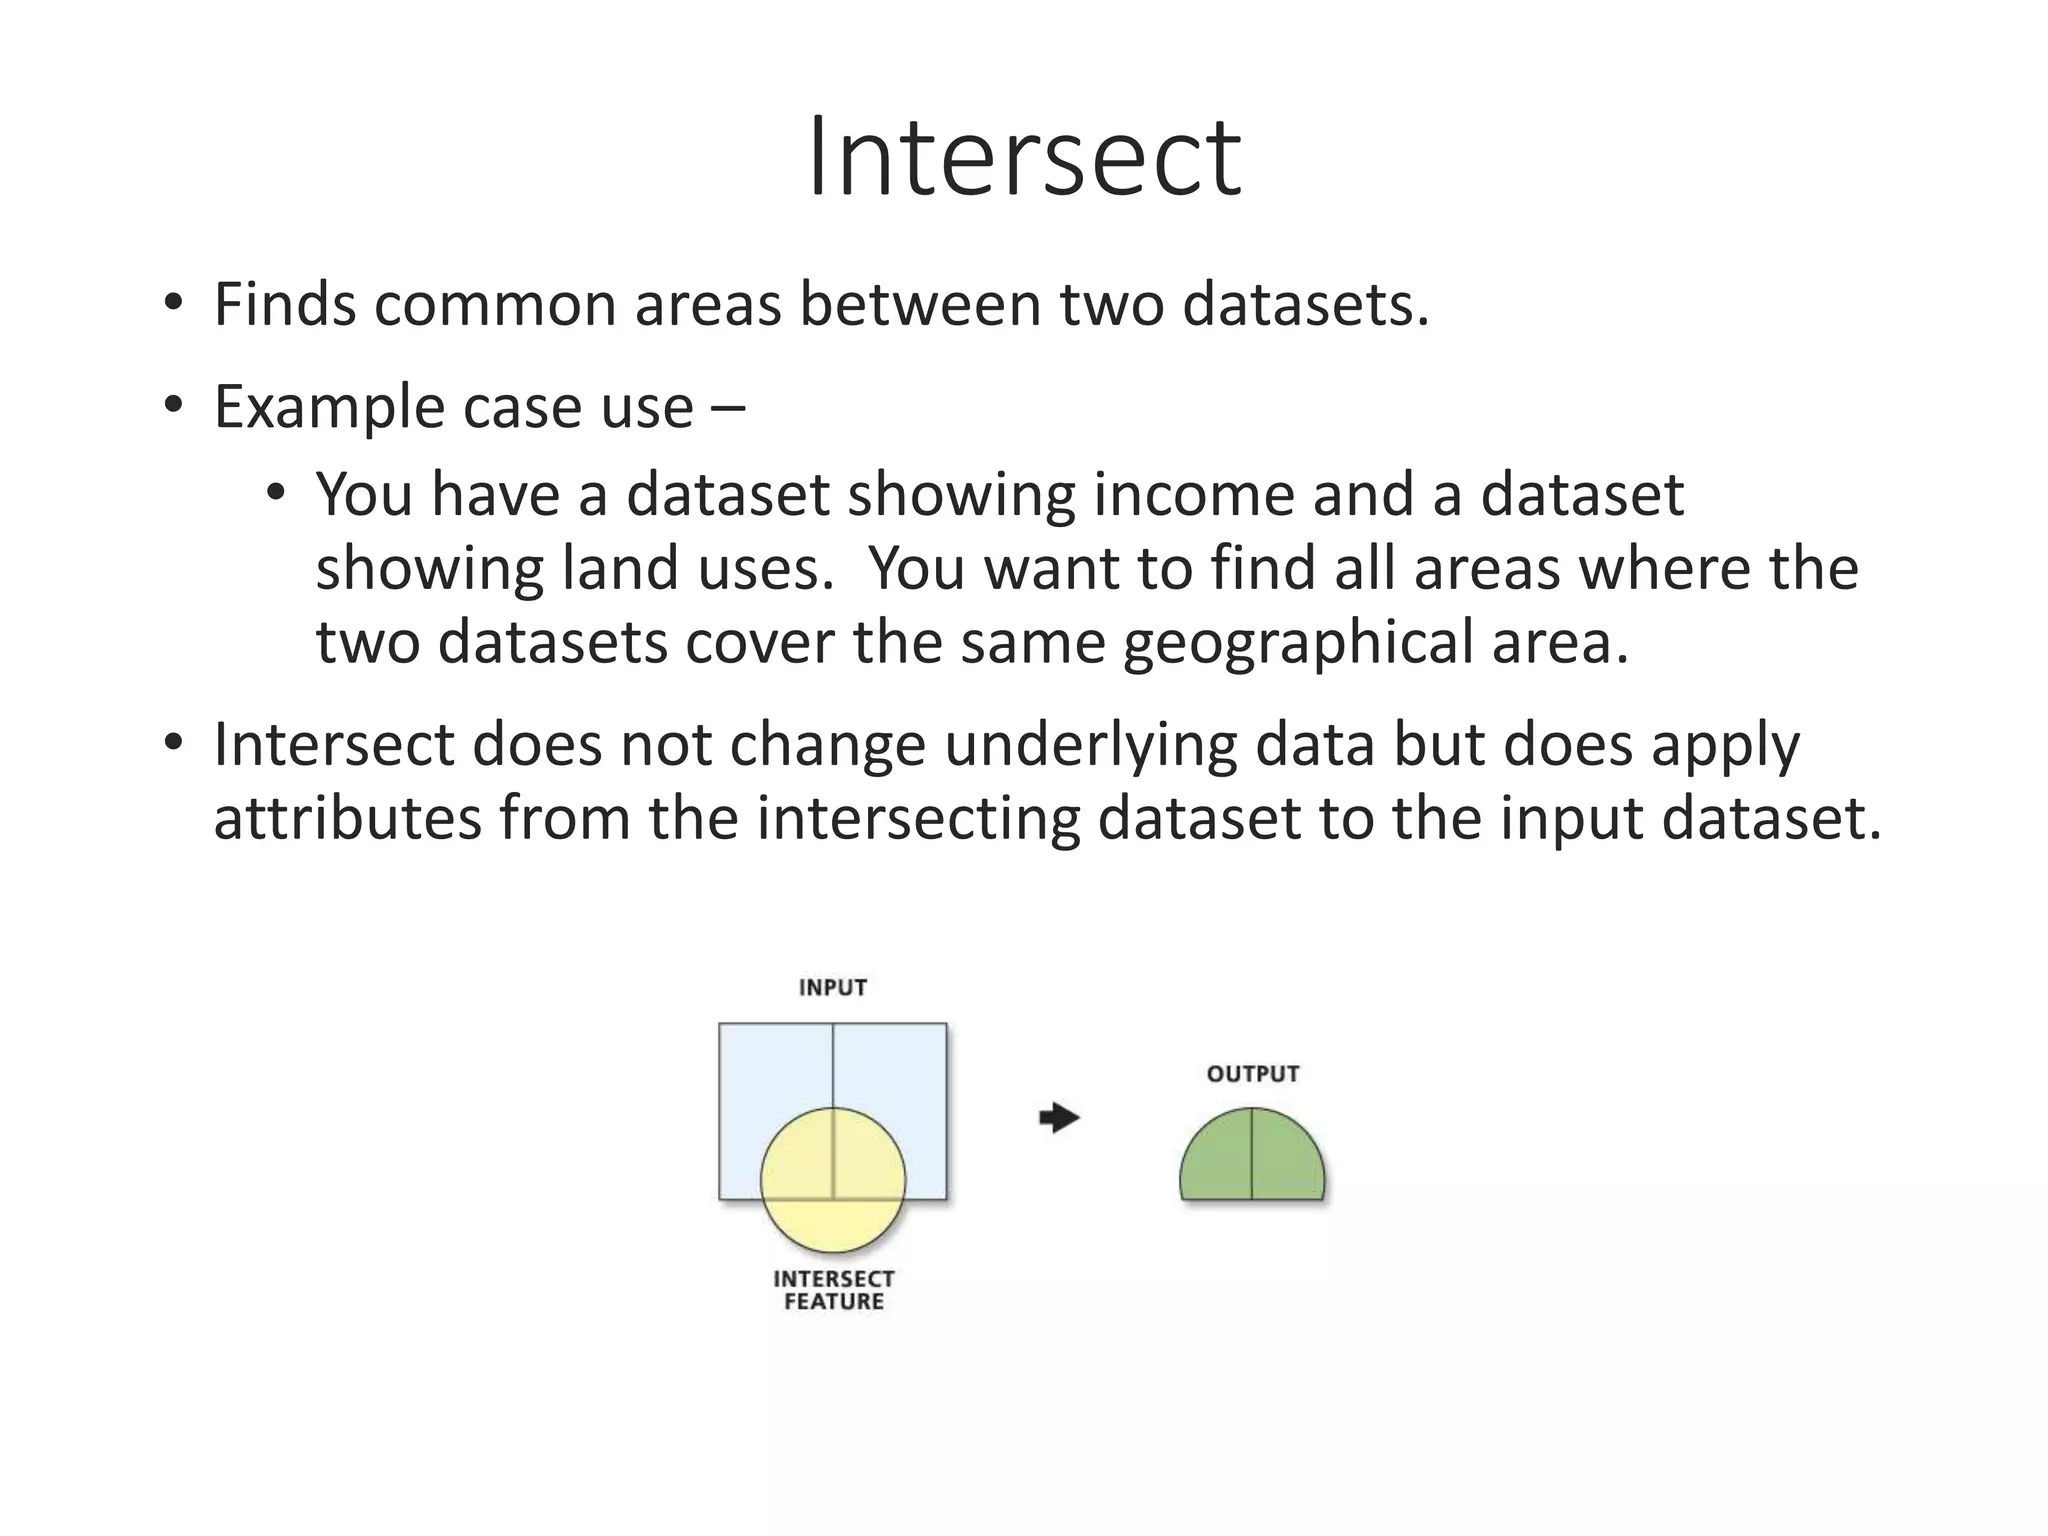
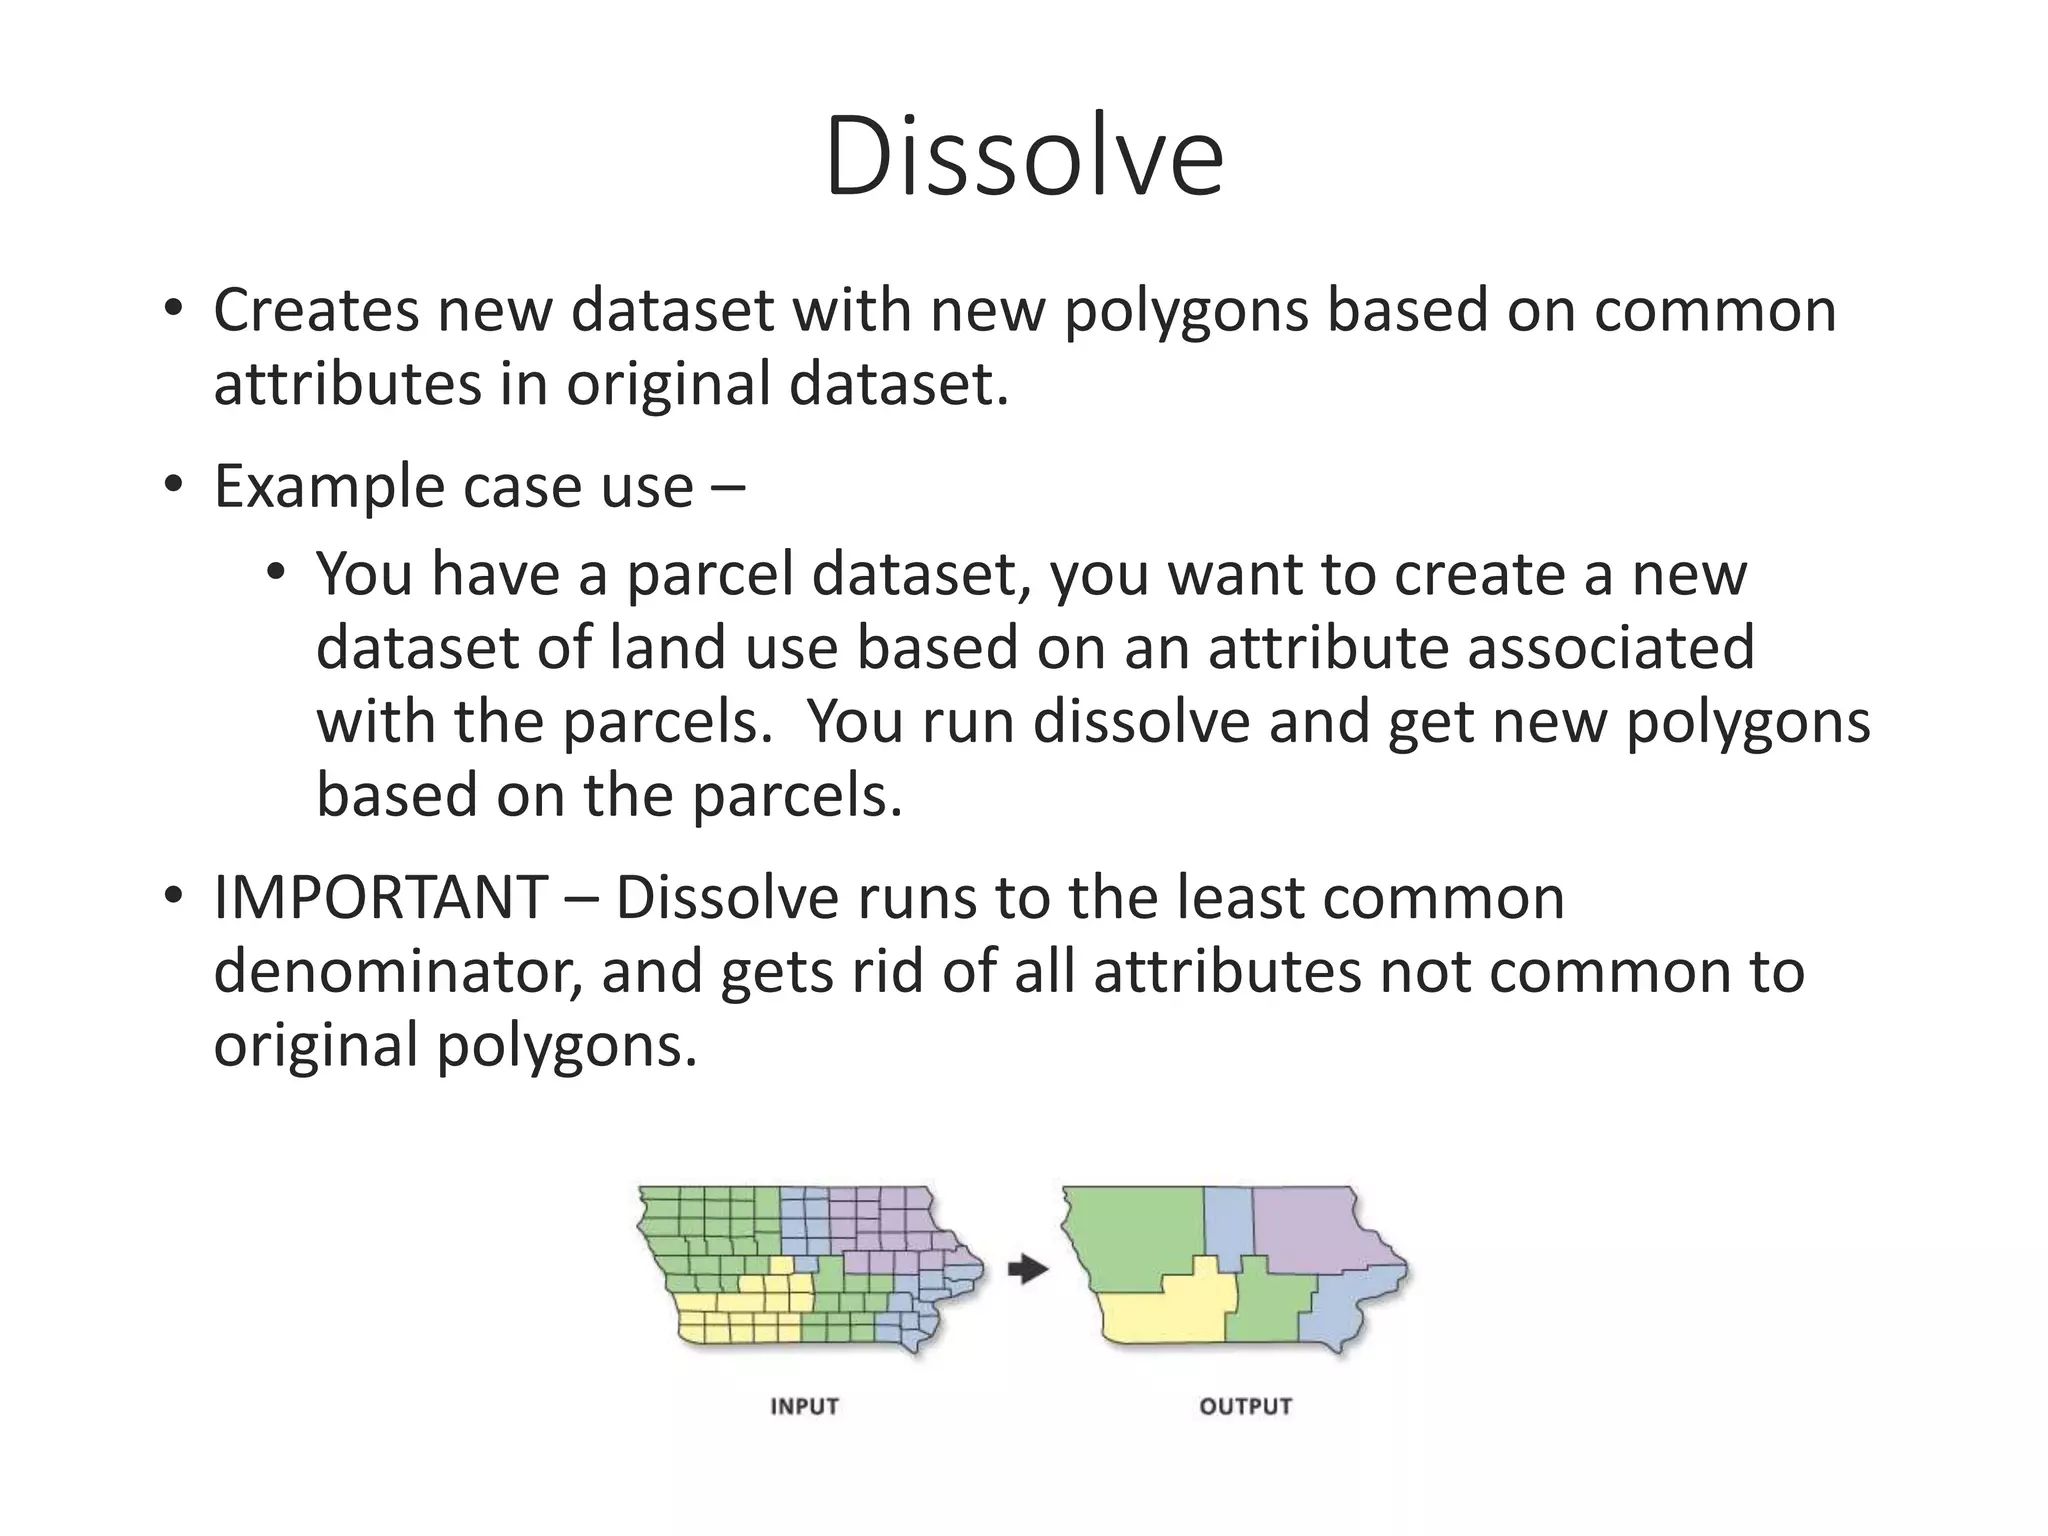

This document provides an overview of an introductory GIS review session at DUSP. It introduces the GIS resources and computing environment at DUSP. It then reviews key GIS concepts like the basic components of a GIS, how planners use GIS, making maps, working with relational databases, descriptive statistics, geoprocessing tools like buffering and clipping data, and methods of extracting data. The session aims to help students prepare for the GIS test out and provides information on where to get help with GIS at DUSP and upcoming workshops through the DUSPVIZ initiative.