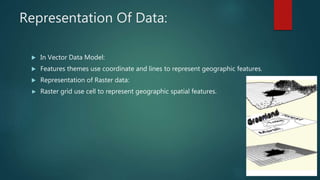
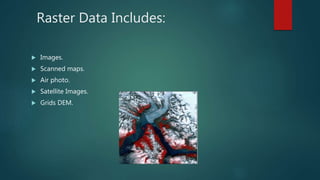
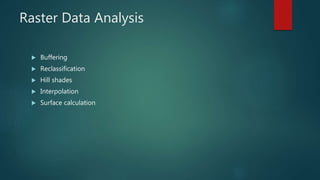
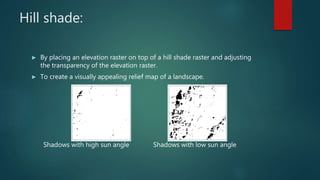
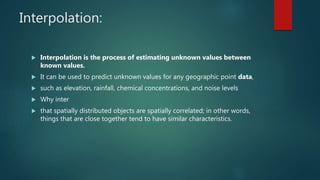
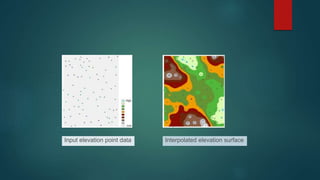
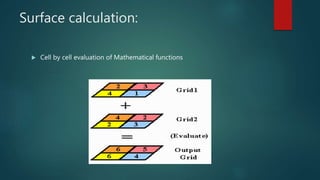
Raster Data Analysis
PRESENTED BY: ABDUL RAZIQ
AMEER MUAVIA
KHIZAR NAWAZ
Raster Data:
 Definition:
 A graphic representation of features and attributes.
 Made of grid which contain information.
 Cell size:
 Cells may be of any size.
 What does cell size tell us?
 coarser or finer the pattern or features are that appear in raster.
Raster Grid:
 It was usually square but may be of different shape.
 Each group of cells could either call as a layer of a cells.
 Various layers are overlying each other
 Entities represented by grid:
 Grid made of cell.
 Values applied to cells.
Representation Of Data:
 In Vector Data Model:
 Features themes use coordinate and lines to represent geographic features.
 Representation of Raster data:
► Raster grid use cell to represent geographic spatial features.
Raster Data Includes:
 Images.
 Scanned maps.
 Air photo.
 Satellite Images.
 Grids DEM.
Raster Data Analysis
 Buffering
 Reclassification
 Hill shades
 Interpolation
 Surface calculation
Buffering:
 Buffering is the result of classifying cells according to whether the cells lie
inside or outside the buffer
 Output cells are either assigned an in value or an out value.
 In value cells are whenever the cell-to-cell distance is less than the
specified buffer distance,
 While out value cells are further than the buffer distance .
 There are many occasions when buffering is required.
 One example of using a buffer is showing greenway areas around lakes.
 Another example of using a buffer is showing areas along highways where
the traffic noise is above a certain level .
Reclassification:
 It is a process of reassigning a values or list of values.
 Reason:
 set specific values to exclude no data from analysis.
► Change values in response to new information or classification schemes.
► To replace one set of values with an associated set
► Example:
► To replace values representing soil types with pH values.
 Assign values of preference, priority, sensitivity, or similar criteria to a
raster.
Hill shade:
► By placing an elevation raster on top of a hill shade raster and adjusting
the transparency of the elevation raster.
► To create a visually appealing relief map of a landscape.
Shadows with high sun angle Shadows with low sun angle
Interpolation:
 Interpolation is the process of estimating unknown values between
known values.
 It can be used to predict unknown values for any geographic point data,
 such as elevation, rainfall, chemical concentrations, and noise levels
 Why inter
 that spatially distributed objects are spatially correlated; in other words,
things that are close together tend to have similar characteristics.
Input elevation point data Interpolated elevation surface
Surface calculation:
 Cell by cell evaluation of Mathematical functions
Tools For Raster Analysis:
 Map algebra
 Hill shades
o Slopes
o Aspects
► Raster modeling
► Raster and vector integration
o Raster to polygon conversion
o Contour generation
o Surface interpolation from point data
Raster Data Analysis Operations:
 Local (cell-by-cell) operations
 Neighborhood operations
 Zonal operations
 Raster distance measure operations - similar to buffering
Local Operations
 Cell-by-cell based,
 Creates a new raster from either a single or multiple input raster.
 Includes Reclassification and Map Algebra.
Neighborhood operations:
 Neighborhood operations are a method of analyzing data in a GIS environment.
 They are especially important when a situation requires the analysis of relationships
 between locations, rather than interpret the characteristics at individual locations.
Zonal Operations:
 Uses groups of cells that have the same value or like features
 Can be contiguous or non contiguous
 For single raster zonal
 Operations measure the geometry of each zone (area, perimeter,
thickness, centroid)
 For two raster (an input raster and a zonal raster) a summary of values
for the input values in
 each zone of the zonal raster is generated in an output raster (summary
statistics and measures)
How does it work?
 An imaginary grid is placed over an area,
 Each cell in the grid is given a numeric code.
 Number was given to descried the dominant attributes in the data
 Each cell may be
 Qualitative
 Numeric
 A feature identifier

Raster data analysis

  • 1.
    Raster Data Analysis PRESENTEDBY: ABDUL RAZIQ AMEER MUAVIA KHIZAR NAWAZ
  • 2.
    Raster Data:  Definition: A graphic representation of features and attributes.  Made of grid which contain information.  Cell size:  Cells may be of any size.  What does cell size tell us?  coarser or finer the pattern or features are that appear in raster.
  • 3.
    Raster Grid:  Itwas usually square but may be of different shape.  Each group of cells could either call as a layer of a cells.  Various layers are overlying each other  Entities represented by grid:  Grid made of cell.  Values applied to cells.
  • 4.
    Representation Of Data: In Vector Data Model:  Features themes use coordinate and lines to represent geographic features.  Representation of Raster data: ► Raster grid use cell to represent geographic spatial features.
  • 5.
    Raster Data Includes: Images.  Scanned maps.  Air photo.  Satellite Images.  Grids DEM.
  • 6.
    Raster Data Analysis Buffering  Reclassification  Hill shades  Interpolation  Surface calculation
  • 7.
    Buffering:  Buffering isthe result of classifying cells according to whether the cells lie inside or outside the buffer  Output cells are either assigned an in value or an out value.  In value cells are whenever the cell-to-cell distance is less than the specified buffer distance,  While out value cells are further than the buffer distance .  There are many occasions when buffering is required.  One example of using a buffer is showing greenway areas around lakes.  Another example of using a buffer is showing areas along highways where the traffic noise is above a certain level .
  • 8.
    Reclassification:  It isa process of reassigning a values or list of values.  Reason:  set specific values to exclude no data from analysis. ► Change values in response to new information or classification schemes. ► To replace one set of values with an associated set ► Example: ► To replace values representing soil types with pH values.  Assign values of preference, priority, sensitivity, or similar criteria to a raster.
  • 9.
    Hill shade: ► Byplacing an elevation raster on top of a hill shade raster and adjusting the transparency of the elevation raster. ► To create a visually appealing relief map of a landscape. Shadows with high sun angle Shadows with low sun angle
  • 10.
    Interpolation:  Interpolation isthe process of estimating unknown values between known values.  It can be used to predict unknown values for any geographic point data,  such as elevation, rainfall, chemical concentrations, and noise levels  Why inter  that spatially distributed objects are spatially correlated; in other words, things that are close together tend to have similar characteristics.
  • 11.
    Input elevation pointdata Interpolated elevation surface
  • 12.
    Surface calculation:  Cellby cell evaluation of Mathematical functions
  • 13.
    Tools For RasterAnalysis:  Map algebra  Hill shades o Slopes o Aspects ► Raster modeling ► Raster and vector integration o Raster to polygon conversion o Contour generation o Surface interpolation from point data
  • 14.
    Raster Data AnalysisOperations:  Local (cell-by-cell) operations  Neighborhood operations  Zonal operations  Raster distance measure operations - similar to buffering
  • 15.
    Local Operations  Cell-by-cellbased,  Creates a new raster from either a single or multiple input raster.  Includes Reclassification and Map Algebra.
  • 16.
    Neighborhood operations:  Neighborhoodoperations are a method of analyzing data in a GIS environment.  They are especially important when a situation requires the analysis of relationships  between locations, rather than interpret the characteristics at individual locations.
  • 17.
    Zonal Operations:  Usesgroups of cells that have the same value or like features  Can be contiguous or non contiguous  For single raster zonal  Operations measure the geometry of each zone (area, perimeter, thickness, centroid)  For two raster (an input raster and a zonal raster) a summary of values for the input values in  each zone of the zonal raster is generated in an output raster (summary statistics and measures)
  • 19.
    How does itwork?  An imaginary grid is placed over an area,  Each cell in the grid is given a numeric code.  Number was given to descried the dominant attributes in the data  Each cell may be  Qualitative  Numeric  A feature identifier