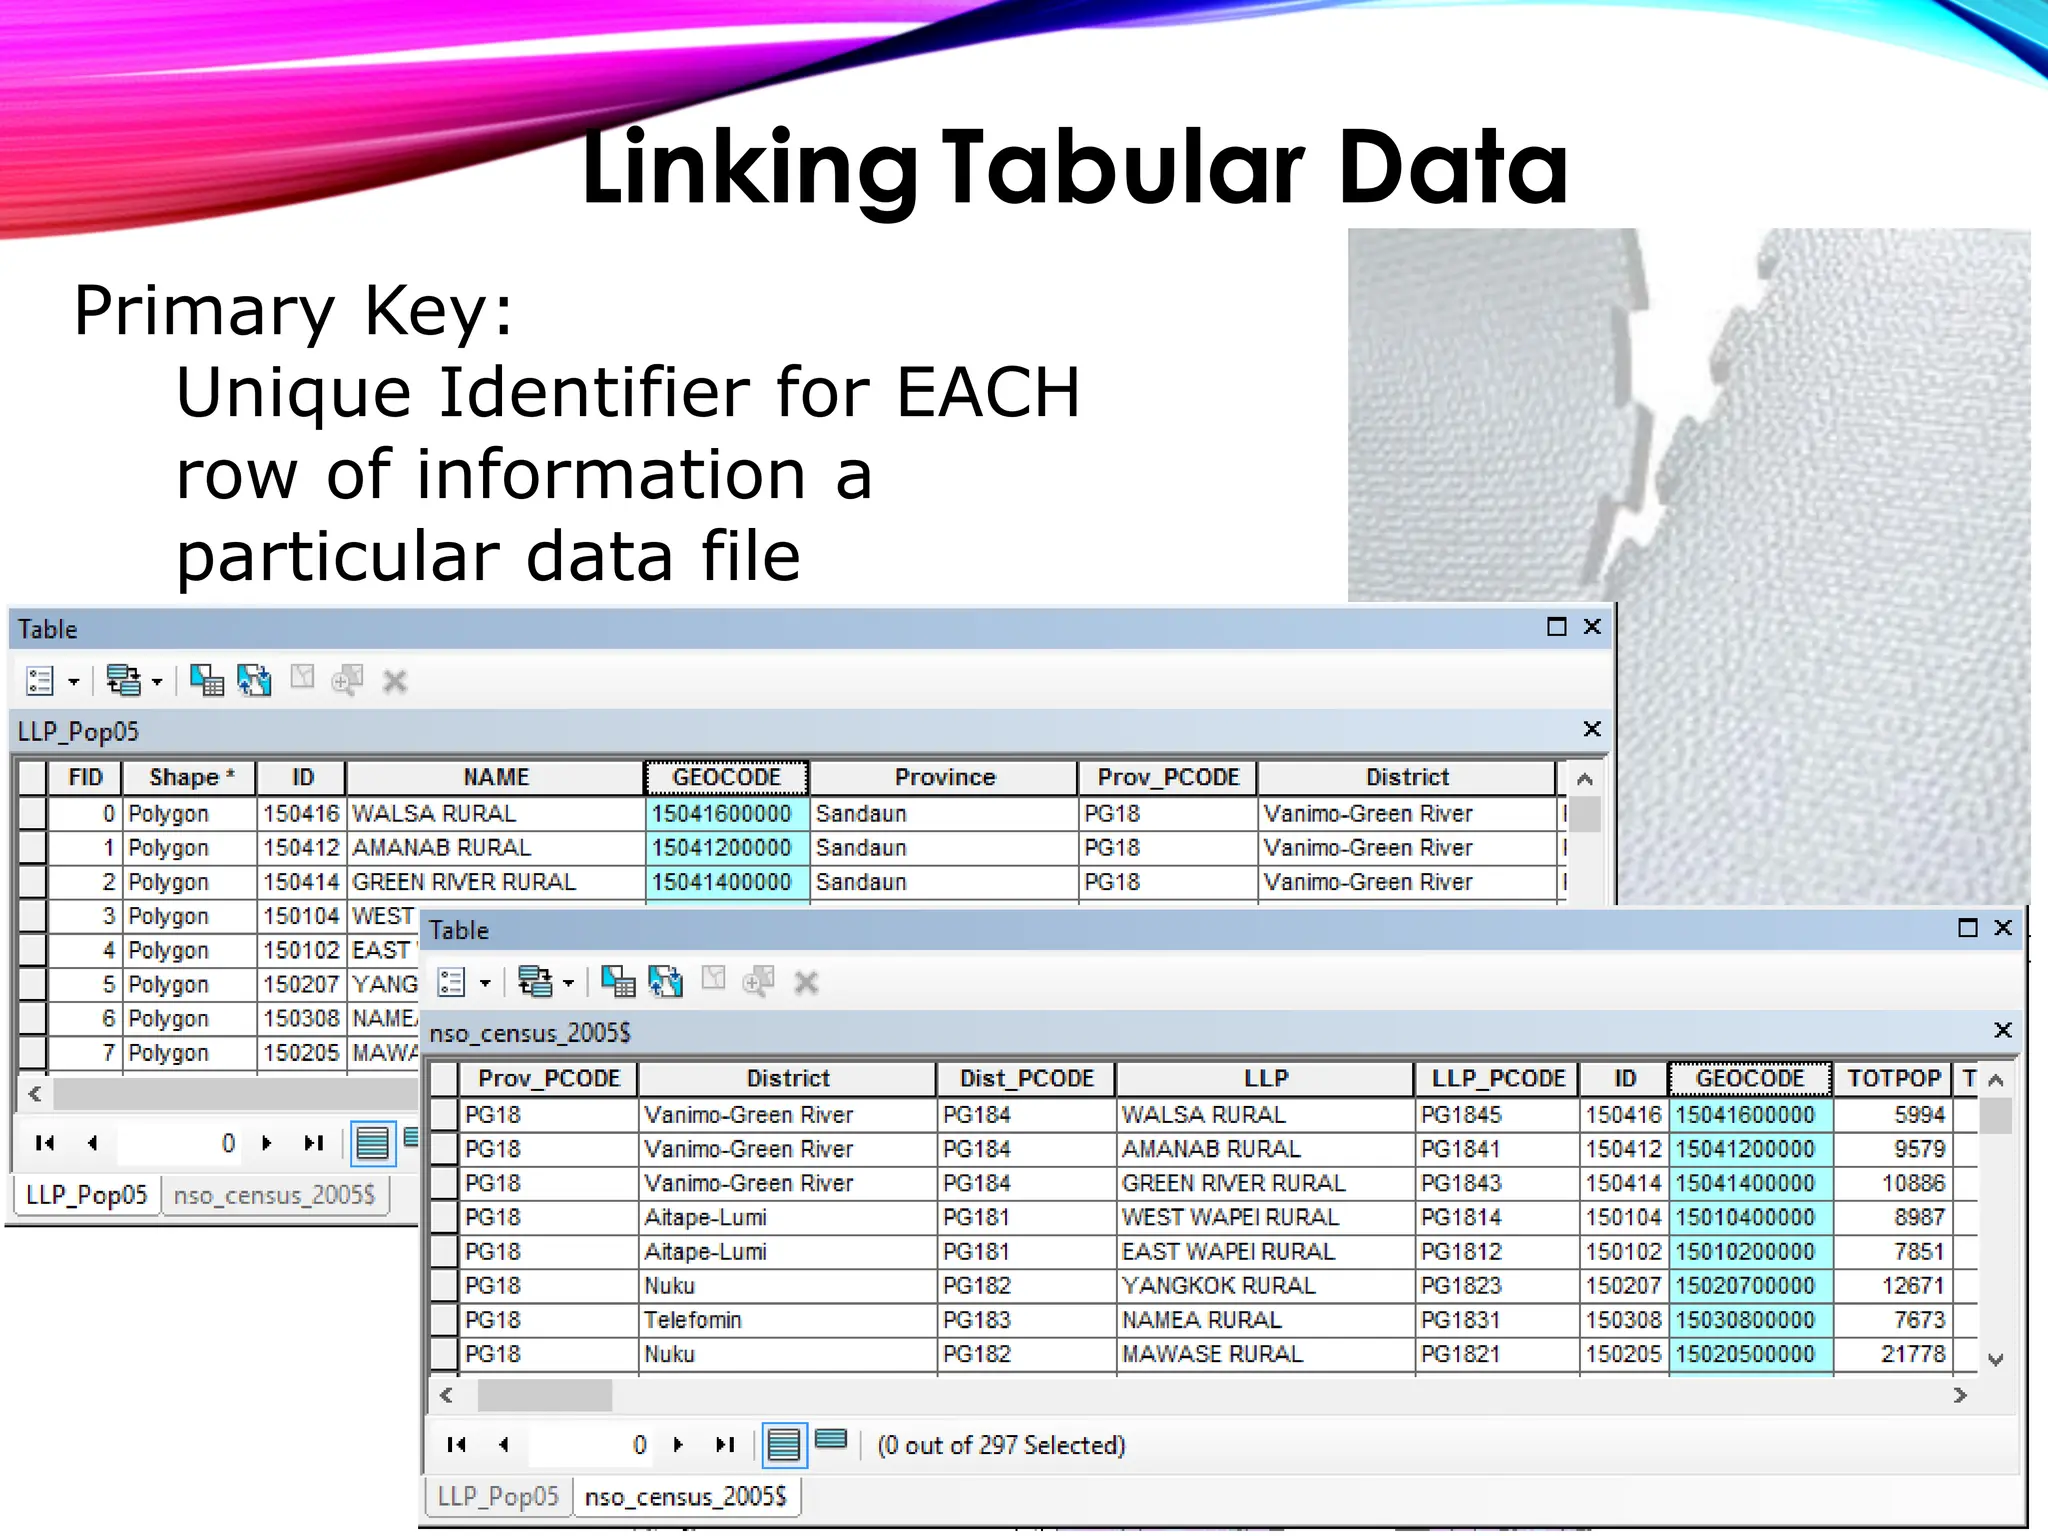
GIS stands for Geographic Information System
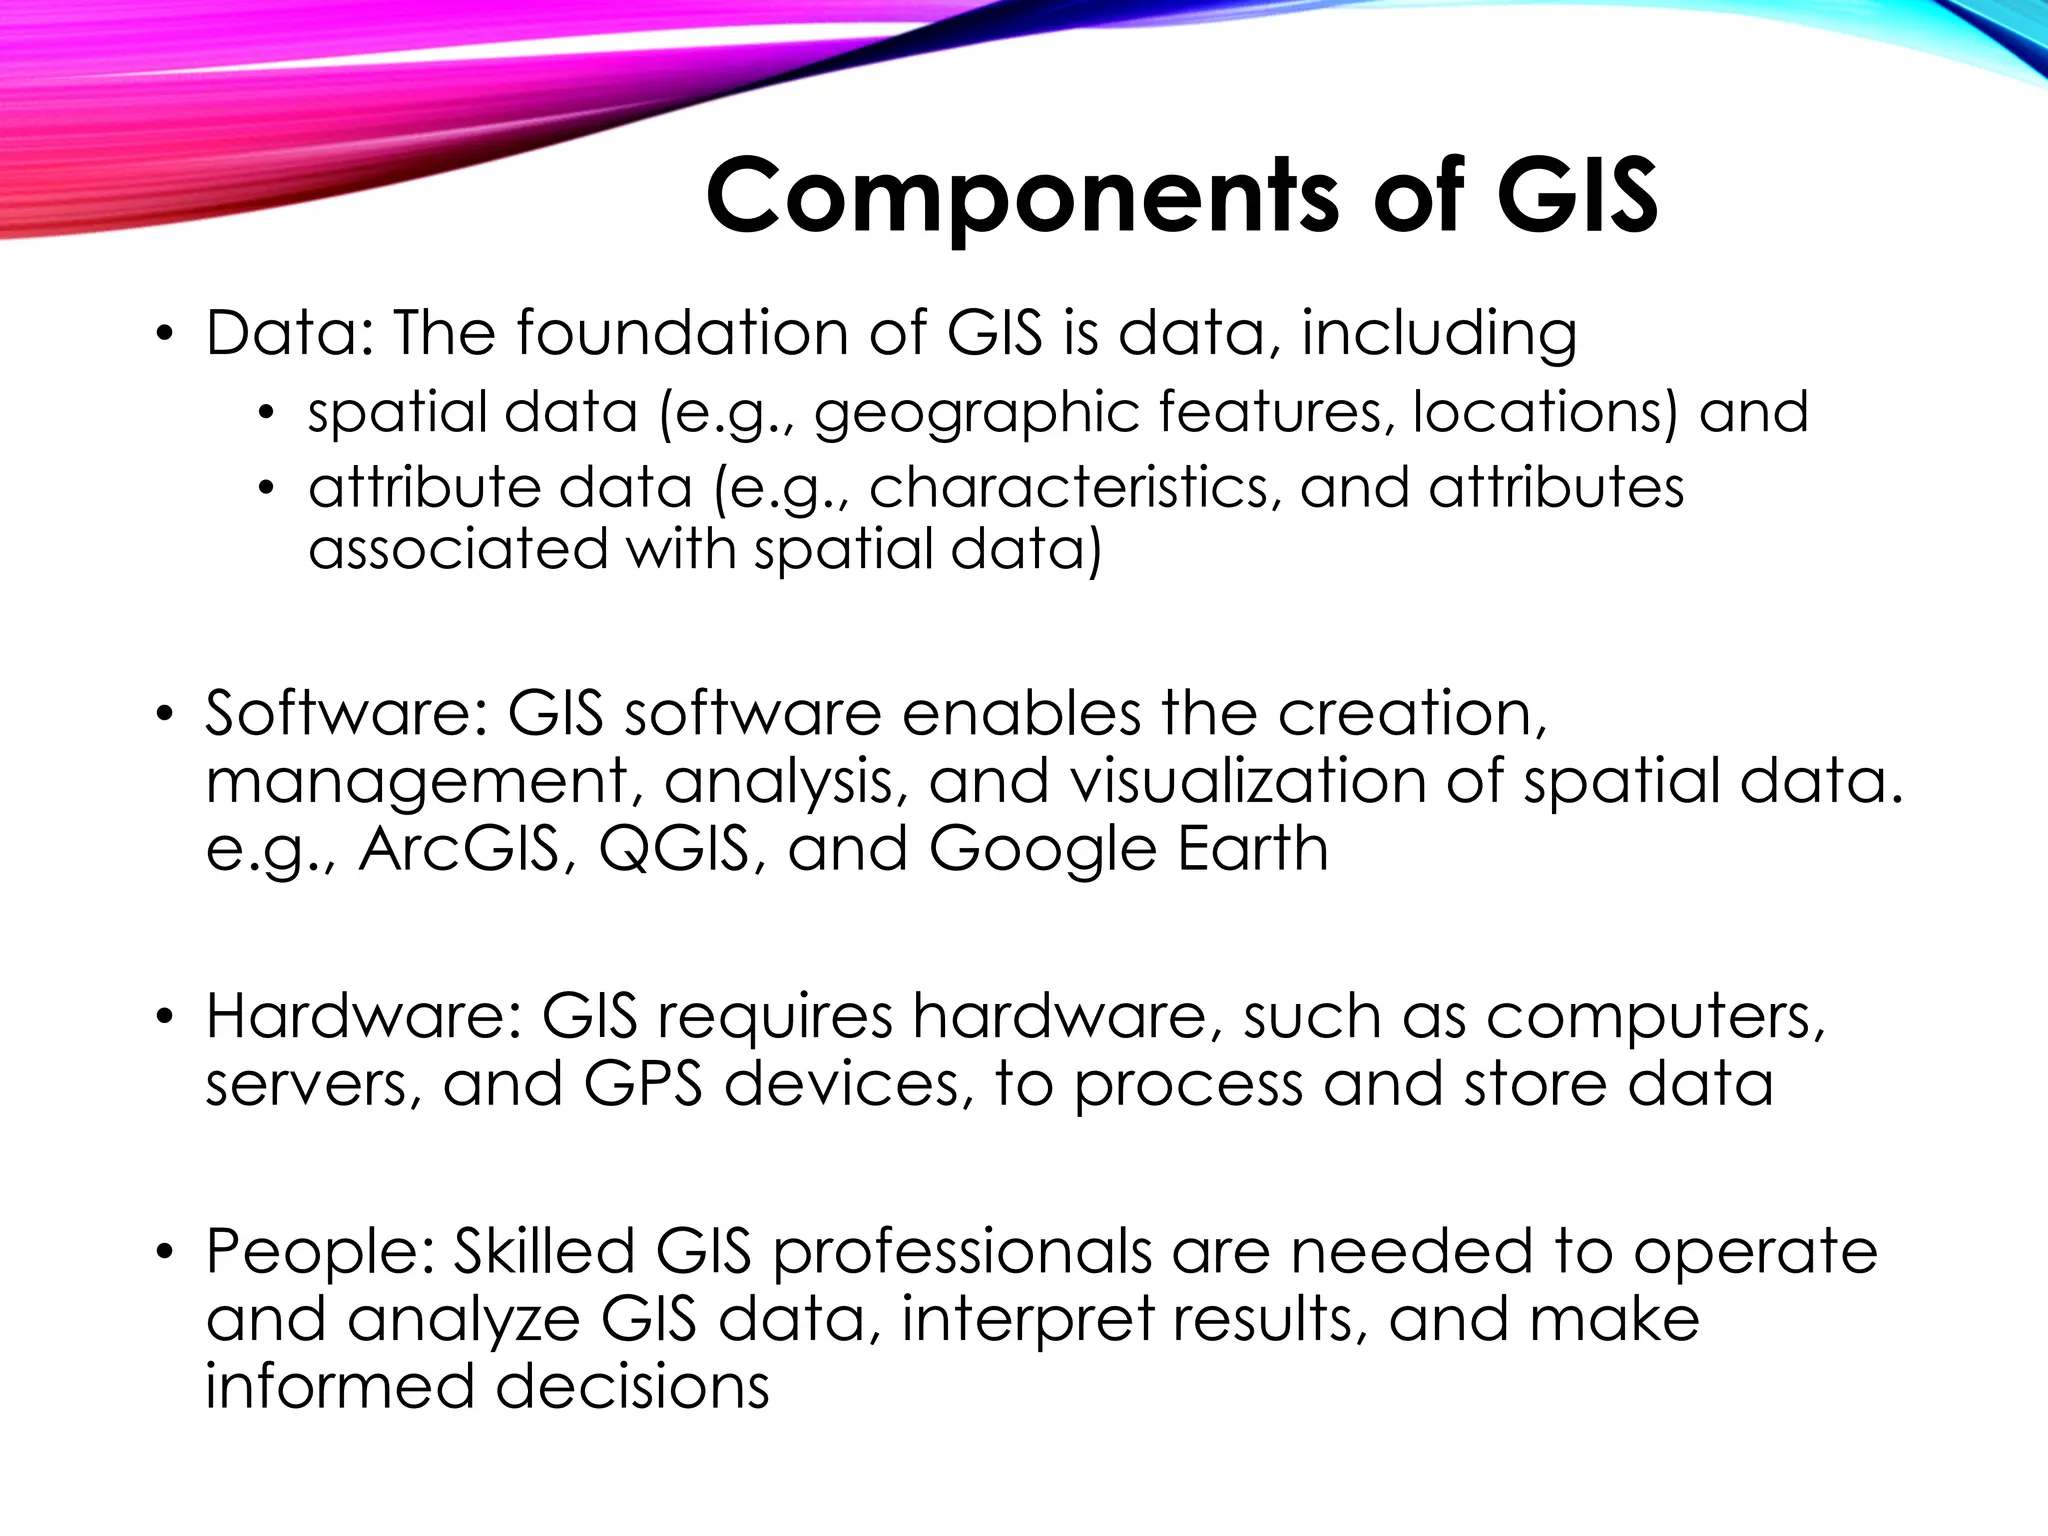
• GIS is a computer-based system that captures, stores,
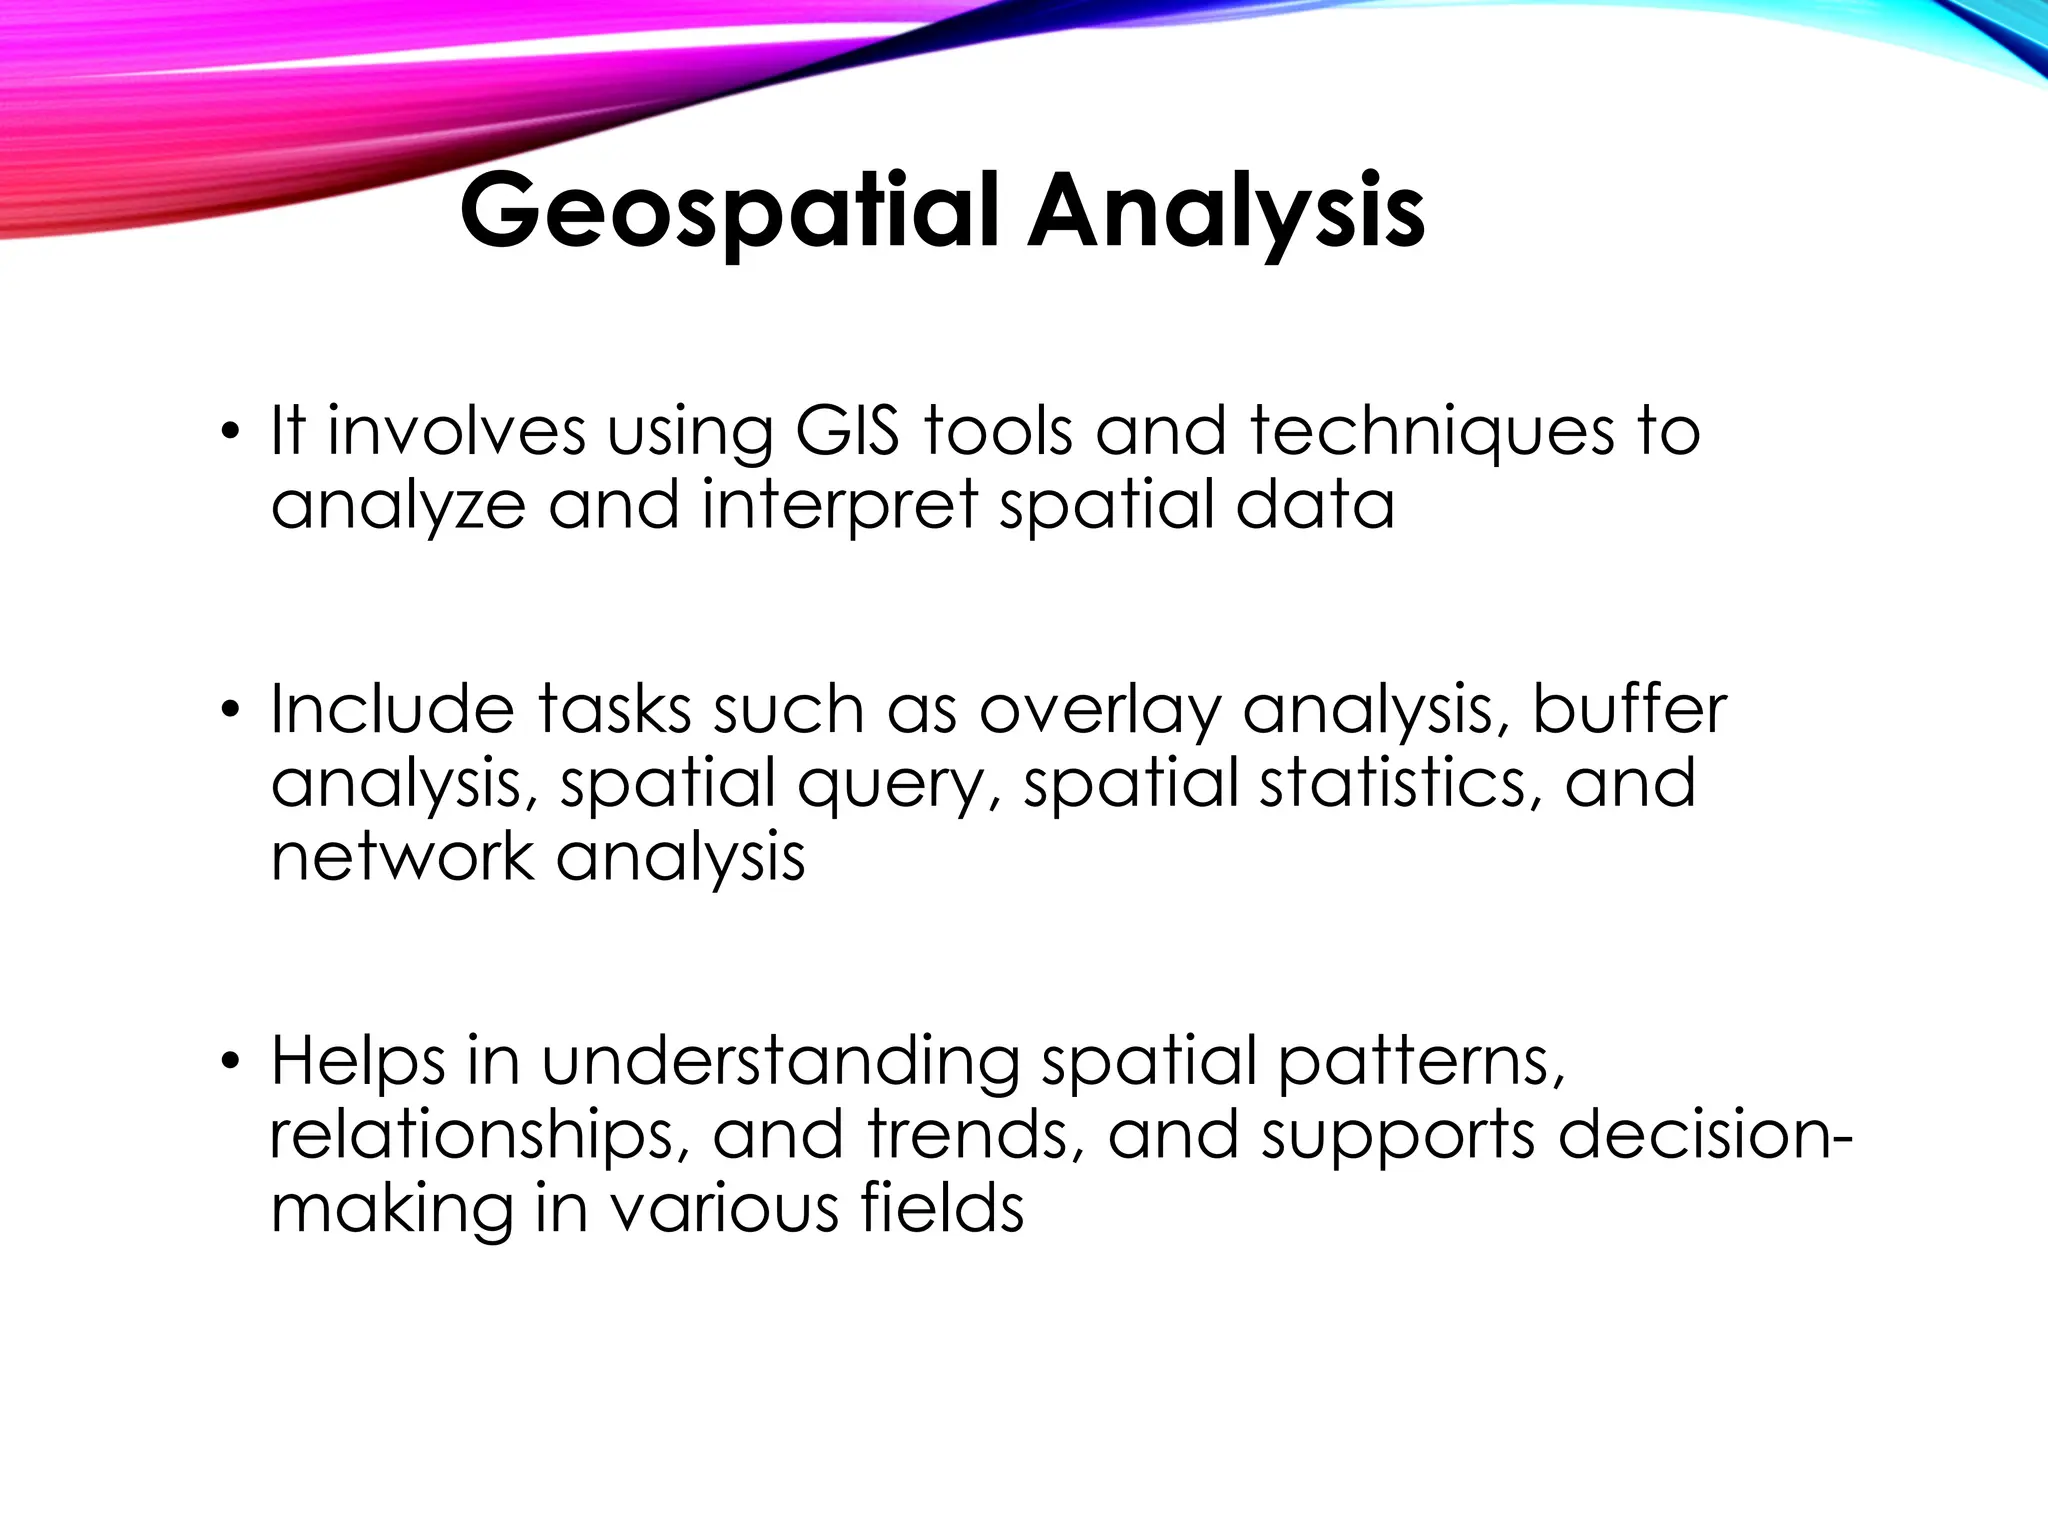
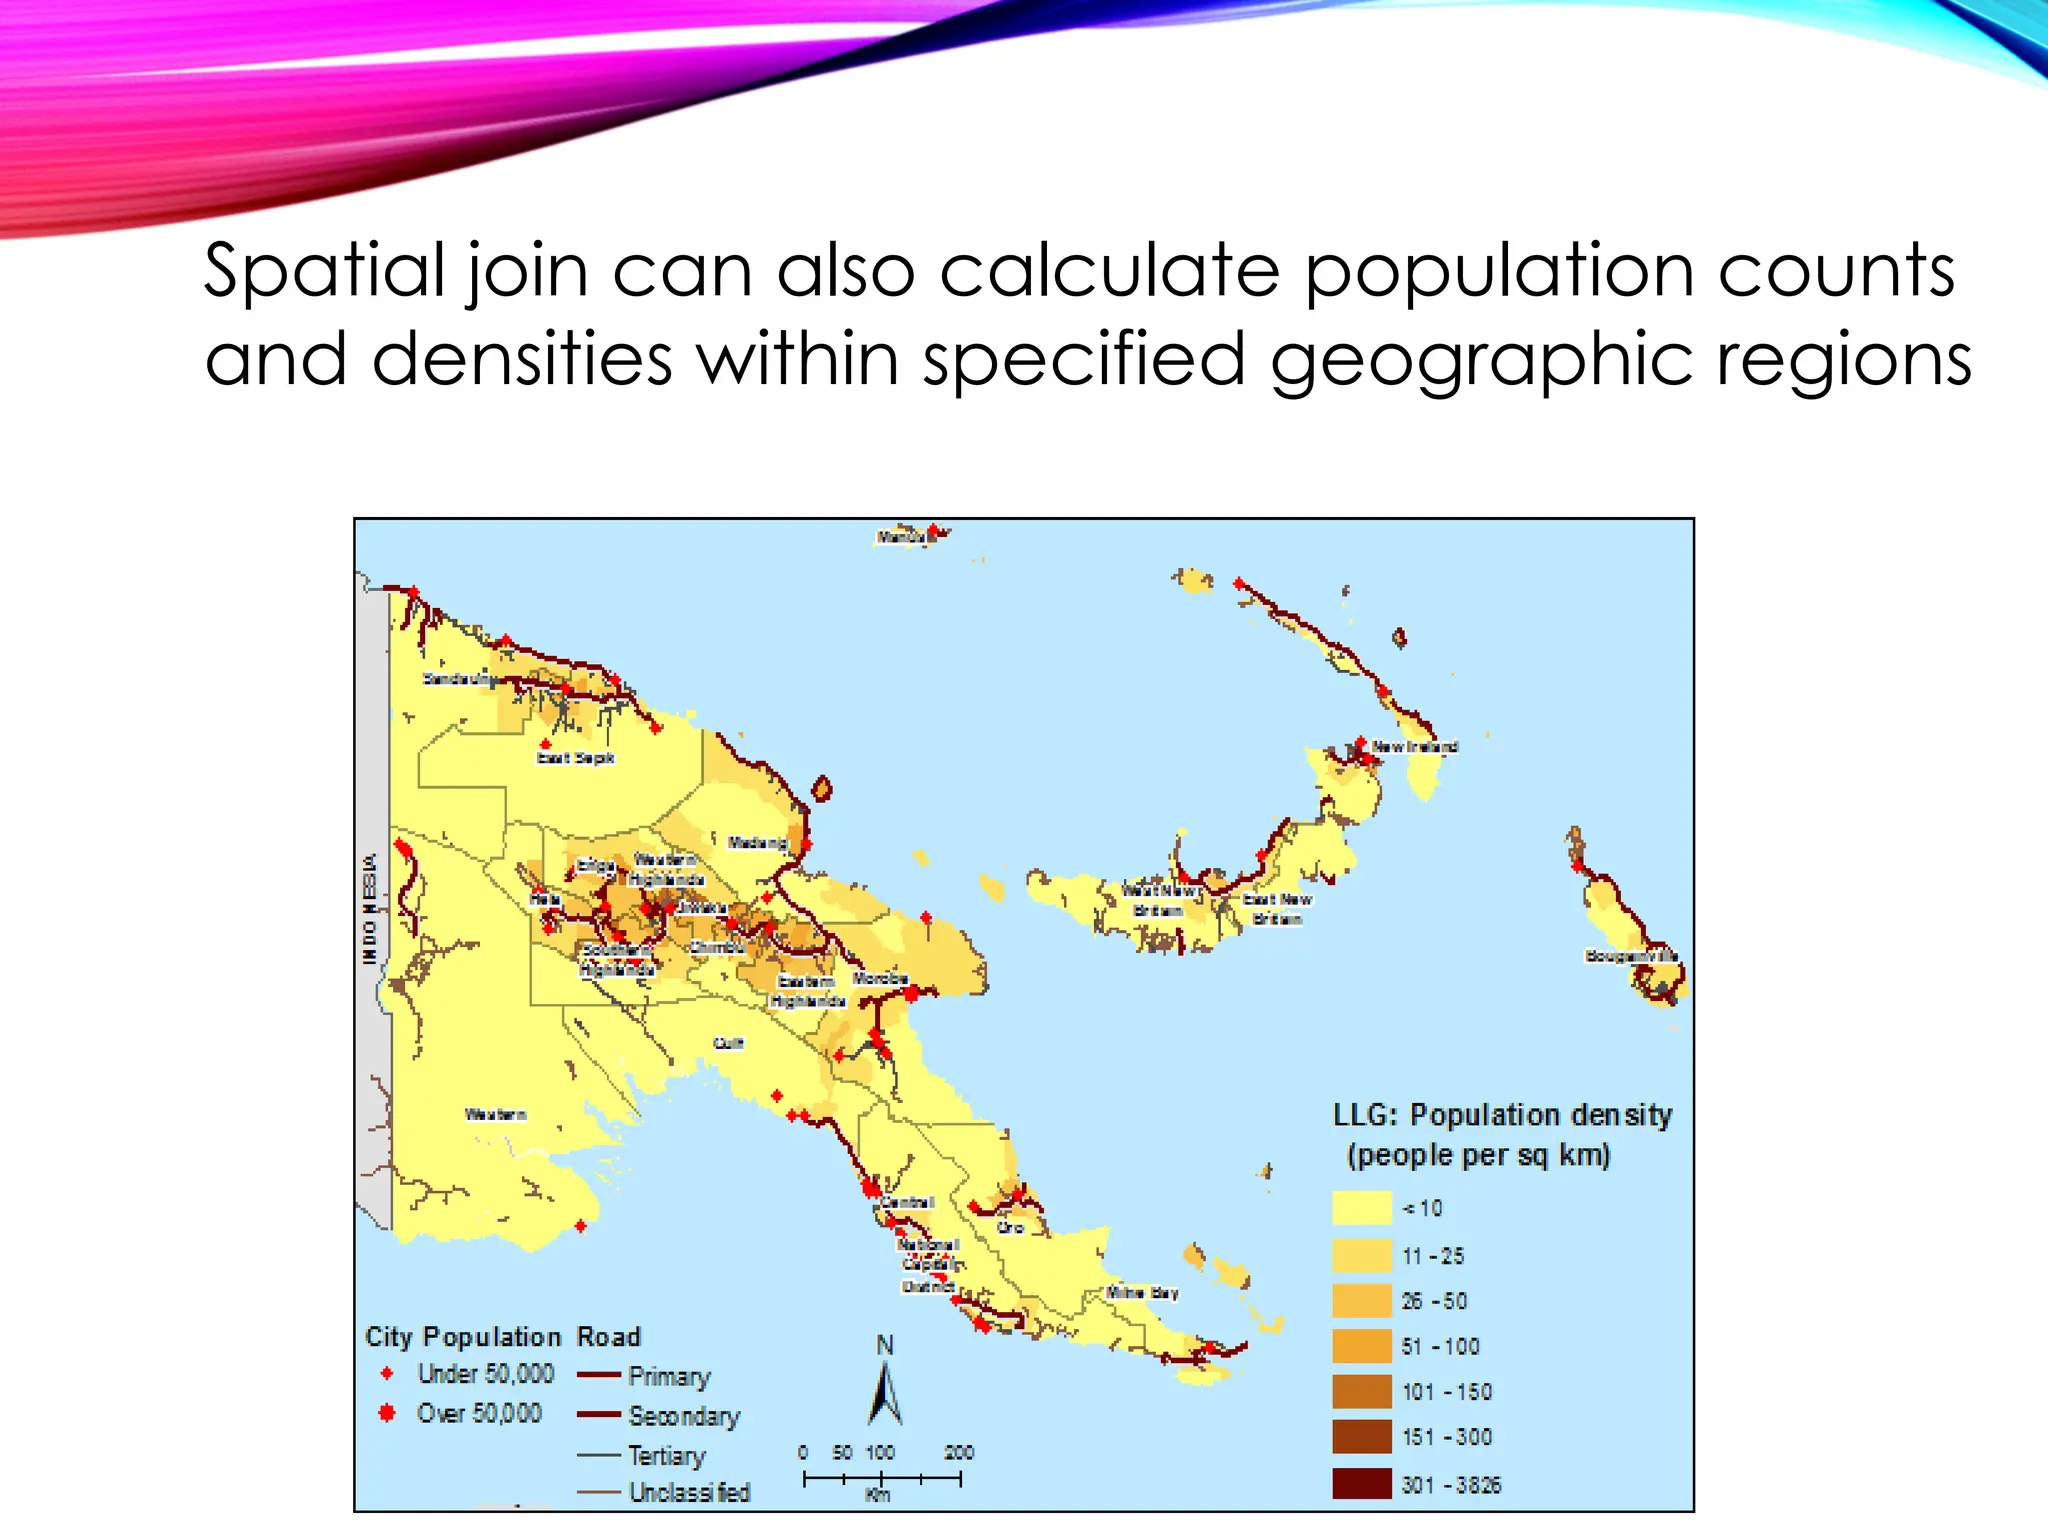
manages, analyzes, and visualizes spatial data,
including maps, satellite imagery, and other geospatial
information
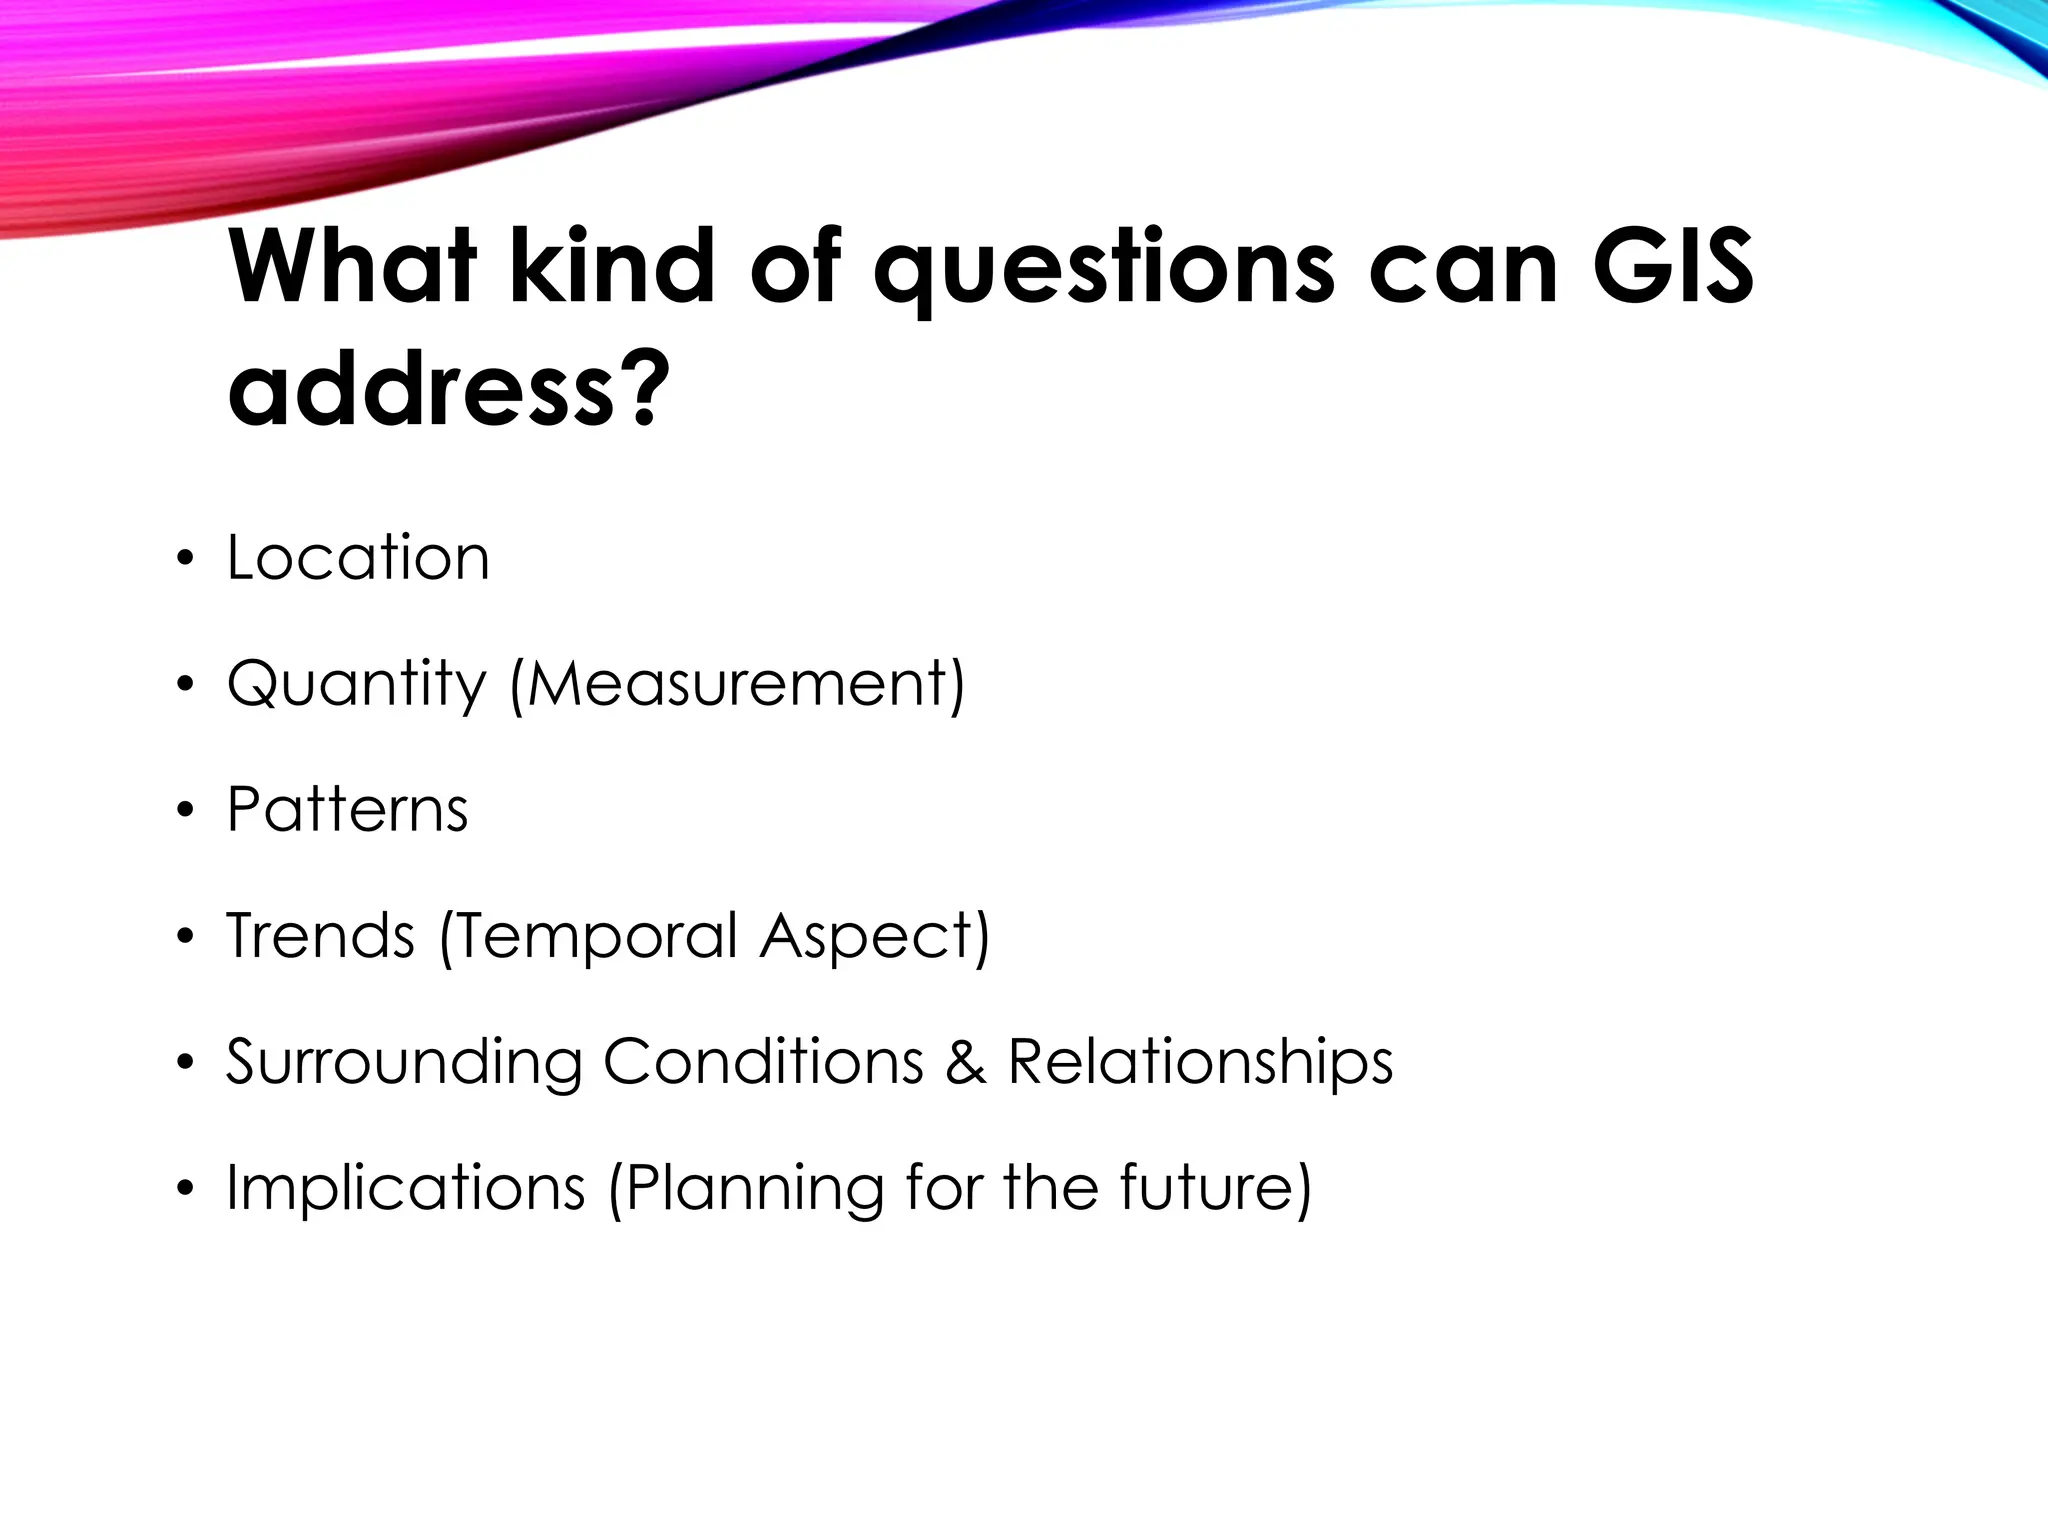
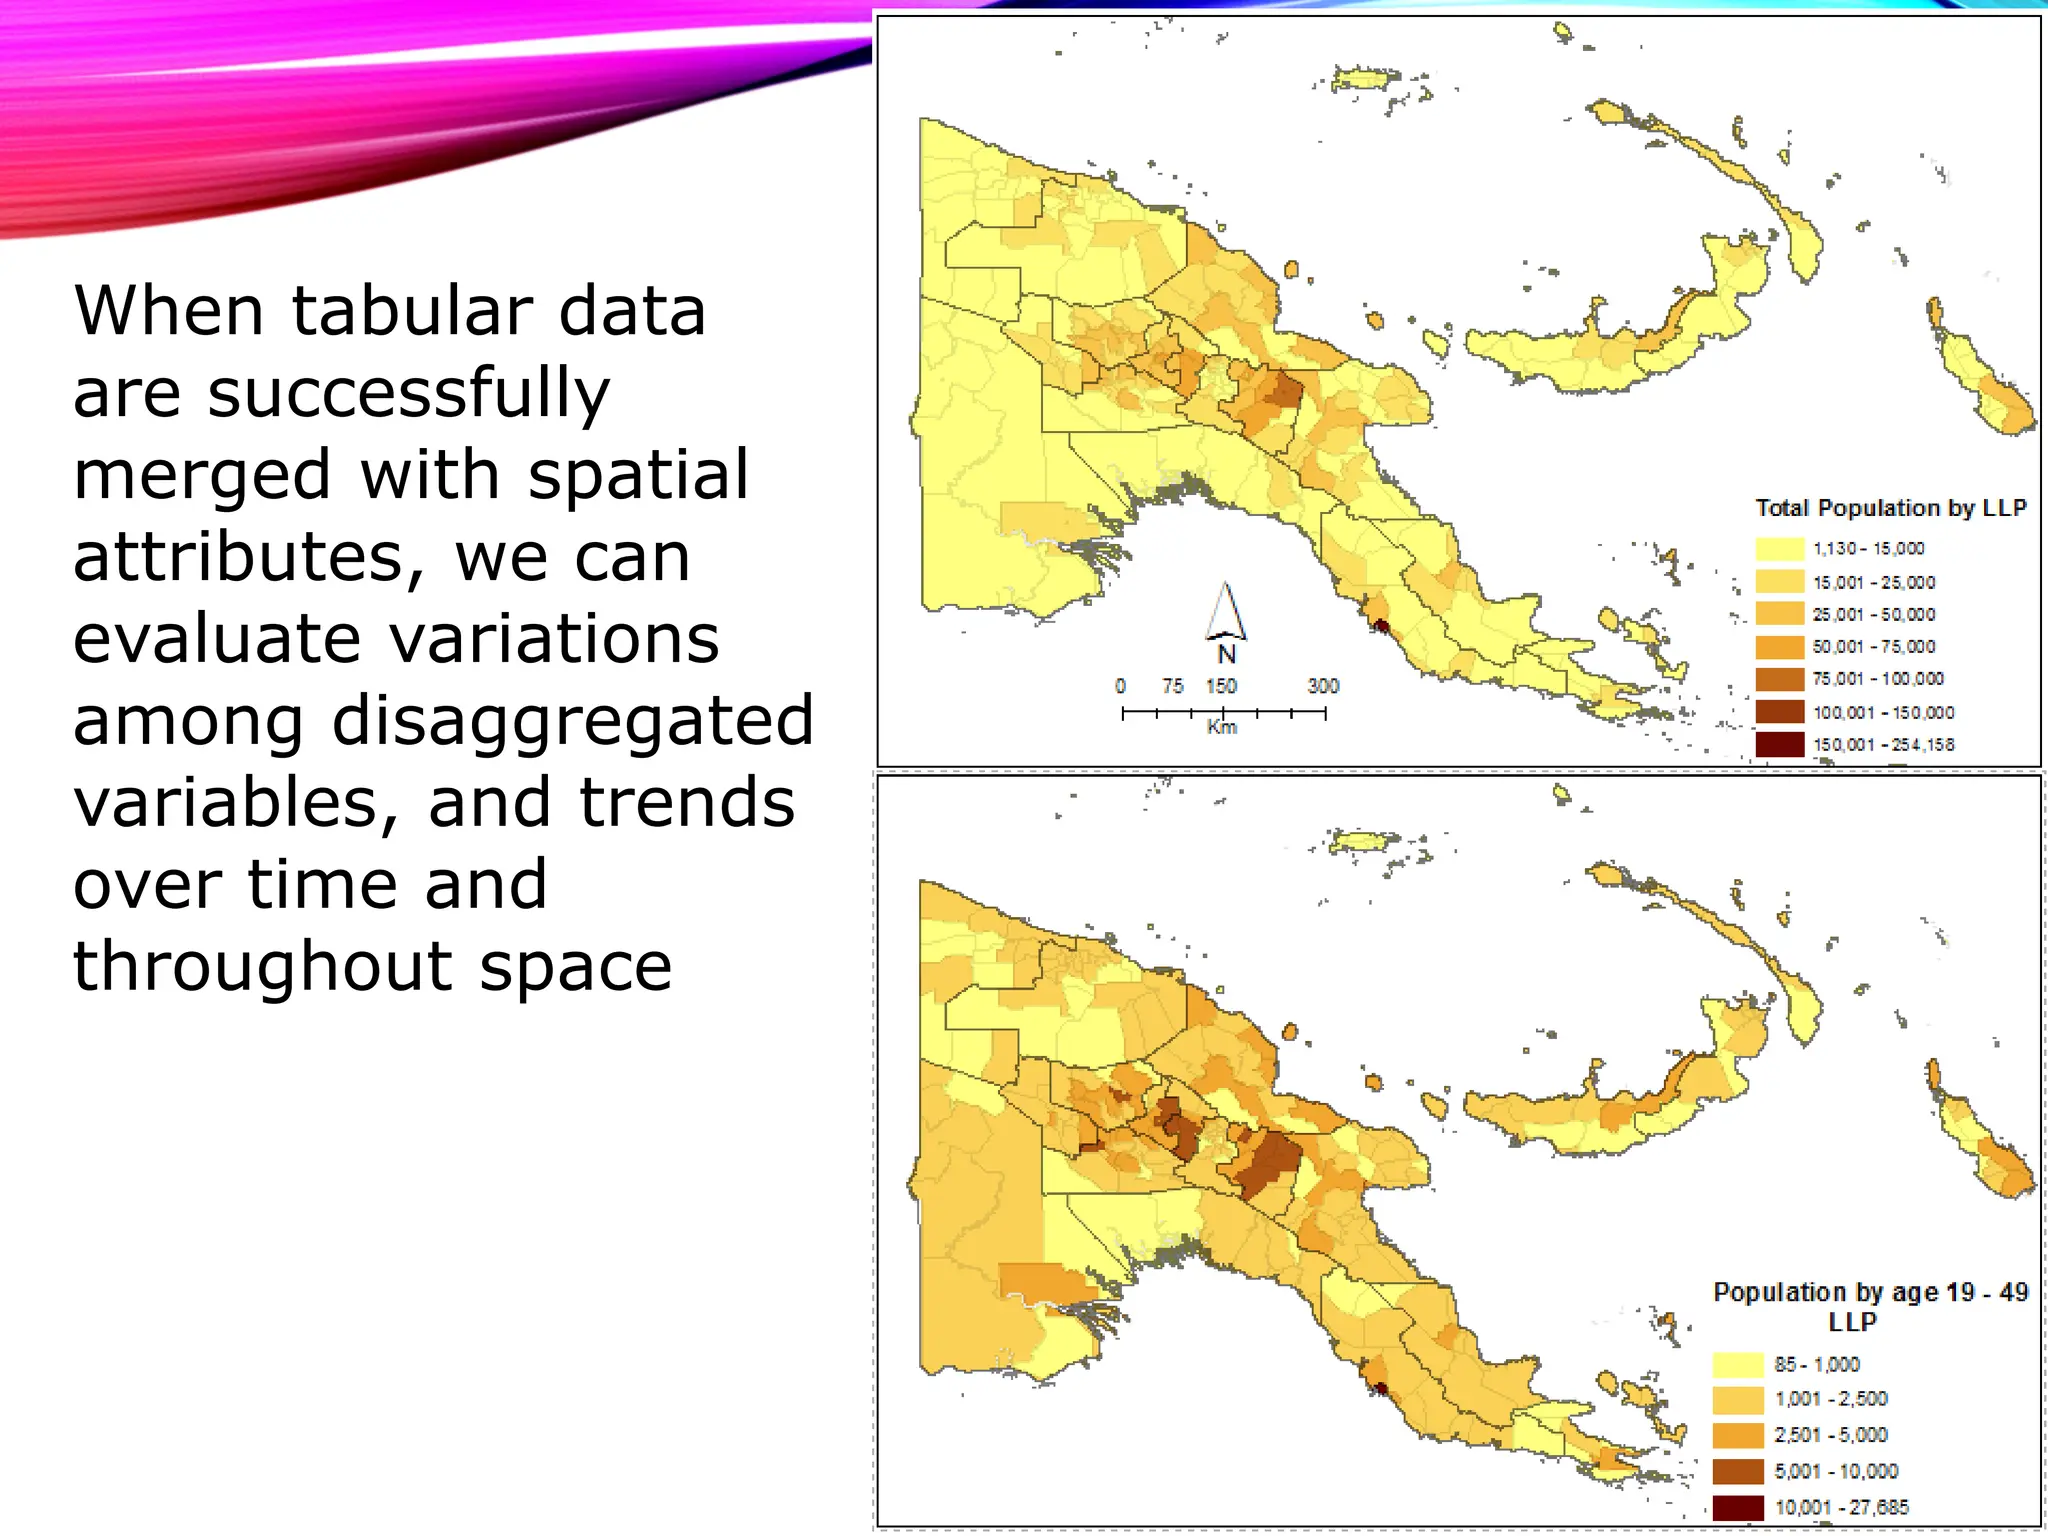
• GIS allows for the integration and analysis of data from
multiple sources, helping to understand patterns,
relationships, and trends in geographic data.