Downloaded 111 times
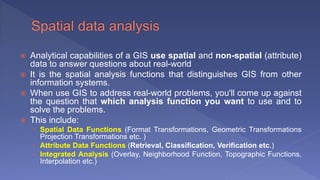
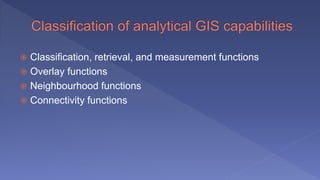
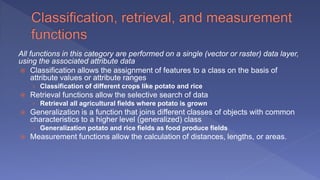

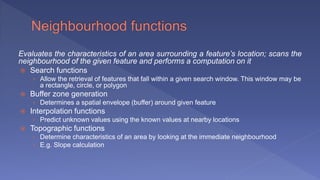


The document outlines various analytical capabilities of Geographic Information Systems (GIS), including spatial and attribute data functions used to address real-world problems. It discusses classification, retrieval, measurement, overlay, and neighborhood functions, as well as advanced techniques such as network analysis and location-allocation for effective decision-making. Additionally, the text explains different modeling approaches in GIS, focusing on descriptive, prescriptive, and predictive models, along with their methodologies and characteristics.