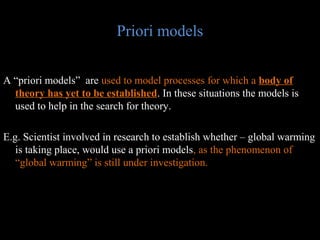
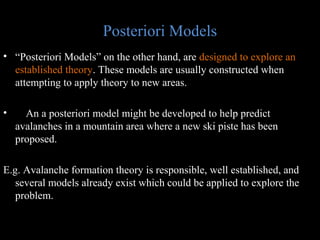
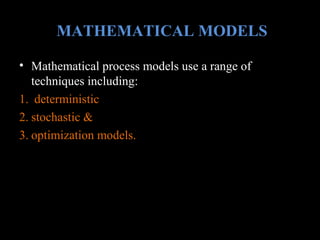
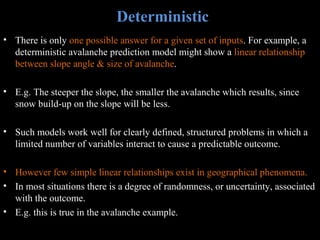
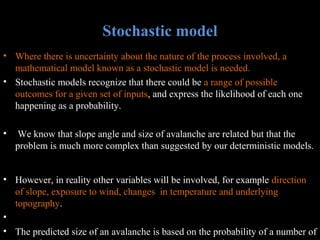
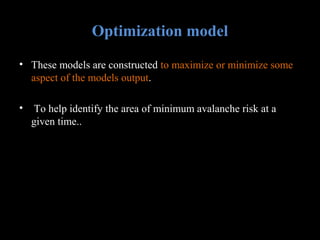
This document discusses different types of models used for modeling spatial processes in GIS for decision support. It describes natural and scale analogue models which use real-world events or objects as analogues. Conceptual models represent processes visually using diagrams. Mathematical models include deterministic, stochastic, and optimization models. Deterministic models show direct relationships while stochastic models use probabilities. Optimization models maximize or minimize outputs. The document argues that combining different modeling techniques in GIS allows for complex spatial process modeling to support decisions.
The concept of GIS was first introduced in the early 1960s, and it was subsequently researched and developed as a new discipline. The GIS history views Roger Tomlinson as a pioneer of the concept, where the first iteration was designed to store, collate, and analyze data about land usage in Canada.
In the context of remote sensing, change detection refers to the process of identifying differences in the state of land features by observing them at different times. This process can be accomplished either manually (i.e., by hand) or with the aid of remote sensing software. Manual interpretation of change from satellite images or aerial photos involves an observer or analyst defining areas of interest and comparing them between images from two dates. This may be accomplished either on-screen (such as in a GIS) or on paper. When analyzing aerial photographs, a stereoscope which allows for two spatially-overlapping photos to be displayed in 3D, can aid photo interpretation. Manual image interpretation works well when assessing change between discrete classes (forest openings, land use and land cover maps) or when changes are large (e.g., heavy mechanized maneuver damage, engineering training impacts). Manual image interpretation is also an option when trying to determine change using images or photos from different sources (comparing historic aerial photographs to current satellite imagery).
Automated methods of remote sensing change detection usually are of two forms: post-classification change detection and image differencing using band ratios. In post-classification change detection, the images from each time period are classified using the same classification scheme into a number of discrete categories like land cover types. The two (or more) classifications are compared and the area that is classified the same or different is tallied. With image differencing, a band ratio such as NDVI is constructed from each input image, and the difference is taken between the band ratios of different times. In the case of differencing NDVI images, positive output values may indicate an increase in vegetation, negative values a decrease in vegetation, and values near zero no change. With either post-classification or image differencing change detection, it is necessary to specify a threshold below which differences between the two images is considered to be non-significant. The specification of thresholds is critical to the results of change detection analysis and usually must be found through an iterative process.
THIS PRESENTATION IS TO HELP YOU PERFORM THE TASK STEP BY STEP.
Role of electromagnetic Radiation in Remote SensingNzar Braim
Role of electromagnetic Radiation in Remote Sensing
It should be clear by now that the electromagnetic waves are originator and
carrier of information in Earth observation. The information content of the products delivered by a given type of sensor is essentially related to the parameters, mainly frequency (or wavelength) and polarization, characterizing the observing system, including the geometry at which data are acquired. Therefore, the specifications of an EO system, which include the type of sensor, the band of operation, the observation angle, etc.
Geospatial Analysis: Innovation in GIS for Better Decision MakingMEASURE Evaluation
Discussion led by John Spencer and Mark Janko. This webinar shared new techniques in geospatial analysis and how they have the potential to transform data-informed decision making.
Remote Sensing: Principal Component AnalysisKamlesh Kumar
Principal components analysis is a orthogonal transformational technique (preserving the symmetry between vectors and angles) to reveal new set of data arguably better from the original data set and better capture the essential information as well. It happens often that some variables are highly correlated with a lot of duplication. Instead of discarding the redundant data, principal components analysis condenses the info. in inter-correlated variables into a few variables, called principal components.
The main idea of Principal Component Analysis (PCA) is to reduce the dimensionality of a data set consisting of many variables correlated with each other, either heavily or lightly, while retaining the variation present in the dataset, up to the maximum extent.
THIS PRESENTATION IS TO HELP YOU PERFORM THE TASK STEP BY STEP.
Explanation of very simple methods for atmospheric corrections and an example adapted from a paper of the Dept. of Thermodynamics, University of Valencia, Spain.
it is highly useful for geography students in the field of remote sensing and it is in very simple and explanatory for the purpose of simplification with relevant images in this ppt.
Gis Geographical Information System FundamentalsUroosa Samman
Gis, Geographical Information System Fundamentals. This presentation includes a complete detail of GIS and GIS Softwares. It will help students of GIS and Environmental Science.
Application of Basic Remote Sensing in GeologyUzair Khan
Application of basic remote sensing in Geology. This presentation tries to discriminate the lithology in the Landsat-7 scene located Karachi West. Although other enhanced methodology available to discriminate the rock types, here just a band ratios and simple band combination used for lithology identification.
Approaches to gather business requirements, defining problem statements, business requirements for
use case development, Assets for development of IoT solutions
Physical processes in the earth system are modeled with mathematical representations called parameterizations. This talk will describe some of the conceptual approaches and mathematics used do describe physical parameterizations focusing on cloud parameterizations. This includes tracing physical laws to discrete representations in coarse scale models. Clouds illustrate several of the complexities and techniques common to many physical parameterizations. This includes the problem of different scales, sub-grid scale variability. Discussions of mathematical methods for dealing with the sub-grid scale will be discussed. In-exactness or indeterminate problems for both weather and climate will be discussed, including the problems of indeterminate parameterizations, and inexact initial conditions. Different mathematical methods, including the use of stochastic methods, will be described and discussed, with examples from contemporary earth system models.
"Application of Gaussian process regression for structural analysis" presente...TRUSS ITN
The current paper discusses the applicability of Gaussian process regressions, also known as Kriging models, in the context of structural and reliability analysis. Due to their flexibility these models appear in the field of structural analysis in many forms. Applications to approximate limit state functions, replace the computational expensive codes that solves the dynamic of complex systems, or replicate stochastic fields can be identified. Due to this fact, a discussion on the different parameters that depend on the implementation procedure chose to use these model is presented in the current paper. Design of experiments, polynomial approximation, correlation function, hyperparameters convergence and estimation function are the main global variables analysed. When implementing a Gaussian regression or Kriging model, the user is faced with the choice of these before any further progress. The discussion presented complements previous works on the implementation of such models in the sense that it focus on the structural analysis application and on how these parameters influence the accuracy. It is shown that depending on the approximation, significant advantage can be taken from understanding these major variables. Different examples are presented to support the understanding of the problem and the main conclusions on the applicability of the Gaussian regression models as surrogates for structural analysis are drawn.
Encryption in Microsoft 365 - ExpertsLive Netherlands 2024Albert Hoitingh
In this session I delve into the encryption technology used in Microsoft 365 and Microsoft Purview. Including the concepts of Customer Key and Double Key Encryption.
GraphSummit Singapore | The Future of Agility: Supercharging Digital Transfor...Neo4j
Leonard Jayamohan, Partner & Generative AI Lead, Deloitte
This keynote will reveal how Deloitte leverages Neo4j’s graph power for groundbreaking digital twin solutions, achieving a staggering 100x performance boost. Discover the essential role knowledge graphs play in successful generative AI implementations. Plus, get an exclusive look at an innovative Neo4j + Generative AI solution Deloitte is developing in-house.
In his public lecture, Christian Timmerer provides insights into the fascinating history of video streaming, starting from its humble beginnings before YouTube to the groundbreaking technologies that now dominate platforms like Netflix and ORF ON. Timmerer also presents provocative contributions of his own that have significantly influenced the industry. He concludes by looking at future challenges and invites the audience to join in a discussion.
Why You Should Replace Windows 11 with Nitrux Linux 3.5.0 for enhanced perfor...SOFTTECHHUB
The choice of an operating system plays a pivotal role in shaping our computing experience. For decades, Microsoft's Windows has dominated the market, offering a familiar and widely adopted platform for personal and professional use. However, as technological advancements continue to push the boundaries of innovation, alternative operating systems have emerged, challenging the status quo and offering users a fresh perspective on computing.
One such alternative that has garnered significant attention and acclaim is Nitrux Linux 3.5.0, a sleek, powerful, and user-friendly Linux distribution that promises to redefine the way we interact with our devices. With its focus on performance, security, and customization, Nitrux Linux presents a compelling case for those seeking to break free from the constraints of proprietary software and embrace the freedom and flexibility of open-source computing.
LF Energy Webinar: Electrical Grid Modelling and Simulation Through PowSyBl -...DanBrown980551
Do you want to learn how to model and simulate an electrical network from scratch in under an hour?
Then welcome to this PowSyBl workshop, hosted by Rte, the French Transmission System Operator (TSO)!
During the webinar, you will discover the PowSyBl ecosystem as well as handle and study an electrical network through an interactive Python notebook.
PowSyBl is an open source project hosted by LF Energy, which offers a comprehensive set of features for electrical grid modelling and simulation. Among other advanced features, PowSyBl provides:
- A fully editable and extendable library for grid component modelling;
- Visualization tools to display your network;
- Grid simulation tools, such as power flows, security analyses (with or without remedial actions) and sensitivity analyses;
The framework is mostly written in Java, with a Python binding so that Python developers can access PowSyBl functionalities as well.
What you will learn during the webinar:
- For beginners: discover PowSyBl's functionalities through a quick general presentation and the notebook, without needing any expert coding skills;
- For advanced developers: master the skills to efficiently apply PowSyBl functionalities to your real-world scenarios.
UiPath Test Automation using UiPath Test Suite series, part 4DianaGray10
Welcome to UiPath Test Automation using UiPath Test Suite series part 4. In this session, we will cover Test Manager overview along with SAP heatmap.
The UiPath Test Manager overview with SAP heatmap webinar offers a concise yet comprehensive exploration of the role of a Test Manager within SAP environments, coupled with the utilization of heatmaps for effective testing strategies.
Participants will gain insights into the responsibilities, challenges, and best practices associated with test management in SAP projects. Additionally, the webinar delves into the significance of heatmaps as a visual aid for identifying testing priorities, areas of risk, and resource allocation within SAP landscapes. Through this session, attendees can expect to enhance their understanding of test management principles while learning practical approaches to optimize testing processes in SAP environments using heatmap visualization techniques
What will you get from this session?
1. Insights into SAP testing best practices
2. Heatmap utilization for testing
3. Optimization of testing processes
4. Demo
Topics covered:
Execution from the test manager
Orchestrator execution result
Defect reporting
SAP heatmap example with demo
Speaker:
Deepak Rai, Automation Practice Lead, Boundaryless Group and UiPath MVP
State of ICS and IoT Cyber Threat Landscape Report 2024 previewPrayukth K V
The IoT and OT threat landscape report has been prepared by the Threat Research Team at Sectrio using data from Sectrio, cyber threat intelligence farming facilities spread across over 85 cities around the world. In addition, Sectrio also runs AI-based advanced threat and payload engagement facilities that serve as sinks to attract and engage sophisticated threat actors, and newer malware including new variants and latent threats that are at an earlier stage of development.
The latest edition of the OT/ICS and IoT security Threat Landscape Report 2024 also covers:
State of global ICS asset and network exposure
Sectoral targets and attacks as well as the cost of ransom
Global APT activity, AI usage, actor and tactic profiles, and implications
Rise in volumes of AI-powered cyberattacks
Major cyber events in 2024
Malware and malicious payload trends
Cyberattack types and targets
Vulnerability exploit attempts on CVEs
Attacks on counties – USA
Expansion of bot farms – how, where, and why
In-depth analysis of the cyber threat landscape across North America, South America, Europe, APAC, and the Middle East
Why are attacks on smart factories rising?
Cyber risk predictions
Axis of attacks – Europe
Systemic attacks in the Middle East
Download the full report from here:
https://sectrio.com/resources/ot-threat-landscape-reports/sectrio-releases-ot-ics-and-iot-security-threat-landscape-report-2024/
GraphRAG is All You need? LLM & Knowledge GraphGuy Korland
Guy Korland, CEO and Co-founder of FalkorDB, will review two articles on the integration of language models with knowledge graphs.
1. Unifying Large Language Models and Knowledge Graphs: A Roadmap.
https://arxiv.org/abs/2306.08302
2. Microsoft Research's GraphRAG paper and a review paper on various uses of knowledge graphs:
https://www.microsoft.com/en-us/research/blog/graphrag-unlocking-llm-discovery-on-narrative-private-data/
GraphSummit Singapore | The Art of the Possible with Graph - Q2 2024Neo4j
Neha Bajwa, Vice President of Product Marketing, Neo4j
Join us as we explore breakthrough innovations enabled by interconnected data and AI. Discover firsthand how organizations use relationships in data to uncover contextual insights and solve our most pressing challenges – from optimizing supply chains, detecting fraud, and improving customer experiences to accelerating drug discoveries.
Smart TV Buyer Insights Survey 2024 by 91mobiles.pdf91mobiles
91mobiles recently conducted a Smart TV Buyer Insights Survey in which we asked over 3,000 respondents about the TV they own, aspects they look at on a new TV, and their TV buying preferences.
SAP Sapphire 2024 - ASUG301 building better apps with SAP Fiori.pdfPeter Spielvogel
Building better applications for business users with SAP Fiori.
• What is SAP Fiori and why it matters to you
• How a better user experience drives measurable business benefits
• How to get started with SAP Fiori today
• How SAP Fiori elements accelerates application development
• How SAP Build Code includes SAP Fiori tools and other generative artificial intelligence capabilities
• How SAP Fiori paves the way for using AI in SAP apps
A tale of scale & speed: How the US Navy is enabling software delivery from l...sonjaschweigert1
Rapid and secure feature delivery is a goal across every application team and every branch of the DoD. The Navy’s DevSecOps platform, Party Barge, has achieved:
- Reduction in onboarding time from 5 weeks to 1 day
- Improved developer experience and productivity through actionable findings and reduction of false positives
- Maintenance of superior security standards and inherent policy enforcement with Authorization to Operate (ATO)
Development teams can ship efficiently and ensure applications are cyber ready for Navy Authorizing Officials (AOs). In this webinar, Sigma Defense and Anchore will give attendees a look behind the scenes and demo secure pipeline automation and security artifacts that speed up application ATO and time to production.
We will cover:
- How to remove silos in DevSecOps
- How to build efficient development pipeline roles and component templates
- How to deliver security artifacts that matter for ATO’s (SBOMs, vulnerability reports, and policy evidence)
- How to streamline operations with automated policy checks on container images
Unlocking Productivity: Leveraging the Potential of Copilot in Microsoft 365, a presentation by Christoforos Vlachos, Senior Solutions Manager – Modern Workplace, Uni Systems
Sudheer Mechineni, Head of Application Frameworks, Standard Chartered Bank
Discover how Standard Chartered Bank harnessed the power of Neo4j to transform complex data access challenges into a dynamic, scalable graph database solution. This keynote will cover their journey from initial adoption to deploying a fully automated, enterprise-grade causal cluster, highlighting key strategies for modelling organisational changes and ensuring robust disaster recovery. Learn how these innovations have not only enhanced Standard Chartered Bank’s data infrastructure but also positioned them as pioneers in the banking sector’s adoption of graph technology.
GDG Cloud Southlake #33: Boule & Rebala: Effective AppSec in SDLC using Deplo...James Anderson
Effective Application Security in Software Delivery lifecycle using Deployment Firewall and DBOM
The modern software delivery process (or the CI/CD process) includes many tools, distributed teams, open-source code, and cloud platforms. Constant focus on speed to release software to market, along with the traditional slow and manual security checks has caused gaps in continuous security as an important piece in the software supply chain. Today organizations feel more susceptible to external and internal cyber threats due to the vast attack surface in their applications supply chain and the lack of end-to-end governance and risk management.
The software team must secure its software delivery process to avoid vulnerability and security breaches. This needs to be achieved with existing tool chains and without extensive rework of the delivery processes. This talk will present strategies and techniques for providing visibility into the true risk of the existing vulnerabilities, preventing the introduction of security issues in the software, resolving vulnerabilities in production environments quickly, and capturing the deployment bill of materials (DBOM).
Speakers:
Bob Boule
Robert Boule is a technology enthusiast with PASSION for technology and making things work along with a knack for helping others understand how things work. He comes with around 20 years of solution engineering experience in application security, software continuous delivery, and SaaS platforms. He is known for his dynamic presentations in CI/CD and application security integrated in software delivery lifecycle.
Gopinath Rebala
Gopinath Rebala is the CTO of OpsMx, where he has overall responsibility for the machine learning and data processing architectures for Secure Software Delivery. Gopi also has a strong connection with our customers, leading design and architecture for strategic implementations. Gopi is a frequent speaker and well-known leader in continuous delivery and integrating security into software delivery.
GDG Cloud Southlake #33: Boule & Rebala: Effective AppSec in SDLC using Deplo...
Models of spatial process by sushant
1. GIS-MODELLING FOR DECISION SUPPORT:
MODELS OF SPATIAL PROCESSES:
NATURAL & SCALE ANALOGUE MODELS
CONCEPTUAL MODELS
MATHEMATICAL MODEL
Represented By
Sushant Sawant
Mtech I Geoinformatics
2. Introduction
• Models of spatial form are represented and analyzed using GIS. These
models can be used in many ways in data analysis operations;
however , they tell us nothing about the process responsible for
creating or changing spatial form.
• E.g. Population change, climate change, soil erosion. Etc.
3. Models of spatial process
• A process model simulates “real – world processes”.
• There are “2 reasons” for constructing such a model.
•
1. From a “pragmatic point of view” decision- need to be made and
actions taken about spatial phenomena. Model help this process.
• 2. From a “philosophical point of view” a process model may be the
only way of evaluating our understanding of the complex behavior of
spatial systems.( Buck et.al., 1995).
4. Why a classification of process models is a
good first step?
• There are many different approaches to process modelling
• To decide which is appropriate in a particular situation
• An understanding of the range of models available, their
strengths and weakness
6. Priori models
A “priori models” are used to model processes for which a body of
theory has yet to be established. In these situations the models is
used to help in the search for theory.
E.g. Scientist involved in research to establish whether – global warming
is taking place, would use a priori models, as the phenomenon of
“global warming” is still under investigation.
7. Posteriori Models
• “Posteriori Models” on the other hand, are designed to explore an
established theory. These models are usually constructed when
attempting to apply theory to new areas.
•
An a posteriori model might be developed to help predict
avalanches in a mountain area where a new ski piste has been
proposed.
E.g. Avalanche formation theory is responsible, well established, and
several models already exist which could be applied to explore the
problem.
8. • Beyond the a priori / a posteriori division, developing a further
classification of process models becomes quite complex.
•
However, 2 useful classifications ( Hardisty et al., 1993; Steyaert,
1993) have been integrated here to provide a starting point for
examining the different types of models.
• The classification includes:
1. natural and scale analogue models.
2. conceptual models.
3. mathematical models.
9. NATURAL & SCALE ANALOGUE MODELS
• Natural analogue models: uses actual “events or real-world”
objects as a basis for model construction (Hardisty et al., 1993).
• These events or objects occur either in “different places or at
different times”.
• E.g. a natural analogue model to predict area the formation of
avalanches in the previously unstudied area of a new ski piste might
be constructed by observing how avalanches form in an area of
similar character.
• The impact that avalanches would have on the proposed ski piste
could also be examined by looking at experiences of ski piste
construction in other areas.
10. SCALE ANALOGUE MODELS
•
There are also scale analogue models (Steyaert,1993) such as
topographic maps & aerial photographs, which are scaled down and
generalized replicas of reality.
•
These are exactly the sort of analogue models that GIS might use to
model the analogue prediction problem.
11. CONCEPTUAL MODELS
•
Conceptual process models are usually expressed in verbal or
graphical form, and attempt to describe in words or pictures
qualitative & quantitative interactions between real-world features.
•
The most common conceptual model is a systems diagram, which
uses symbols to describe the main components & linkages of the
model.
13. MATHEMATICAL MODELS
• Mathematical process models use a range of
techniques including:
1. deterministic
2. stochastic &
3. optimization models.
14. Deterministic
• There is only one possible answer for a given set of inputs. For example, a
deterministic avalanche prediction model might show a linear relationship
between slope angle & size of avalanche.
• E.g. The steeper the slope, the smaller the avalanche which results, since
snow build-up on the slope will be less.
• Such models work well for clearly defined, structured problems in which a
limited number of variables interact to cause a predictable outcome.
• However few simple linear relationships exist in geographical phenomena.
• In most situations there is a degree of randomness, or uncertainty, associated
with the outcome.
• E.g. this is true in the avalanche example.
15. Stochastic model
• Where there is uncertainty about the nature of the process involved, a
mathematical model known as a stochastic model is needed.
• Stochastic models recognize that there could be a range of possible
outcomes for a given set of inputs, and express the likelihood of each one
happening as a probability.
•
We know that slope angle and size of avalanche are related but that the
problem is much more complex than suggested by our deterministic models.
• However, in reality other variables will be involved, for example direction
of slope, exposure to wind, changes in temperature and underlying
topography.
•
• The predicted size of an avalanche is based on the probability of a number of
16. Optimization model
• These models are constructed to maximize or minimize some
aspect of the models output.
•
To help identify the area of minimum avalanche risk at a
given time..
17. Process Modelling & GIS
•
•
•
•
•
•
In GIS all the approaches – natural and scale analogue, conceptual &
mathematical modeling – are used to model spatial processes.
They may be used in isolation, substituted for each other in an interactive
development process or combined in an larger, more complex model.
The given case study shows how different modeling techniques can be used
together to build up complex models of spatial processes.
Unfortunately, proprietary GIS software provides few process models as part
of the standard set of functions.
Thus, generic models, which could be made available in GIS, would be far
too inflexible for widespread use.
In addition, many of the analytical functions provided by other modelling
software, provide an environment for constructing application-specific
models.
18. References
•
Heywood, I., Comelius, S., and Carver, S., (1988). An Introduction to
Geographical Information Systems, Addison Wiley Longmont, New York.
•
Burrough, P. A., and McDonnell, R., (2000). Principles of Geographical
Information Systems, Oxford University Press, London.
•
Research paper on Decision Support Systems by Marek J. Druzdzel and
Roger R. Flynn, Decision Systems Laboratory, School of Information
Sciences and Intelligent Systems Program, University of Pittsburgh,
Pittsburgh, PA 15260