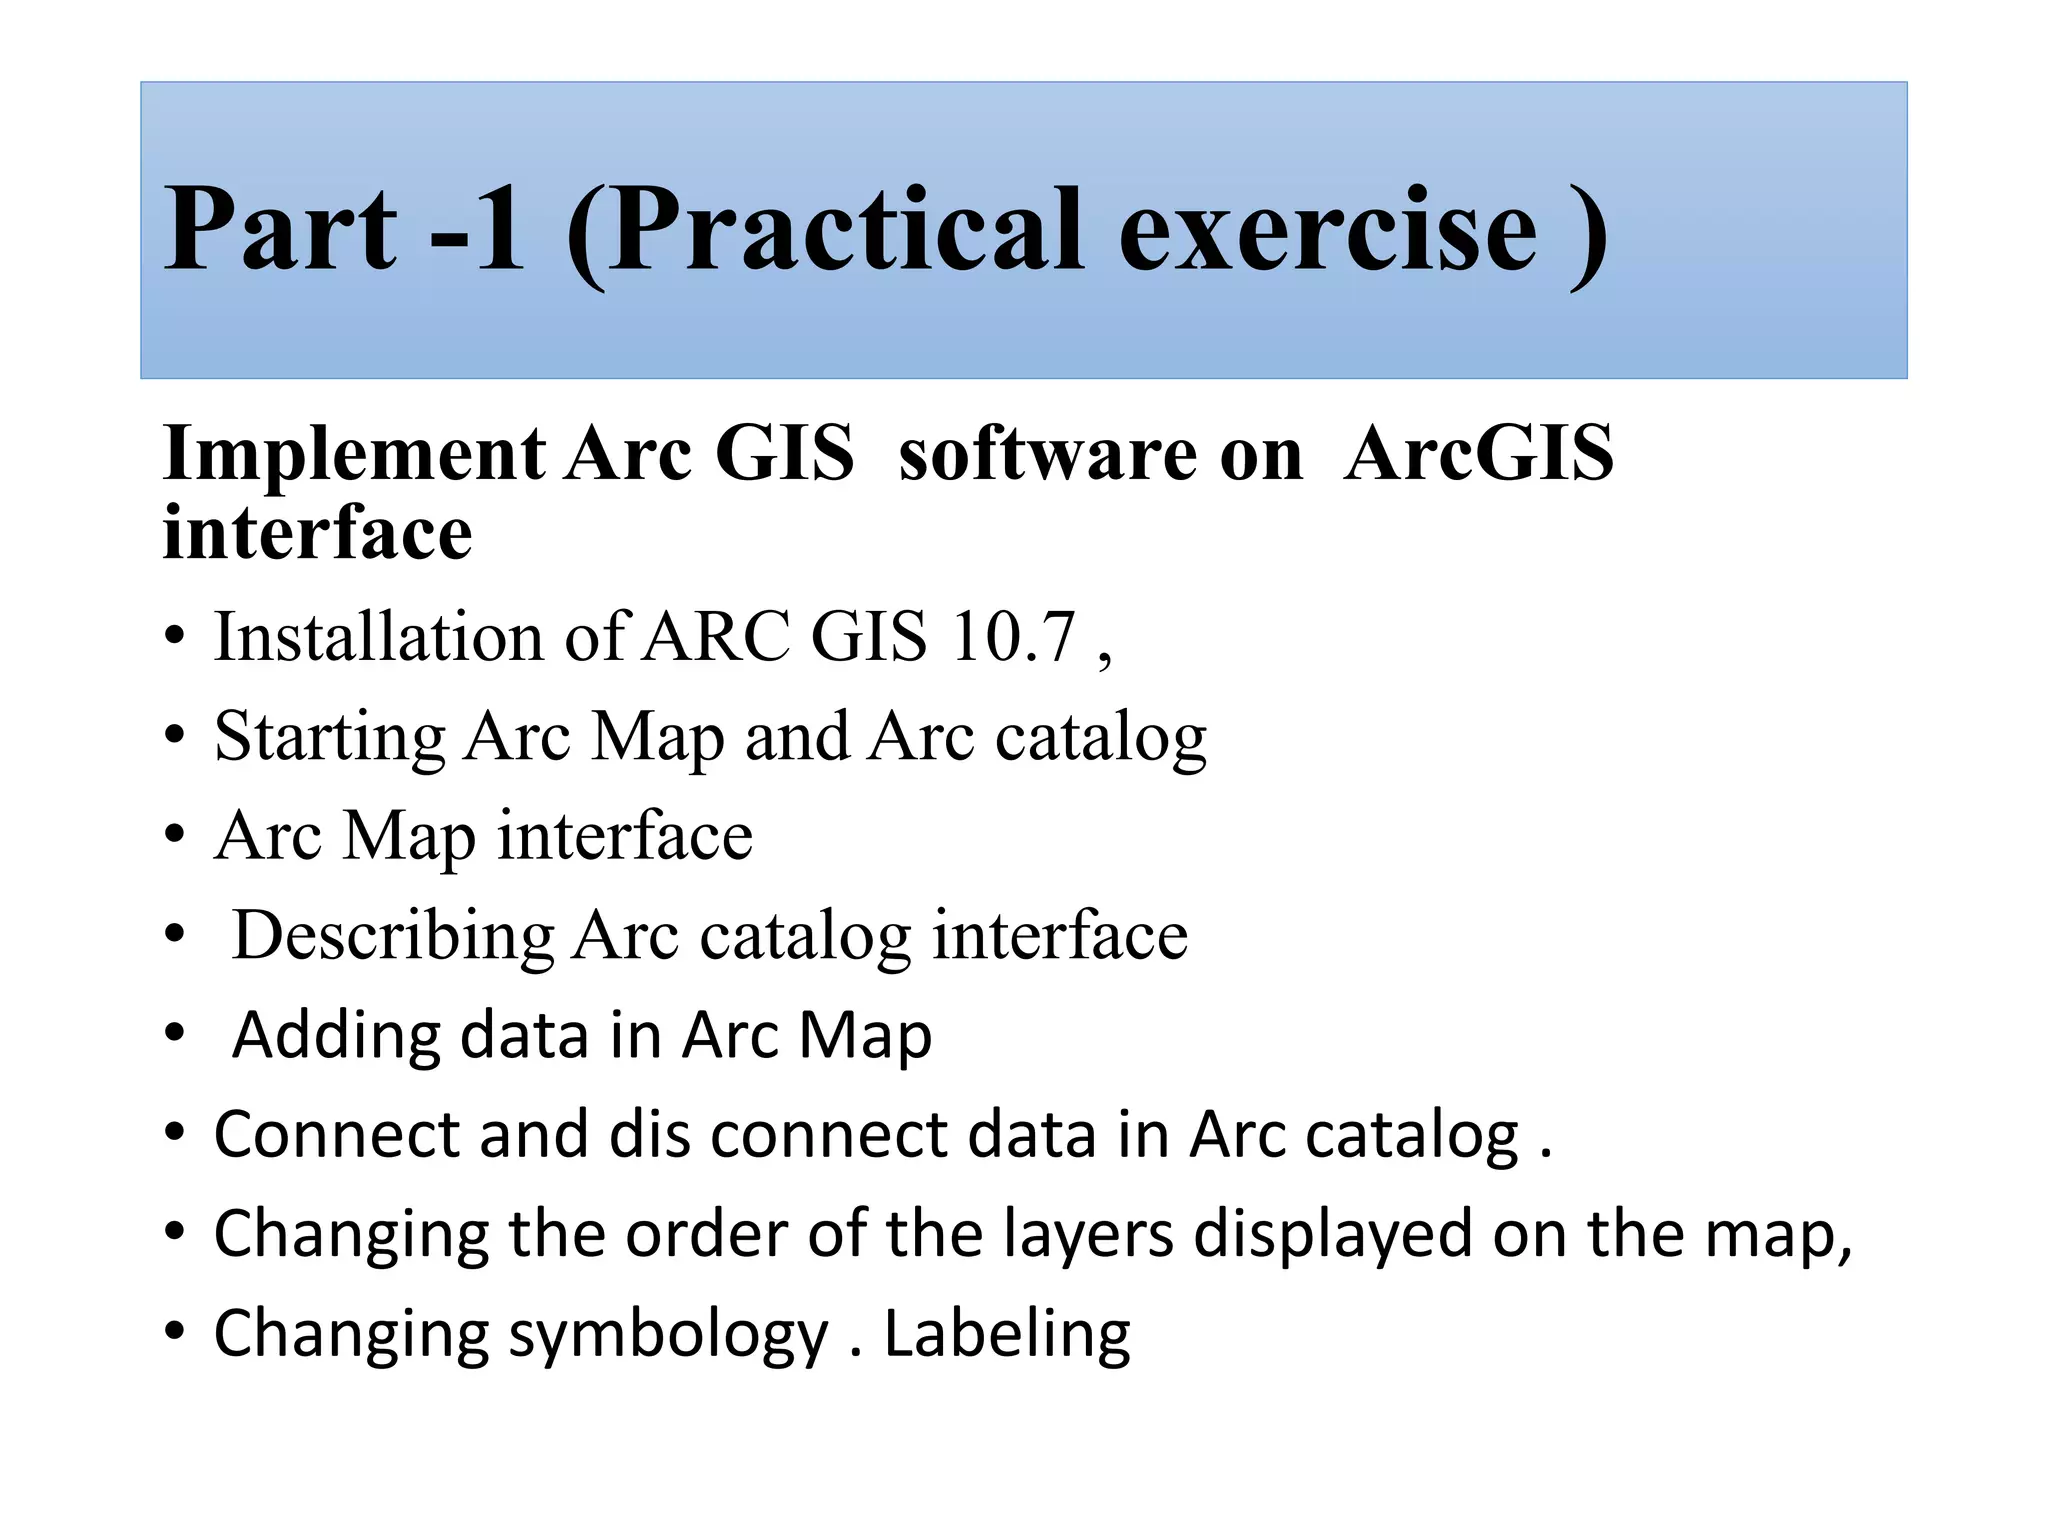
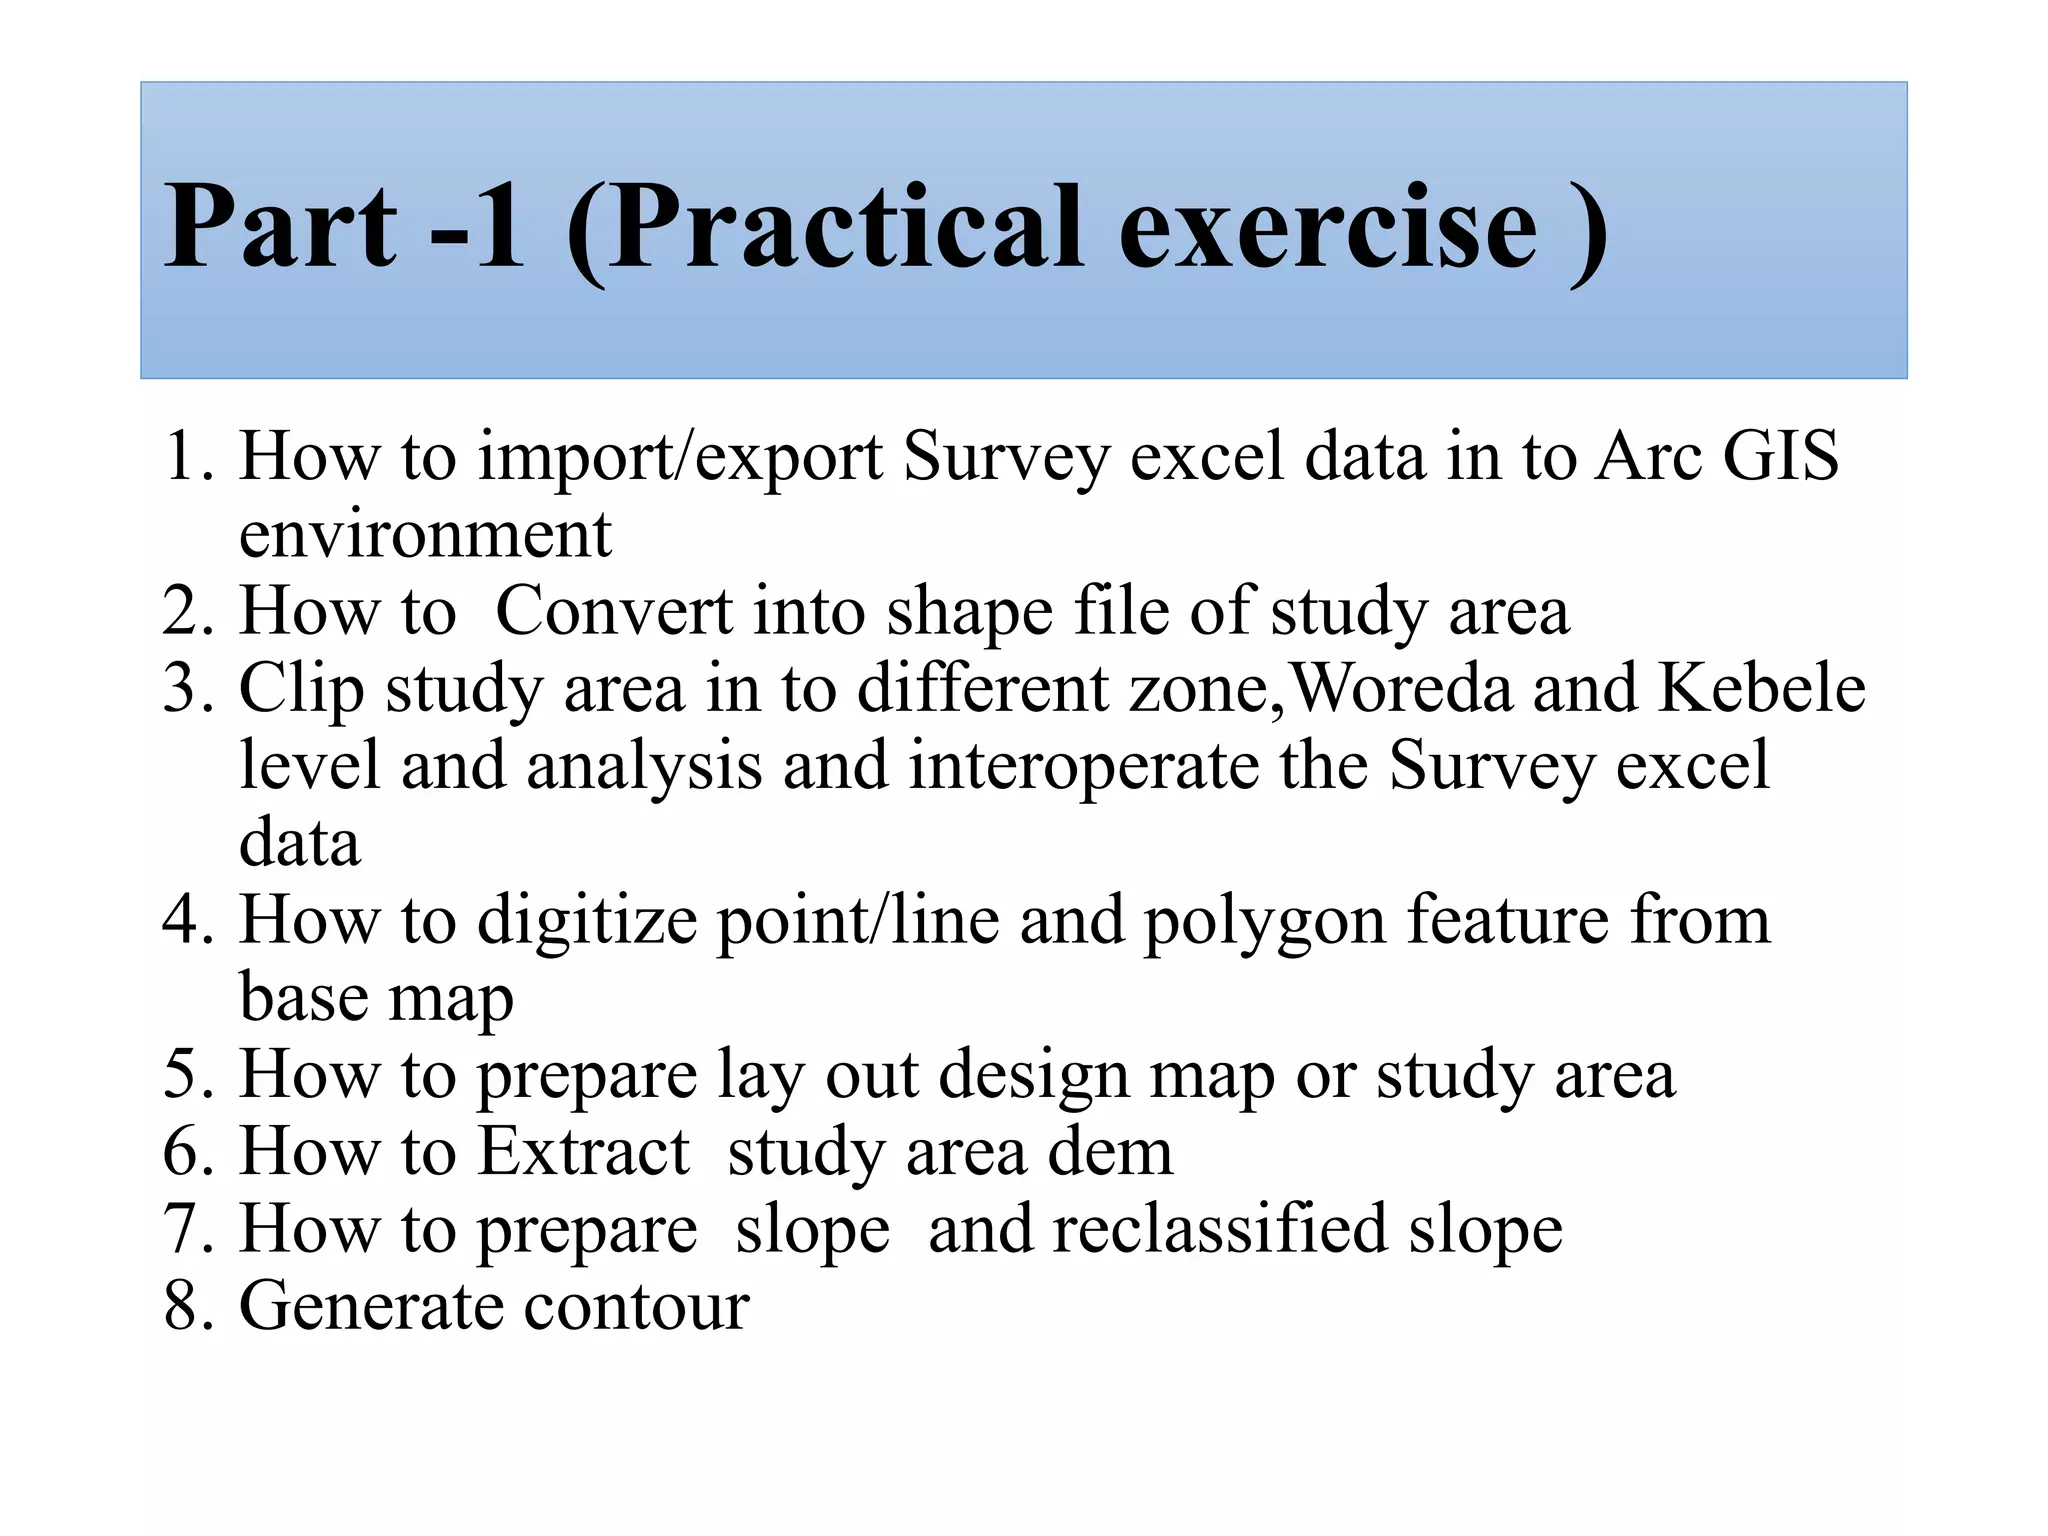
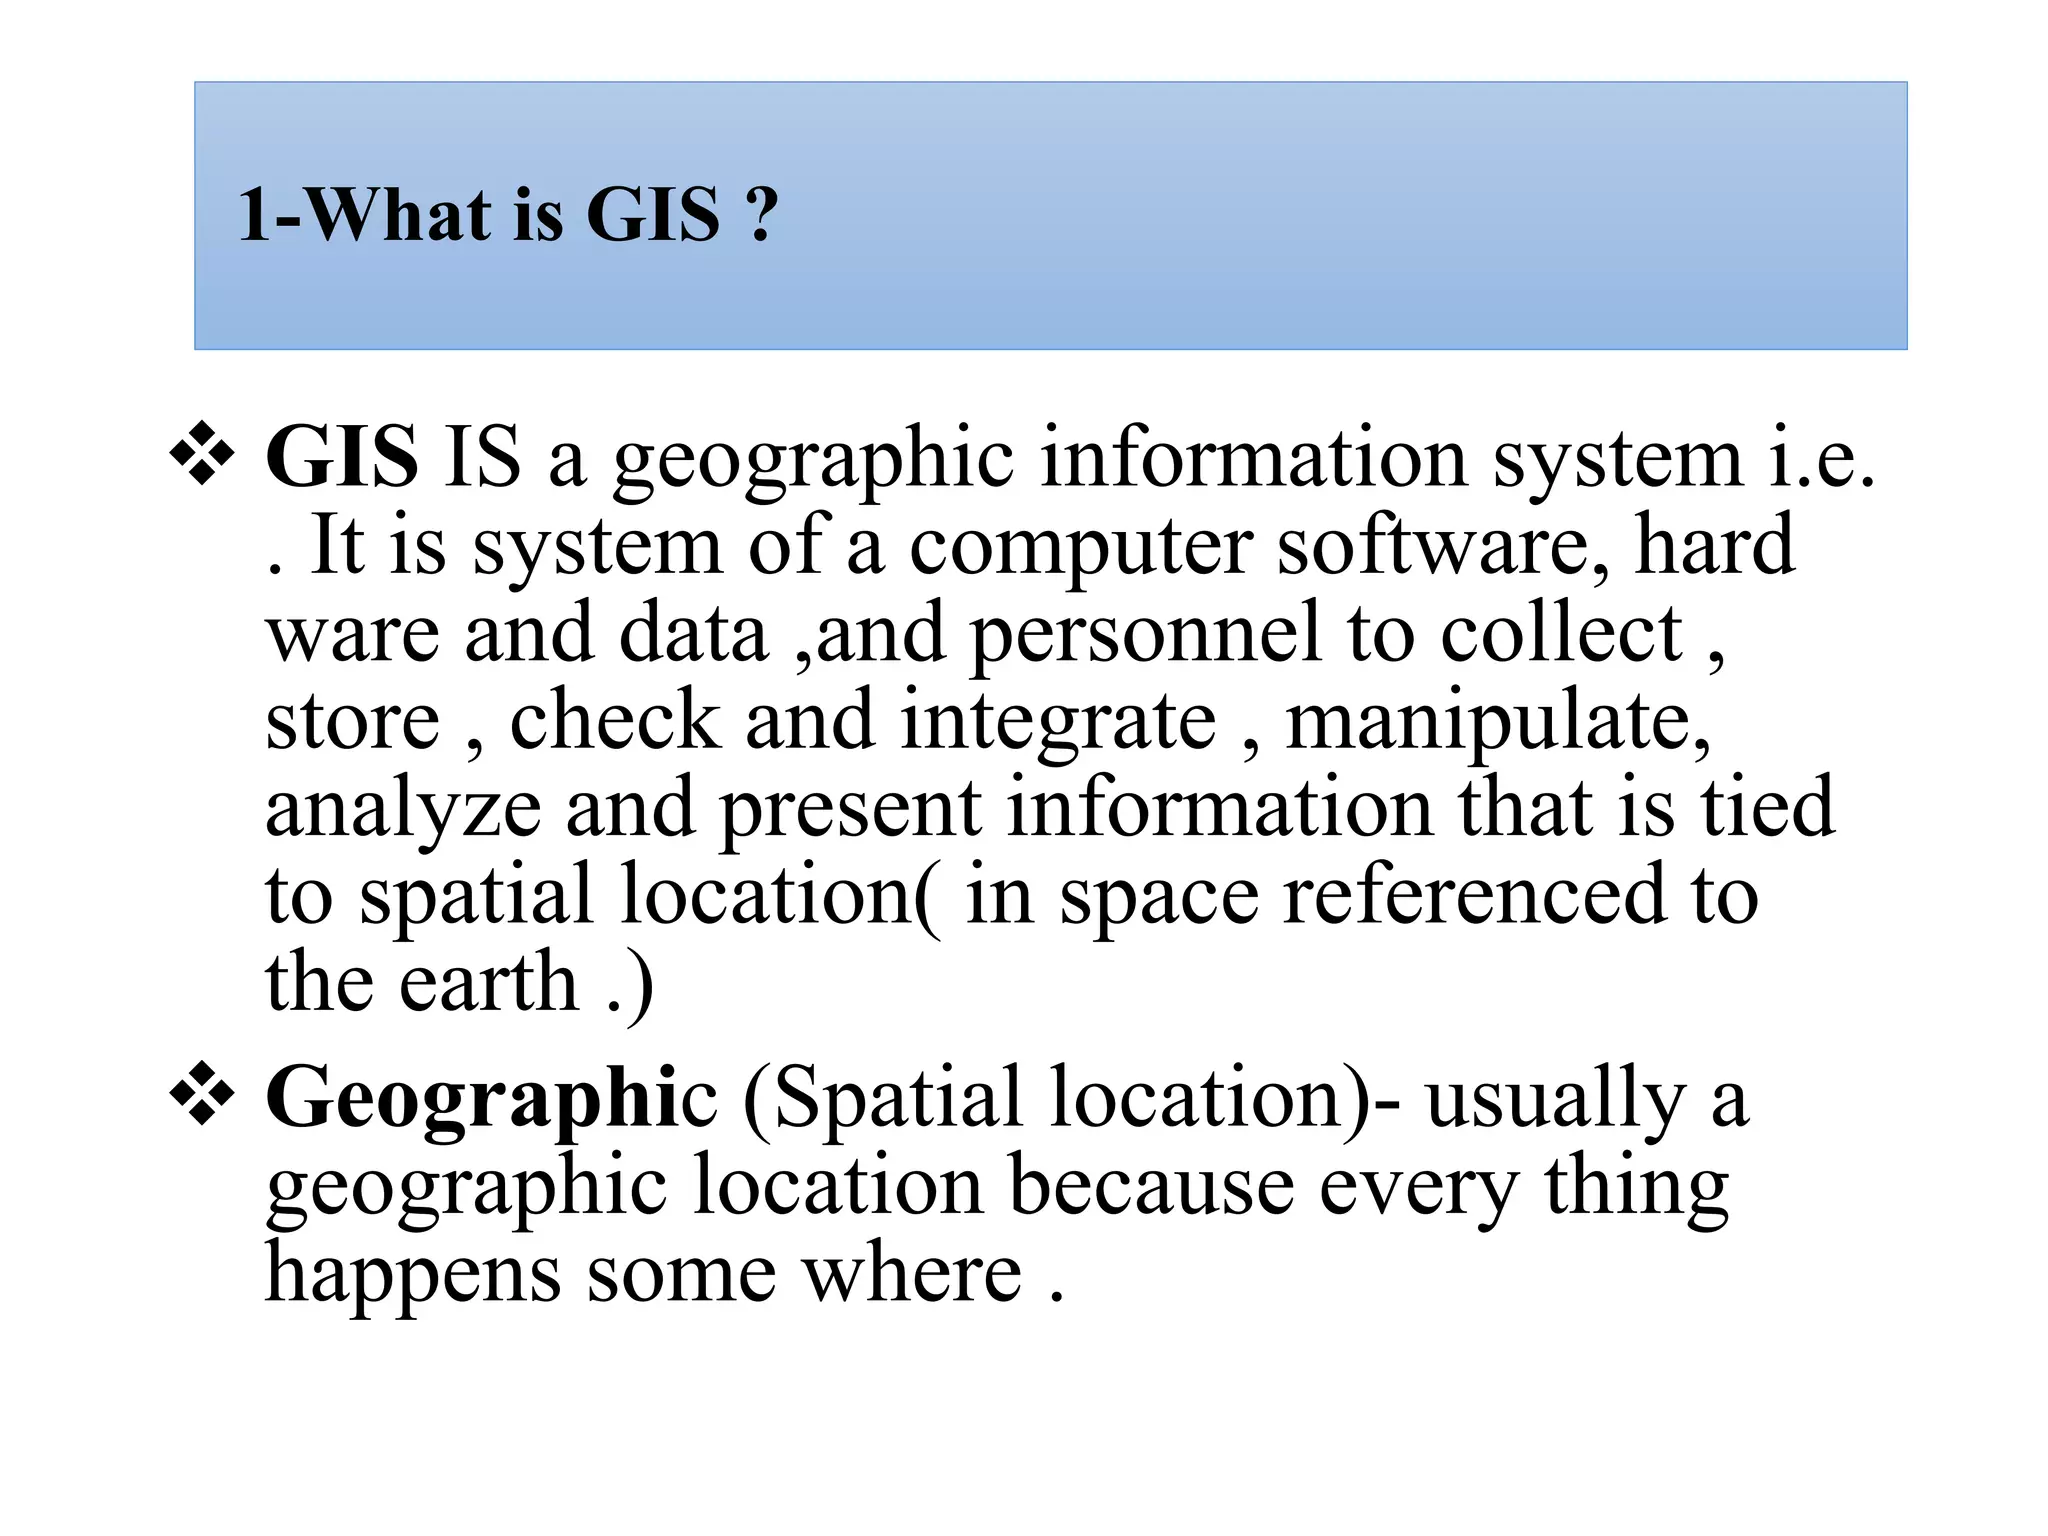
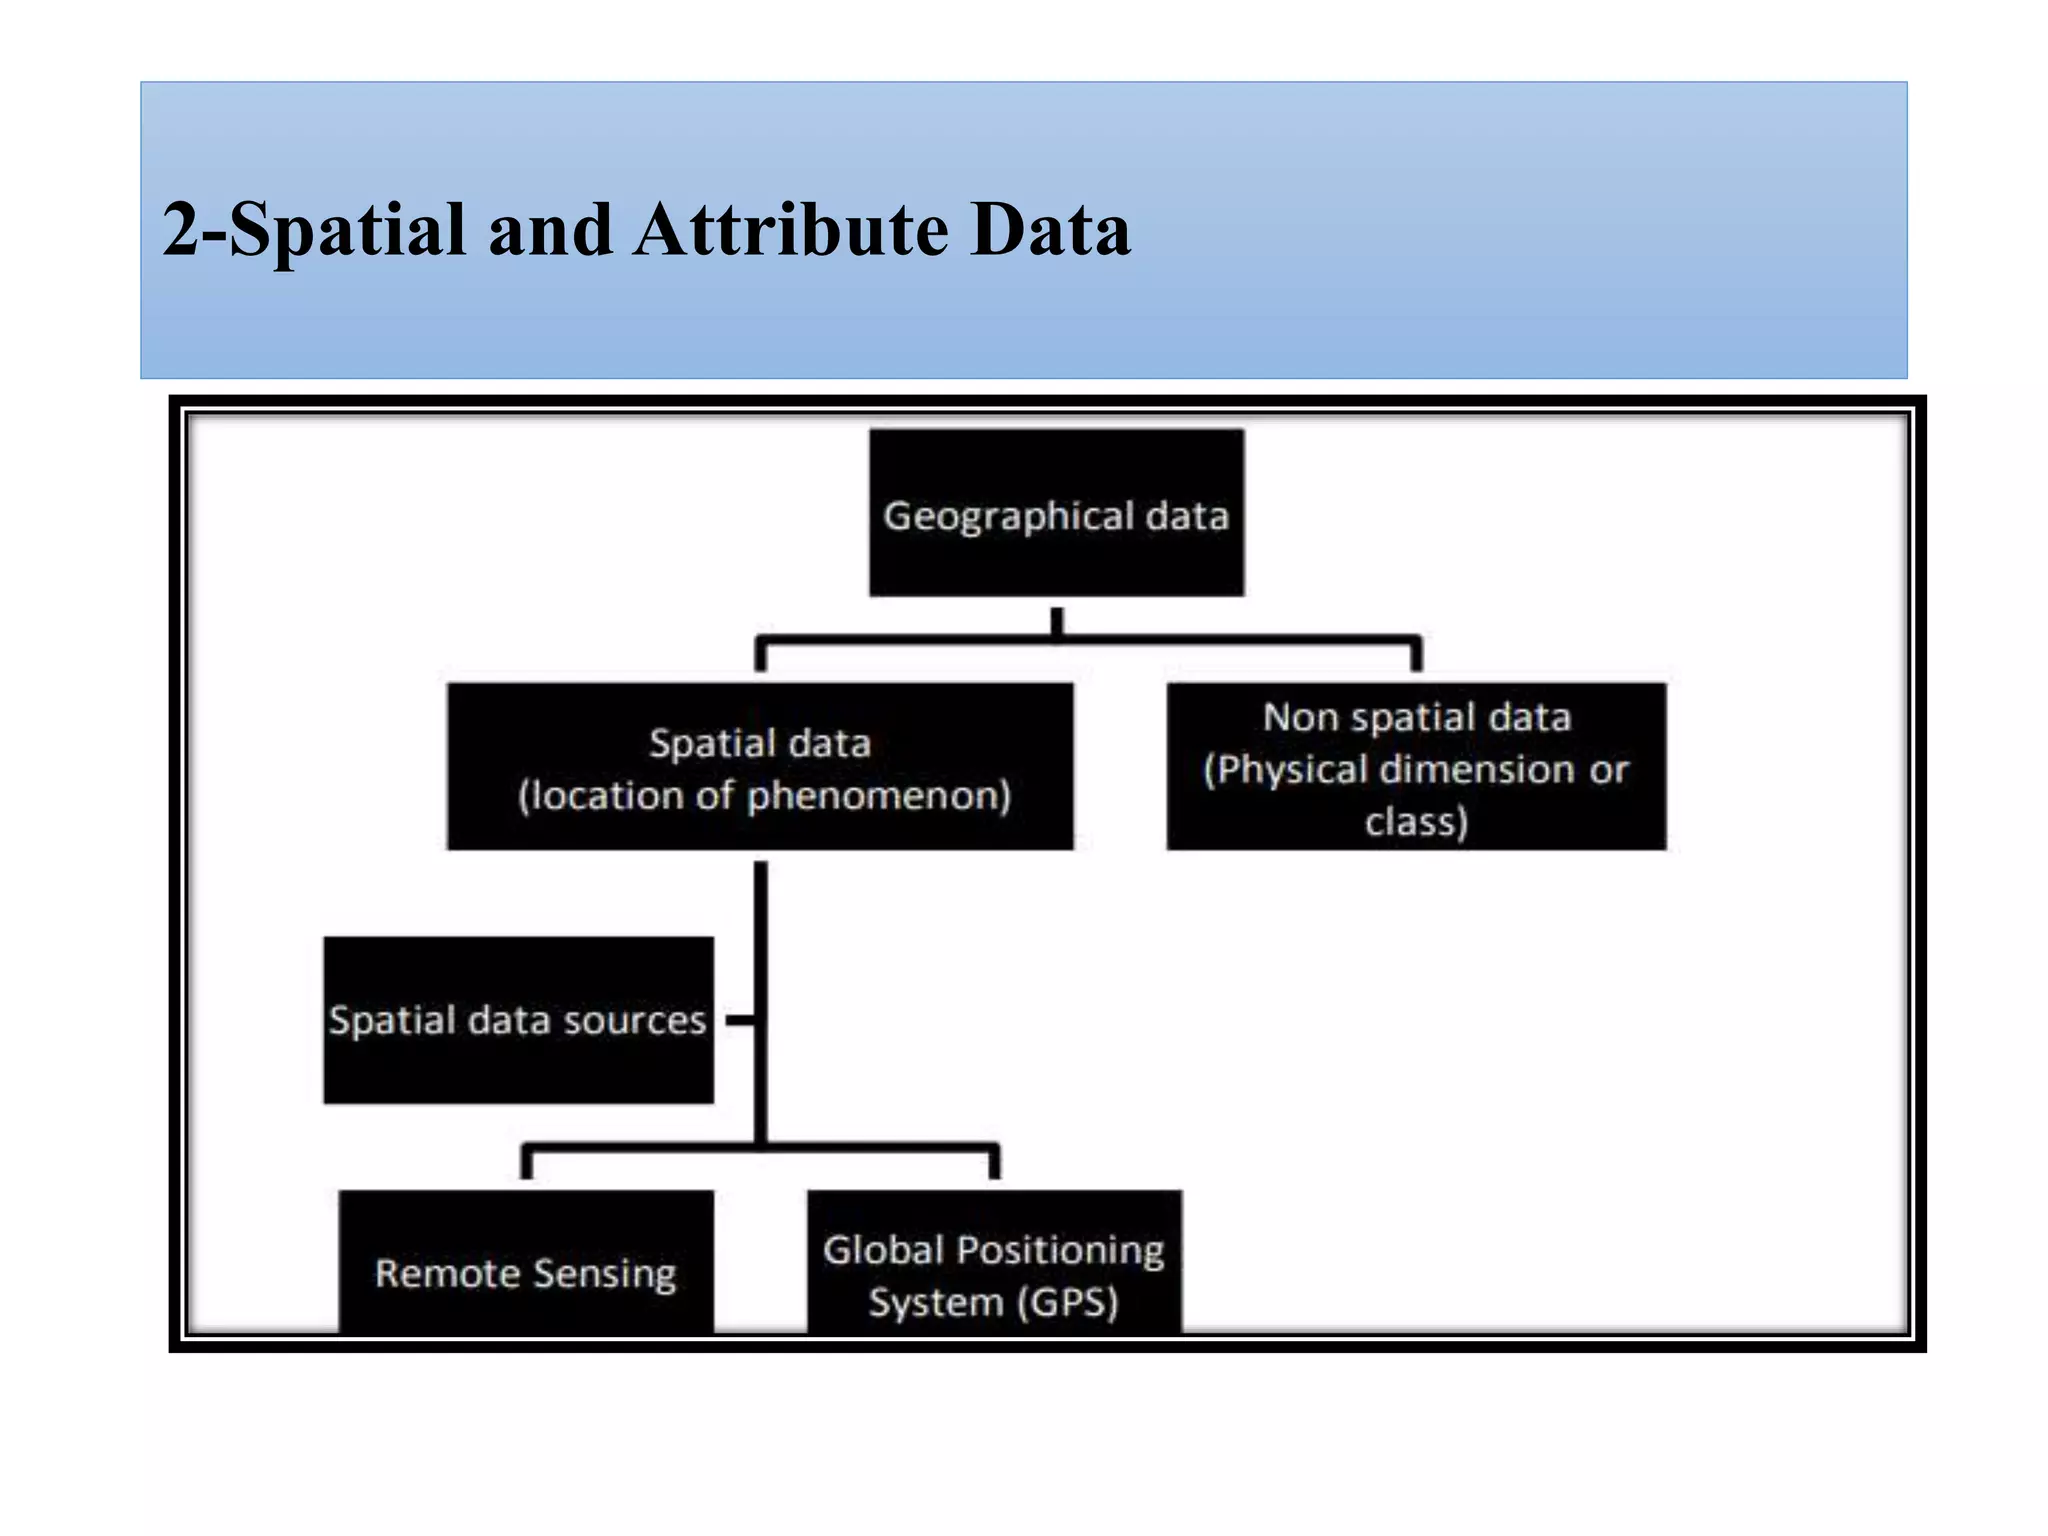
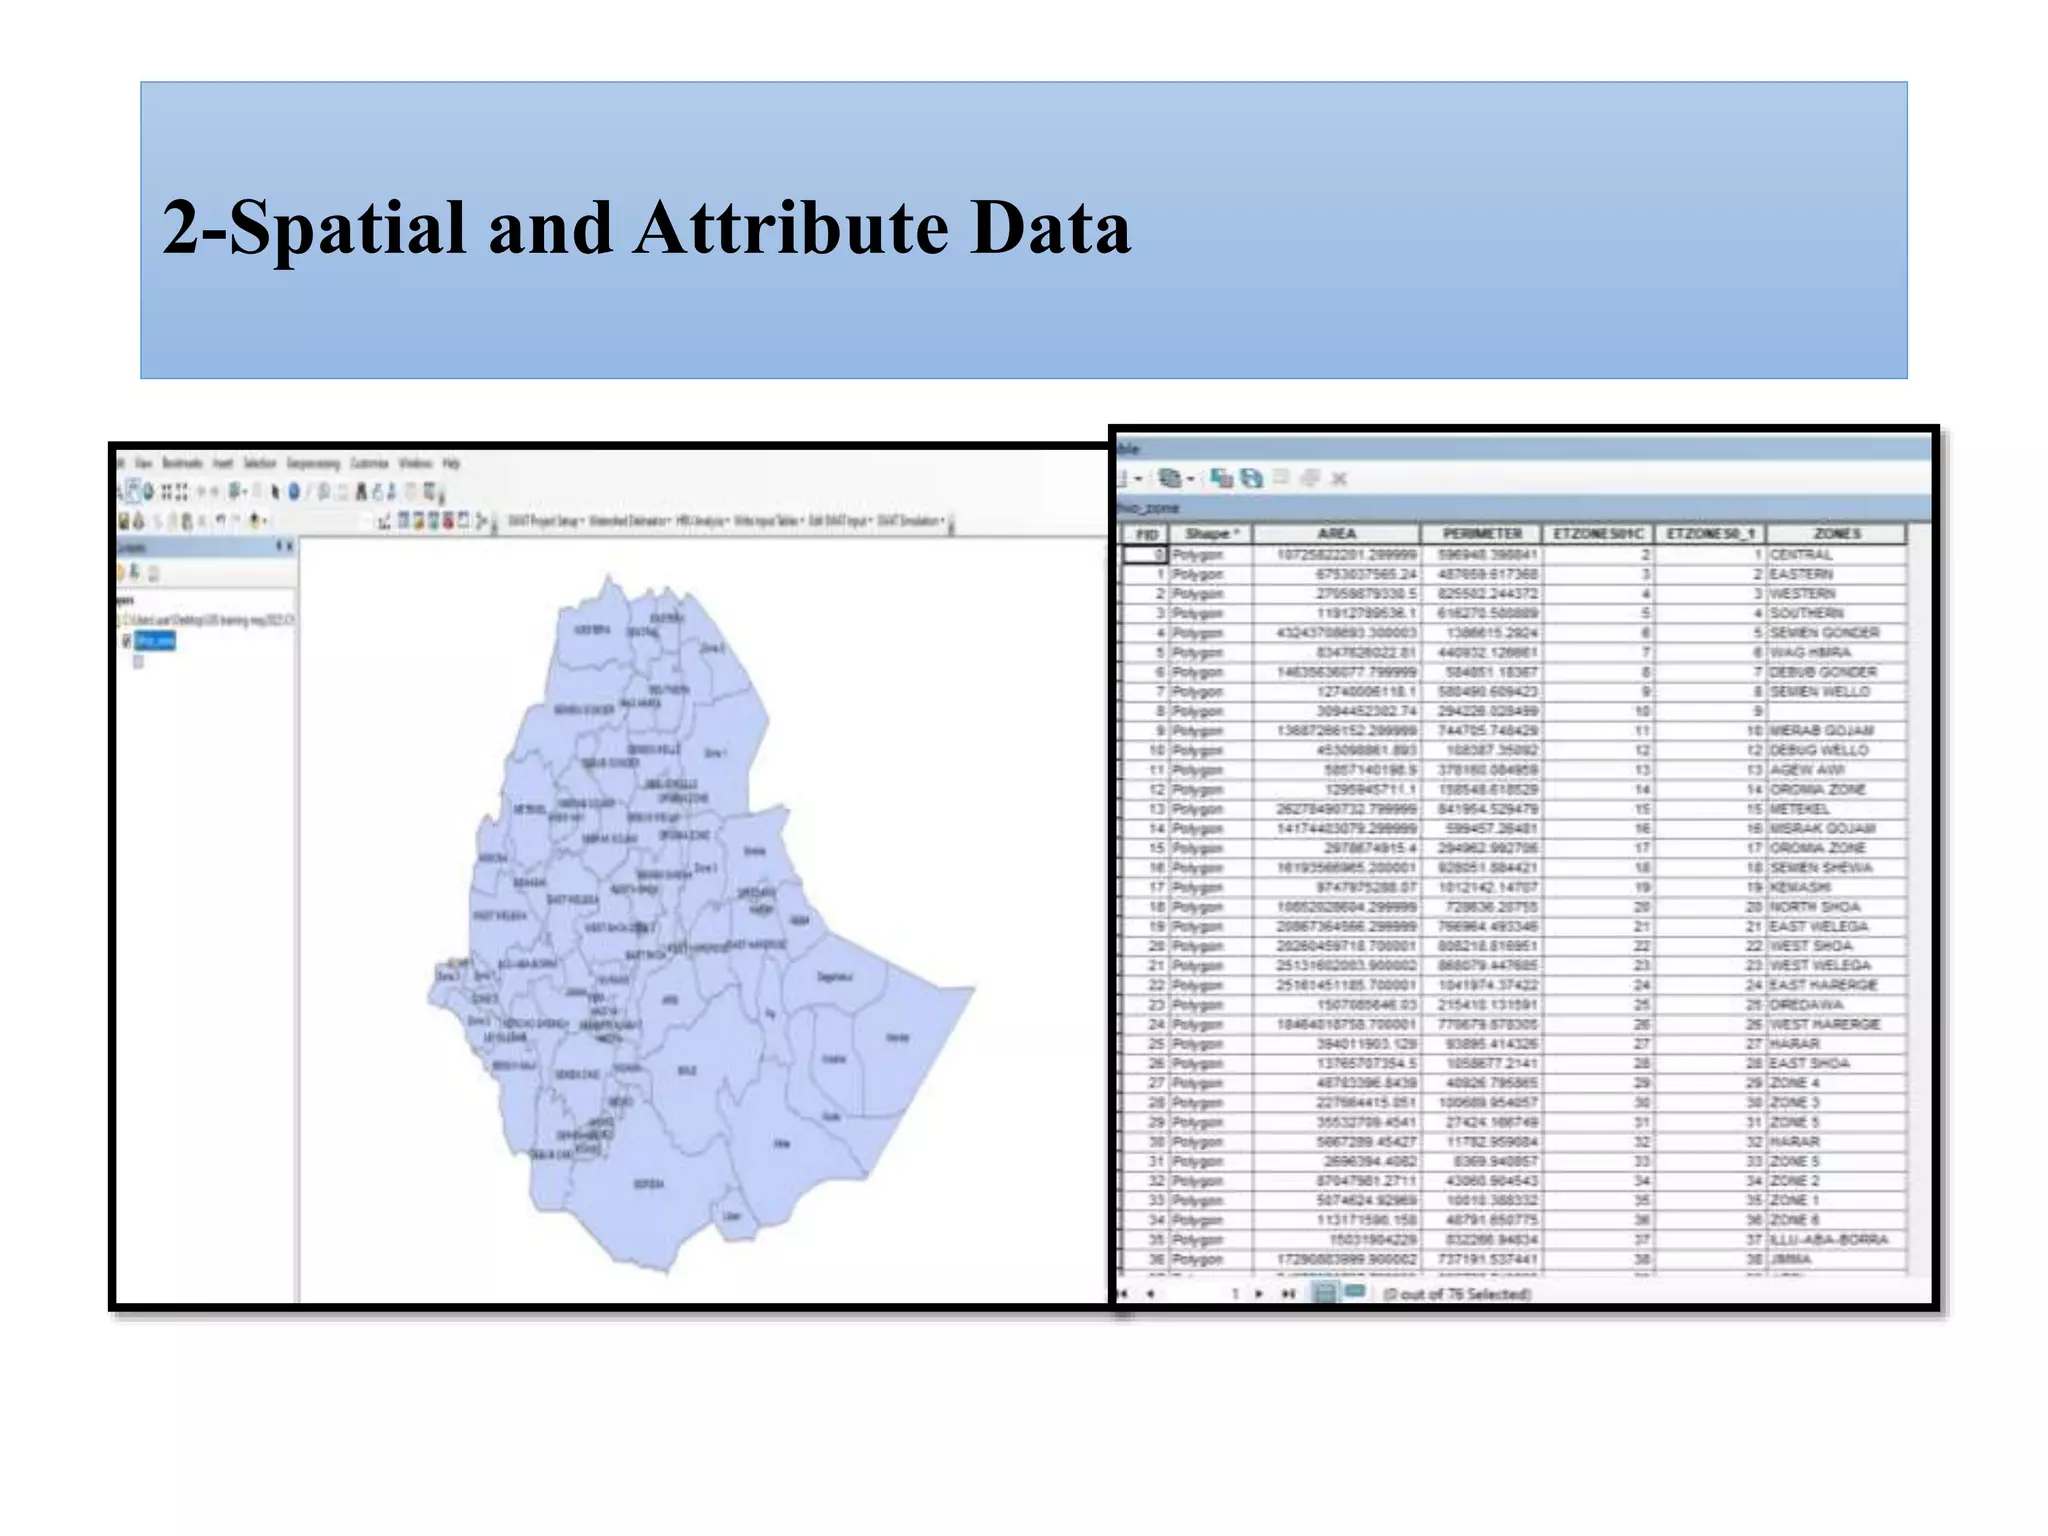
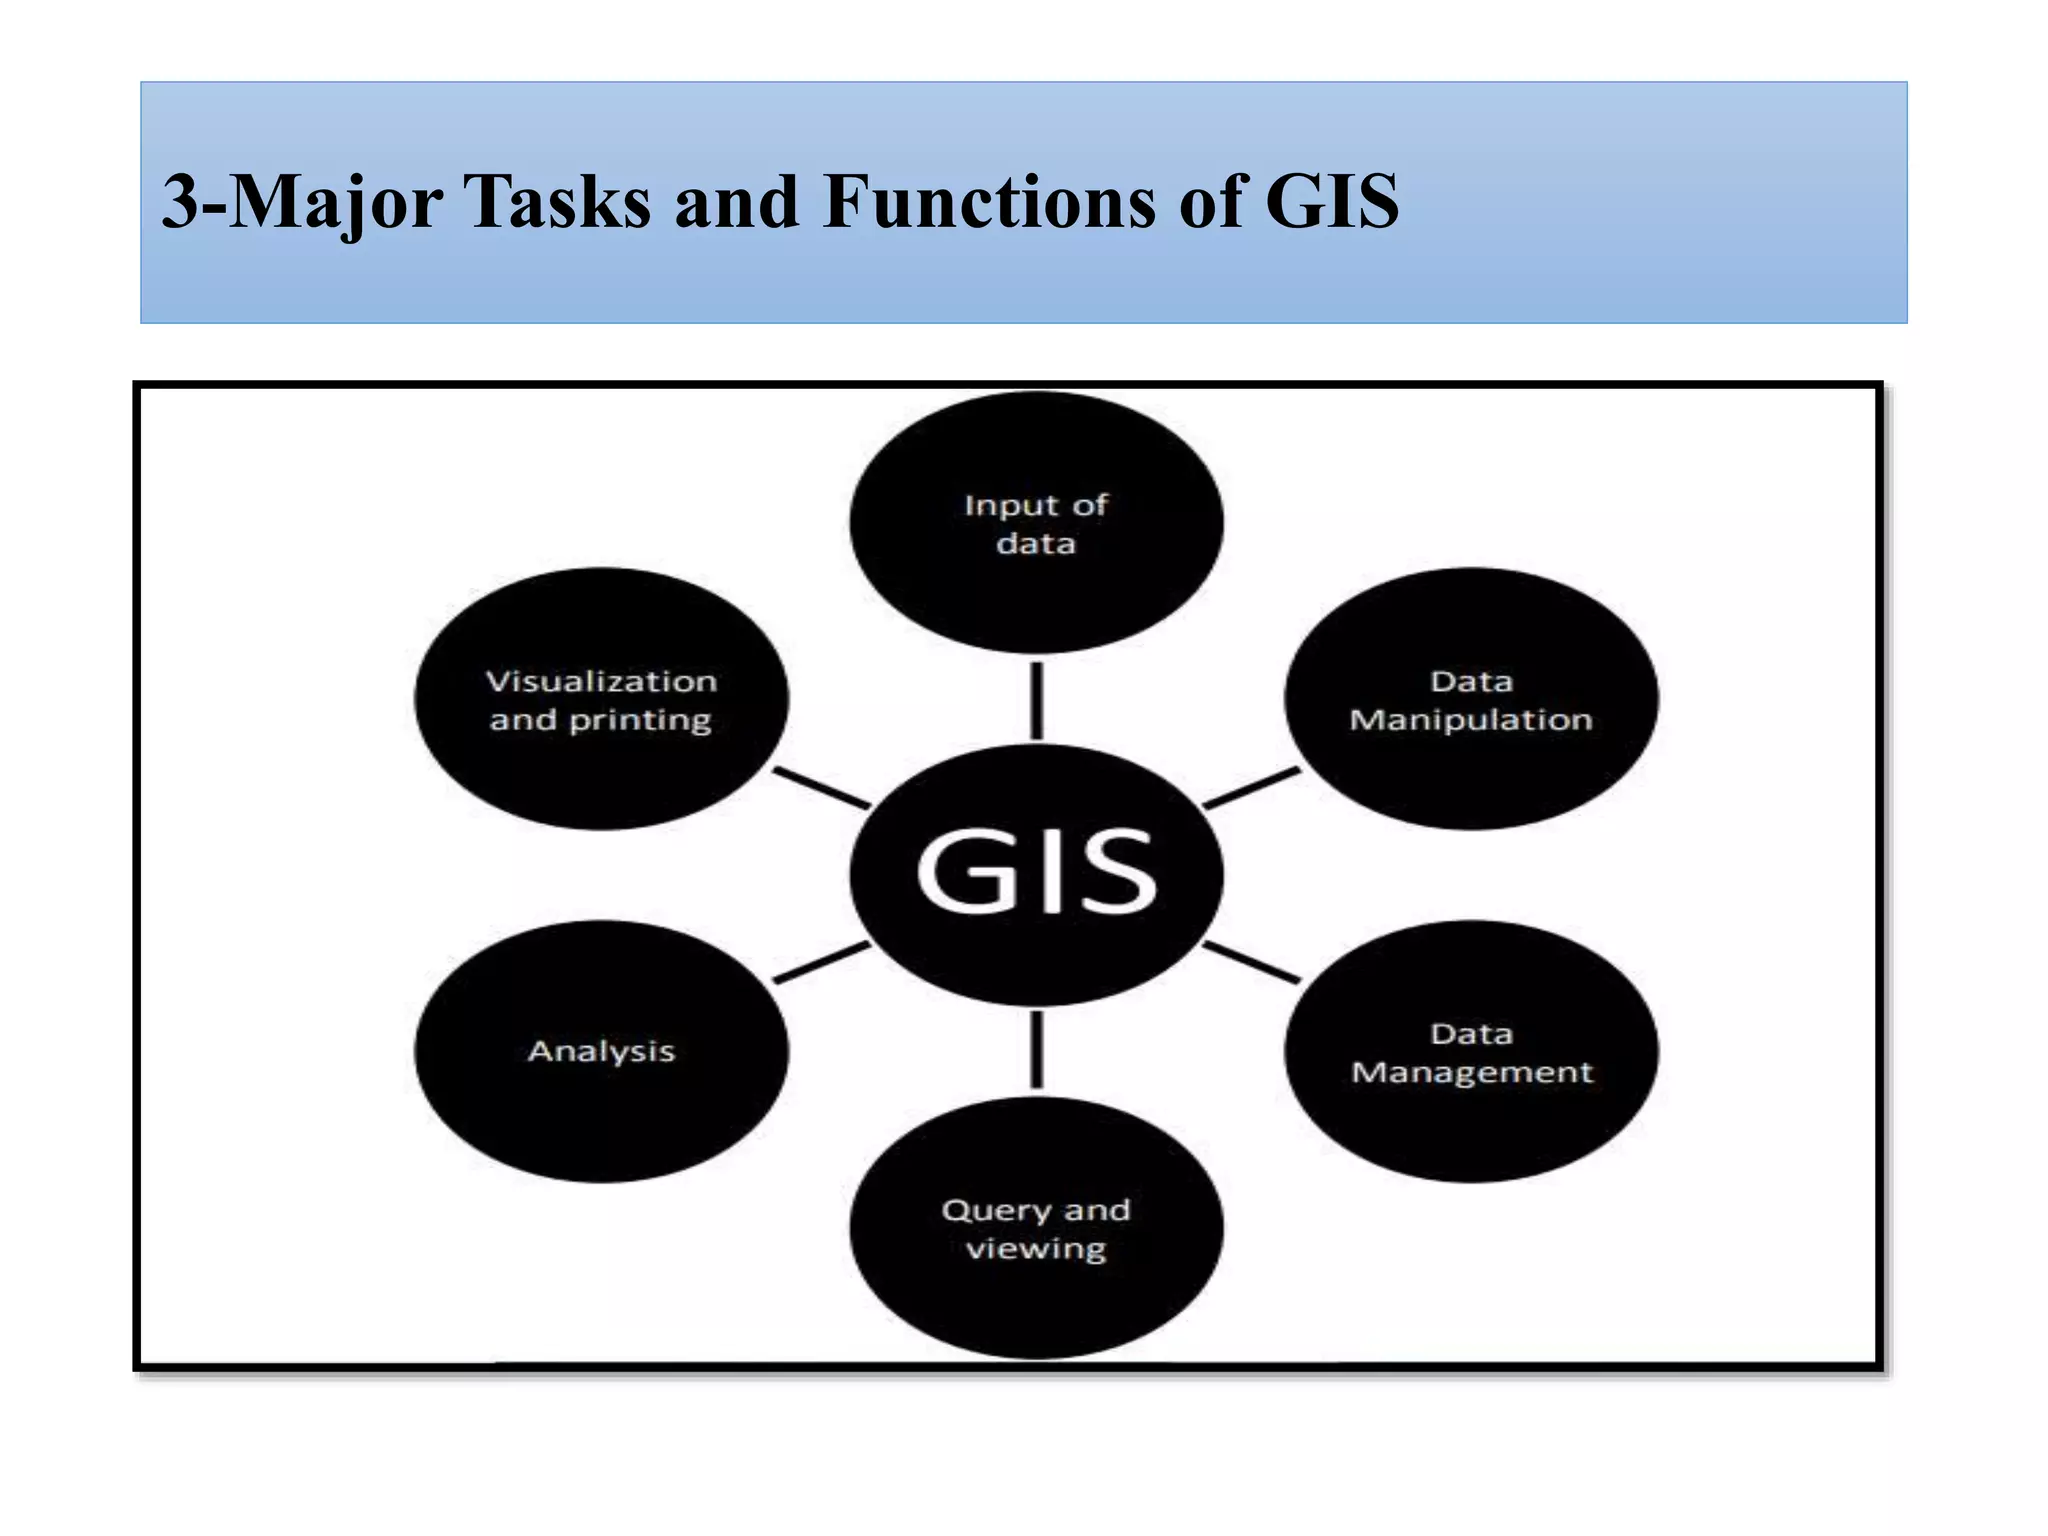
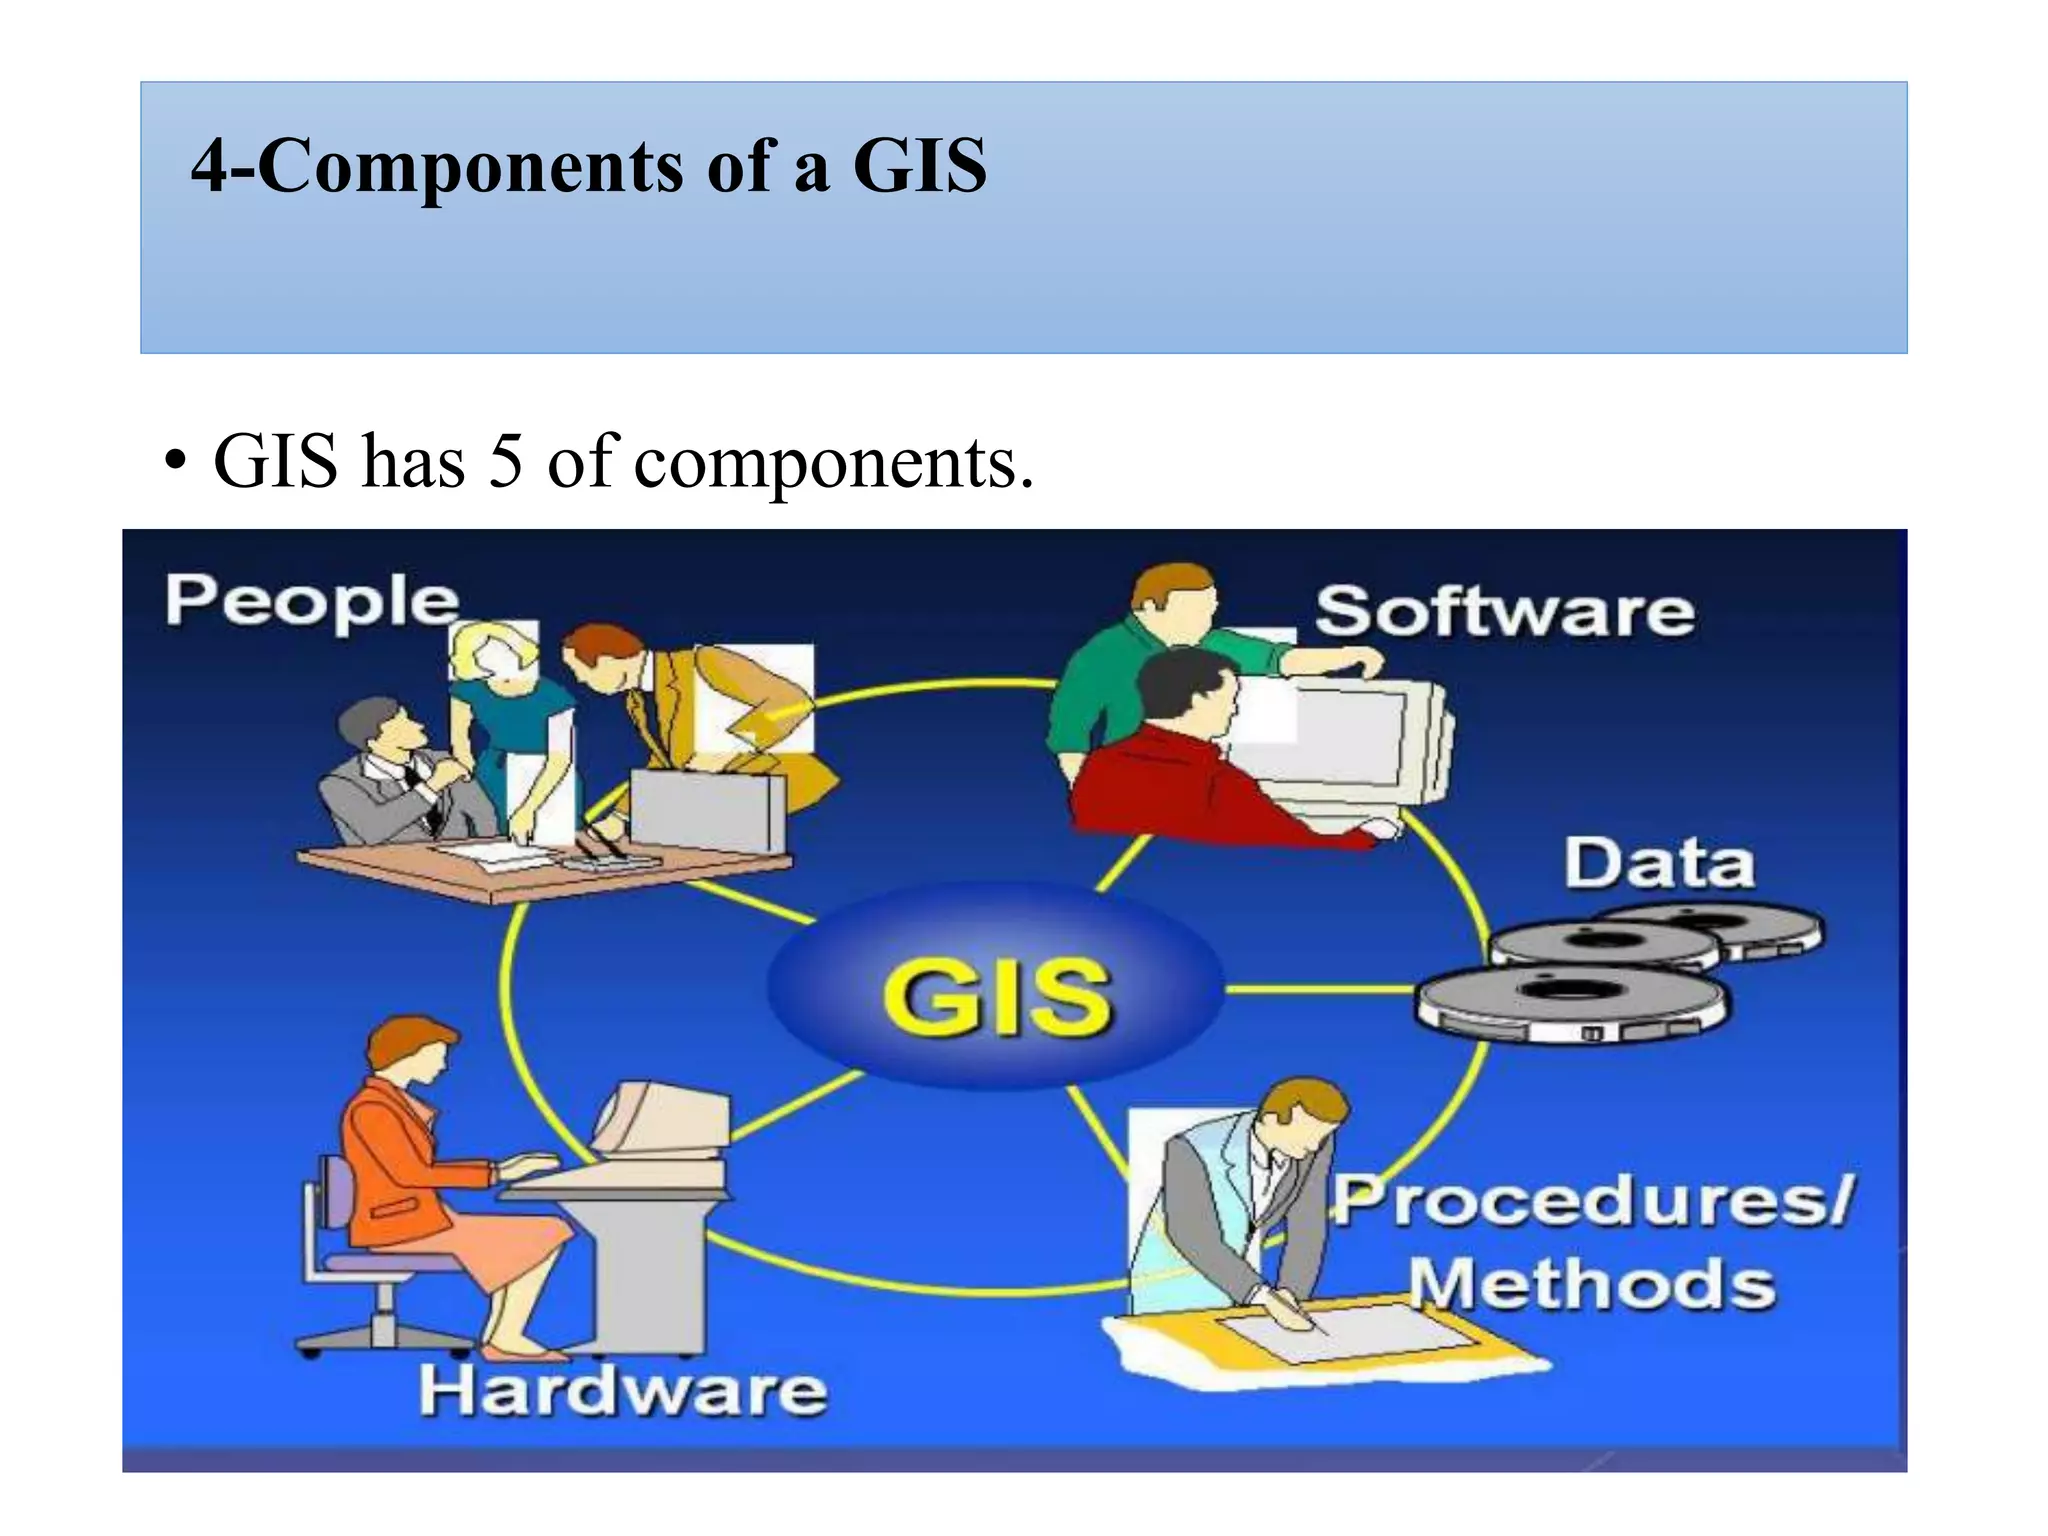
By: Abdilbasit Hamid
June 23,2022
INTRODUCTION TO GIS
Out line of presentation
Part -1
1-What is GIS
2-Spatial and Attribute Data
3-Major Tasks and Functions of GIS
4-Components of a GIS
5-Where Does GIS Data Come from ?
6- Benefits of Using GIS
7-why we study GIS ?
8- Geographic model in ARC GIS
9-The steps in a GIS project
10--Basic Components of ARC Map
11-ArcGIS Software Window
Platforms
ArcGIS Software Window
Platforms
• ArcGIS has three Windows
 1 Arc Catalog- Manage data base
 2. Arc Map-Analysis of data
 3. Arc Toolbox- Geo –processing tools
ArcGIS interface
Arc catalog interface
Arc catalog has two classes
1/catalog tree
2/Display area (content ,preview ,Description Meta
Data )
Part -1 (Practical exercise )
Implement Arc GIS software on ArcGIS
interface
• Installation of ARC GIS 10.7 ,
• Starting Arc Map and Arc catalog
• Arc Map interface
• Describing Arc catalog interface
• Adding data in Arc Map
• Connect and dis connect data in Arc catalog .
• Changing the order of the layers displayed on the map,
• Changing symbology . Labeling
Part -1 (Practical exercise )
1. How to import/export Survey excel data in to Arc GIS
environment
2. How to Convert into shape file of study area
3. Clip study area in to different zone,Woreda and Kebele
level and analysis and interoperate the Survey excel
data
4. How to digitize point/line and polygon feature from
base map
5. How to prepare lay out design map or study area
6. How to Extract study area dem
7. How to prepare slope and reclassified slope
8. Generate contour
Part -2 ( Practical Exercise )
9.How to prepare water supply system design map
10.How to prepare drainage density map
11.How to prepare Voronoi/Thiessen Diagram from
point Feature
12. How to prepare land use land cover map
1-What is GIS ?
 GIS IS a geographic information system i.e.
. It is system of a computer software, hard
ware and data ,and personnel to collect ,
store , check and integrate , manipulate,
analyze and present information that is tied
to spatial location( in space referenced to
the earth .)
 Geographic (Spatial location)- usually a
geographic location because every thing
happens some where .
Cont..
 information- visualization of analysis of data .
 System –linking software , hardware and data
 Personnel –thinking explorer who is a key to
power GIS .
 GIS is a data management (DBM) System that
enables to process spatial data related to attribute
data
2-Spatial and Attribute Data
3-Major Tasks and Functions of GIS
4-Components of a GIS
• GIS has 5 of components.
5-Where Does GIS Data Come from?
 Two types of data are input into a
• GIS, spatial and attribute data.
 The most common general sources for
• spatial data are:
 Hard copy maps;
 Aerial photographs;
 Remotely-sensed satellite imagery;
 Point data samples from surveys; and
 Existing digital data files
6-Benefits of Using GIS
 Typical Benefits of Using Automation
• (Cost Savings)
 Better Data Management (More
• Efficient Storage and Updating)
 Faster Information Access (Better
• Decisions)
 Operational Efficiencies
 New Applications
6-Why we study GIS?
 To apply for government plan
 natural resource management;
 highways and transportation;
 Urban Planning, Management & Policy
 Land acquisition and management
 Economic development
 Emergency response and Crime analysis
 Tax assessment
Cont…
 Scientific research application
 Geography, geology, hydrology, botany
 Anthropology, sociology, economics,
 political science
 Epidemiology,
 Criminology The relation ship Between GIS and
Other Discipline
Water Resources Management
 Water quality and quantity monitoring;
 Aquifers Characterizations
 Surface and Groundwater modeling and
• contamination tracking;
 Rainfall estimation;
 Surface runoff prediction;
 Identifying Ground water potential zone
 Sediment yield production;
 Watershed planning and Management;
7-Geographic model in ARC GIS
 The three basic data model that arc
GIS uses are
 Vector
 Raster
Data model s -vectors
 Vector data: is characterized by the use of
sequential points or vertices to define a linear
segment.
 Each vertex consists of X-coordinate and Y
coordinate.
Cont…
• These are
 Points, Lines, Polygon
Examples of vector data
Point Data Line data Polygon data
Borehole Rivers, Forest stands
A weather station Roads, Soil classification
areas
An oil well or gas
activity site
Pipelines, etc Administrative
boundaries,
Town PPcarcel
Information
Afire lookout
tower,
Raster data structure
 Matrix of square cells represents a
patch of ground o Each cell is a
unit of area within the patch
 Each cell stores a number
 Numbers may be measurements,
counts, or codes
 Geography is represented with
cells
 Good for continuous phenomena
 Elevation, rainfall, temperature
 Air photos
 Vegetation, soil type
Cont.…
Comparison Between Vector and raster
The relation ship between Cell size and Resolution
9-The steps in a GIS project
 Step 1: Identify your problem and objectives
 The first step of the process is to identify the
problem and objective of the analysis.
 What is the problem to solve?
 How is it solved now?
 Are there alternate ways to solve it using a GIS?
Step 2: Create a project database
 The second step is to create a project
• database.
 Creating the project database is a
• three-step process.
 The steps are:
 designing the database,
 automating and gathering data for the database,
and managing the database
Step 3: Analyze the data
Analyzing data in a GIS ranges from simple
mapping to creating complex spatial models.
• These functions are:
Geometric modeling functions
 Calculating distances,
 generating buffers, and clipping .
Generating Contour
Reclassified slope
calculating areas and perimeters
Step 4: Present the results
 The fourth step is to present the results of
• your analysis.
 Your final product should effectively
• communicate your findings to your audience.
 In most cases, the results of a GIS analysis
can best be shown on a map.
 Charts and reports of selected data are two
other ways of presenting your results
10-Basic Components of A Map
• The data
frame
• Legend
• North Arrow
• Title
• Scale
• Grid:
• Projection
• Date
THANK YOU!!!

GIS Presentation.pptx

  • 1.
    By: Abdilbasit Hamid June23,2022 INTRODUCTION TO GIS
  • 2.
    Out line ofpresentation Part -1 1-What is GIS 2-Spatial and Attribute Data 3-Major Tasks and Functions of GIS 4-Components of a GIS 5-Where Does GIS Data Come from ? 6- Benefits of Using GIS 7-why we study GIS ? 8- Geographic model in ARC GIS 9-The steps in a GIS project 10--Basic Components of ARC Map 11-ArcGIS Software Window Platforms
  • 3.
    ArcGIS Software Window Platforms •ArcGIS has three Windows  1 Arc Catalog- Manage data base  2. Arc Map-Analysis of data  3. Arc Toolbox- Geo –processing tools
  • 4.
  • 5.
    Arc catalog interface Arccatalog has two classes 1/catalog tree 2/Display area (content ,preview ,Description Meta Data )
  • 6.
    Part -1 (Practicalexercise ) Implement Arc GIS software on ArcGIS interface • Installation of ARC GIS 10.7 , • Starting Arc Map and Arc catalog • Arc Map interface • Describing Arc catalog interface • Adding data in Arc Map • Connect and dis connect data in Arc catalog . • Changing the order of the layers displayed on the map, • Changing symbology . Labeling
  • 7.
    Part -1 (Practicalexercise ) 1. How to import/export Survey excel data in to Arc GIS environment 2. How to Convert into shape file of study area 3. Clip study area in to different zone,Woreda and Kebele level and analysis and interoperate the Survey excel data 4. How to digitize point/line and polygon feature from base map 5. How to prepare lay out design map or study area 6. How to Extract study area dem 7. How to prepare slope and reclassified slope 8. Generate contour
  • 8.
    Part -2 (Practical Exercise ) 9.How to prepare water supply system design map 10.How to prepare drainage density map 11.How to prepare Voronoi/Thiessen Diagram from point Feature 12. How to prepare land use land cover map
  • 9.
    1-What is GIS?  GIS IS a geographic information system i.e. . It is system of a computer software, hard ware and data ,and personnel to collect , store , check and integrate , manipulate, analyze and present information that is tied to spatial location( in space referenced to the earth .)  Geographic (Spatial location)- usually a geographic location because every thing happens some where .
  • 10.
    Cont..  information- visualizationof analysis of data .  System –linking software , hardware and data  Personnel –thinking explorer who is a key to power GIS .  GIS is a data management (DBM) System that enables to process spatial data related to attribute data
  • 11.
  • 12.
  • 13.
    3-Major Tasks andFunctions of GIS
  • 14.
    4-Components of aGIS • GIS has 5 of components.
  • 15.
    5-Where Does GISData Come from?  Two types of data are input into a • GIS, spatial and attribute data.  The most common general sources for • spatial data are:  Hard copy maps;  Aerial photographs;  Remotely-sensed satellite imagery;  Point data samples from surveys; and  Existing digital data files
  • 16.
    6-Benefits of UsingGIS  Typical Benefits of Using Automation • (Cost Savings)  Better Data Management (More • Efficient Storage and Updating)  Faster Information Access (Better • Decisions)  Operational Efficiencies  New Applications
  • 17.
    6-Why we studyGIS?  To apply for government plan  natural resource management;  highways and transportation;  Urban Planning, Management & Policy  Land acquisition and management  Economic development  Emergency response and Crime analysis  Tax assessment
  • 18.
    Cont…  Scientific researchapplication  Geography, geology, hydrology, botany  Anthropology, sociology, economics,  political science  Epidemiology,  Criminology The relation ship Between GIS and Other Discipline
  • 19.
    Water Resources Management Water quality and quantity monitoring;  Aquifers Characterizations  Surface and Groundwater modeling and • contamination tracking;  Rainfall estimation;  Surface runoff prediction;  Identifying Ground water potential zone  Sediment yield production;  Watershed planning and Management;
  • 20.
    7-Geographic model inARC GIS  The three basic data model that arc GIS uses are  Vector  Raster Data model s -vectors  Vector data: is characterized by the use of sequential points or vertices to define a linear segment.  Each vertex consists of X-coordinate and Y coordinate.
  • 21.
    Cont… • These are Points, Lines, Polygon
  • 22.
    Examples of vectordata Point Data Line data Polygon data Borehole Rivers, Forest stands A weather station Roads, Soil classification areas An oil well or gas activity site Pipelines, etc Administrative boundaries, Town PPcarcel Information Afire lookout tower,
  • 23.
    Raster data structure Matrix of square cells represents a patch of ground o Each cell is a unit of area within the patch  Each cell stores a number  Numbers may be measurements, counts, or codes  Geography is represented with cells  Good for continuous phenomena  Elevation, rainfall, temperature  Air photos  Vegetation, soil type
  • 24.
  • 25.
  • 26.
    The relation shipbetween Cell size and Resolution
  • 27.
    9-The steps ina GIS project  Step 1: Identify your problem and objectives  The first step of the process is to identify the problem and objective of the analysis.  What is the problem to solve?  How is it solved now?  Are there alternate ways to solve it using a GIS?
  • 28.
    Step 2: Createa project database  The second step is to create a project • database.  Creating the project database is a • three-step process.  The steps are:  designing the database,  automating and gathering data for the database, and managing the database
  • 29.
    Step 3: Analyzethe data Analyzing data in a GIS ranges from simple mapping to creating complex spatial models. • These functions are: Geometric modeling functions  Calculating distances,  generating buffers, and clipping . Generating Contour Reclassified slope calculating areas and perimeters
  • 30.
    Step 4: Presentthe results  The fourth step is to present the results of • your analysis.  Your final product should effectively • communicate your findings to your audience.  In most cases, the results of a GIS analysis can best be shown on a map.  Charts and reports of selected data are two other ways of presenting your results
  • 31.
    10-Basic Components ofA Map • The data frame • Legend • North Arrow • Title • Scale • Grid: • Projection • Date
  • 32.