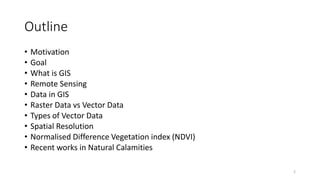
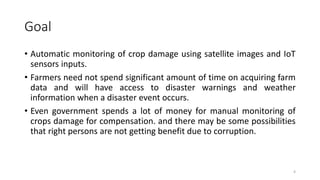
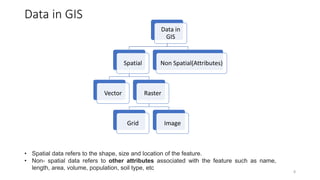
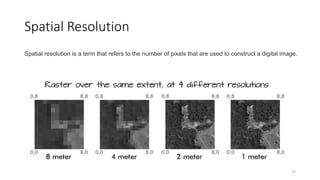
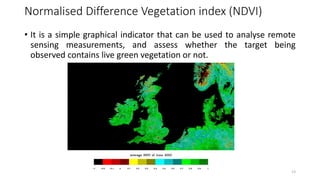
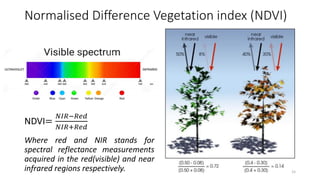
The document presents an overview of Geographic Information Systems (GIS) and its applications in agriculture, particularly in monitoring crop damage due to natural calamities using satellite images and IoT sensors. It outlines the importance of agriculture in India and highlights recent research utilizing NDVI and satellite data for assessing hail damage and flood risks. The document emphasizes the shift from manual monitoring to automated systems for better efficiency and accuracy in agriculture.
![Motivation
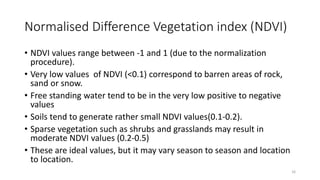
• According to the FAO(Food and Agriculture Organization of the United Nations),
agriculture is the largest source of livelihoods in India. 70 percent of its rural
households still depend primarily on agriculture for their livelihood[6].
• The agriculture sector is one of the most important industries in the Indian
economy, which means it is also a huge employer.
• Approximately 60 percent of the Indian population works in this industry,
contributing about 18 percent to India's GDP [5].
• CMIE(Centre for Monitoring Indian Economy) data from the consumer pyramid
household survey shows the share of agriculture in total employment has gone
up from 35.3% in 2017-18 to 36.1% in 2018-19 and then to 38% in 2019-20.
• Currently most of the monitoring of crops damage due to natural calamities are
manual. If modern agriculture is applied widely in the near future, millions of
farmers will be able to benefit from the acquisition of real-time farm information.3](https://image.slidesharecdn.com/rahulseminar1forslideshare-220228160508/85/Rahul-seminar1-for_slideshare-3-320.jpg)
![Recent works in hailstone
• Title: Evaluation of Approaches to Identifying Hail Damage to
Crop Vegetation Using Satellite Imagery [1]
• examines an automated approach to detecting areas of hail damage in
satellite imagery and Remove the manual examination of normalized
difference vegetation index (NDVI)
• Two techniques are evaluated:
• (i) use of an NDVI change threshold and
• (ii) detection of anomalies that occur in both daily NDVI and land
surface temperature imagery.
• The NDVI threshold performed well in the two August case studies
with a final probability of detection (POD) ranging from 0.497 to 0.647,
whereas the anomaly detection for these two case studies had a lower
POD of 0.317 to 0.587.
19](https://image.slidesharecdn.com/rahulseminar1forslideshare-220228160508/85/Rahul-seminar1-for_slideshare-19-320.jpg)
![Recent works in hailstone
• Title: Mapping hailstorm damaged crop area using multispectral
satellite data [2]
• Using NDVI difference of pre and post-hailstorm events.
• Crop classification within hail streak was performed using a high resolution
LISSIV satellite data from IRS-Resourcesat-2.
• Changes in NDVI profile of different crops in the study area was recorded, and a
model was developed for estimating changes in NDVI due to hail damage.
• Inputs from remote sensing platforms in the event of weather extremes will not
only help in improving yield loss estimations, but also aid settlement of claims for
crop insurance.
• Data Source: LISSIV satellite data from IRS-Resourcesat-2
20](https://image.slidesharecdn.com/rahulseminar1forslideshare-220228160508/85/Rahul-seminar1-for_slideshare-20-320.jpg)
![Recent works in hailstone
• Title: GIS-based multicriteria approach for flood risk assessment
in Sigus city, east Algeria[3].
• The proposed methodology is based on the combination of geographical
information systems (GIS) and the analytical hierarchy process (AHP).
• The results show that the major part of the city is located in low-risk zones,
which are far from the main stream.
• Using ArcGIS software, the criteria weights were transformed into maps
and overlaid to produce a final map which is scaled by 05 levels of flood
vulnerability.
• Data source: large data for Sigus city, east Algeria were collected.
21](https://image.slidesharecdn.com/rahulseminar1forslideshare-220228160508/85/Rahul-seminar1-for_slideshare-21-320.jpg)
![Recent works in hailstone
• Title: Flood disaster risk assessment based on random forest
algorithm[4]
• used ArcGIS10.1 to analyze and integrate each hazard factor into the flood
disaster report index model.
• random forest algorithm is used as the weight of each parameter of the flood
disaster index model.
• In the experimental part, this research uses layer overlay to determine the
number and types of affected areas.
• The research results show that the combination of random forest algorithm and
GIS technology is convenient for analyzing the spatial pattern and internal laws of
flood risk, and has good applicability
• Data Source: Remote sensing data mainly includes land use data, which is
obtained by unsupervised classification and interpretation of Landsat remote
sensing images in 2000 using EDRAS software
22](https://image.slidesharecdn.com/rahulseminar1forslideshare-220228160508/85/Rahul-seminar1-for_slideshare-22-320.jpg)
![References
• [1] Bell, J. R., and A. L. Molthan, 2016: Evaluation of approaches to identifying hail damage to crop
vegetation using satellite imagery. J. Operational Meteor., 4 (11), 142 159
• [2] Mathyam Prabhakar, K.A. Gopinath , A.G.K. Reddy , M. Thirupathi , Ch. Srinivasa Rao, 2019:
“Mapping hailstorm damaged crop area using multispectral satellite data”, The Egyptian Journal of
Remote Sensing and Space Sciences.
• [3] Wail Faregh & Abdelkader Benkhaled, 2021:“GIS-based multicriteria approach for flood risk
assessment in Sigus city, east Algeria”, Arabian Journal of Geosciences.
• [4] Zijiang Zhu, Yu Zhang, 2021: “Flood disaster risk assessment based on random forest
algorithm”, Neural Computing and Applications.
• [5] https://www.statista.com/topics/4868/agricultural-sector-in-india/
• [6] https://www.fao.org/india/fao-in-india/india-at-a-glance/en/
23](https://image.slidesharecdn.com/rahulseminar1forslideshare-220228160508/85/Rahul-seminar1-for_slideshare-23-320.jpg)