Downloaded 169 times
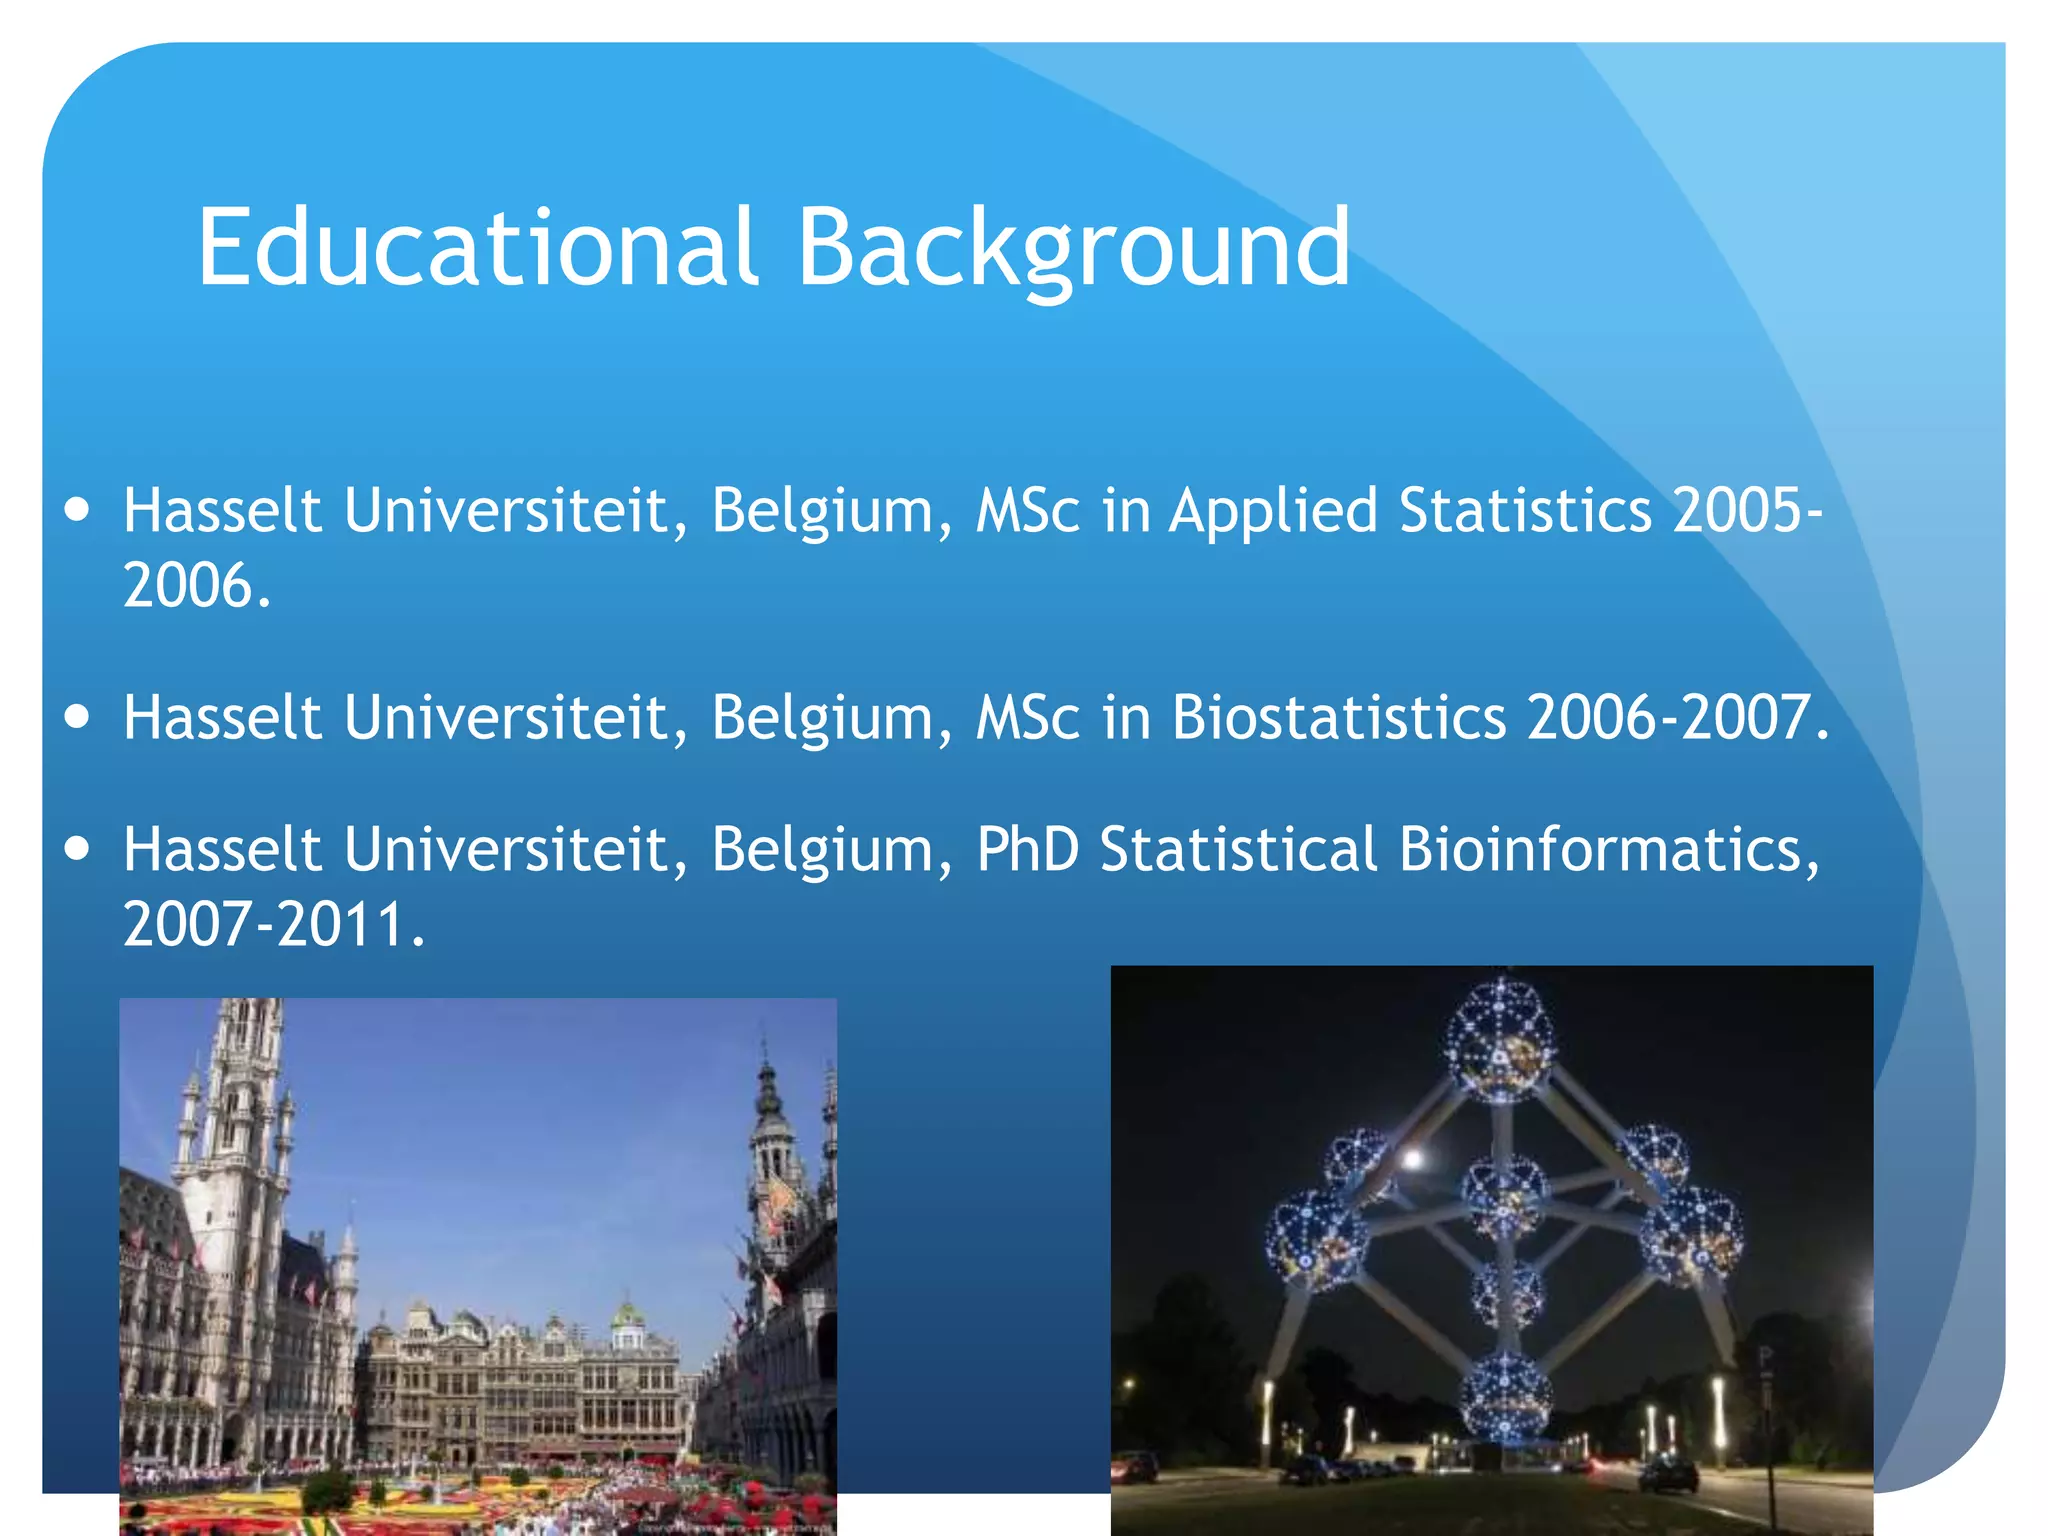


This document provides information on Setia Pramana's educational background and research interests. It discusses his degrees in applied statistics, biostatistics, and statistical bioinformatics from Hasselt University in Belgium. It also mentions his postdoctoral research at the Karolinska Institutet in Sweden. The document outlines Pramana's current research focusing on statistical methods for analyzing next generation sequencing and other high-throughput genomic data. It provides an overview of quantitative and qualitative research methodologies.