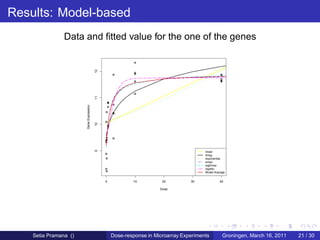
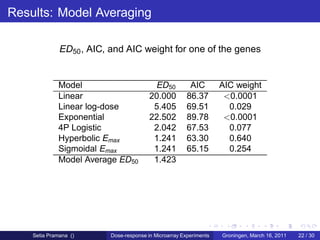
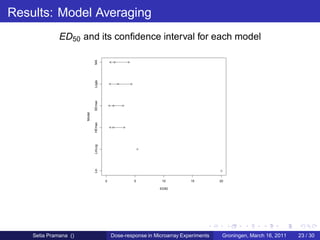
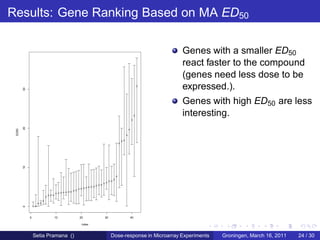
Download as PDF, PPTX
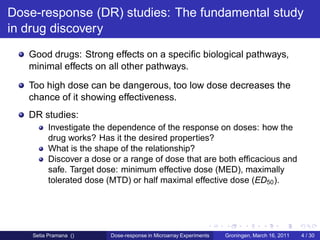
![Dose-response Modeling: Target Dose (ED50 )
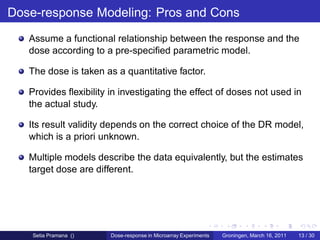
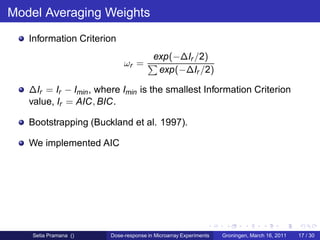
From the DR model the ED50 is estimated.
The ED50 : dose which induces a response halfway between the
baseline and maximum.
E0 E max
Slope (N)
Emax
E0
IC50
D ose
ED50 reflects the potency of the tested drug or compound.
The ED50 is restricted to lie within the interval (d1 , dk ] to avoid
problems arising from extrapolating beyond the dose range under
investigation.
Setia Pramana () Dose-response in Microarray Experiments Groningen, March 16, 2011 12 / 30](https://image.slidesharecdn.com/pramanarug-121109040537-phpapp01/85/Model-averaging-in-dose-response-study-in-microarray-expression-12-320.jpg)

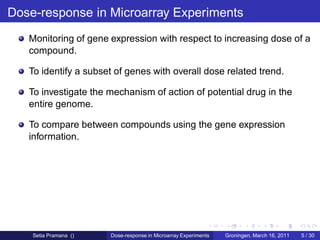
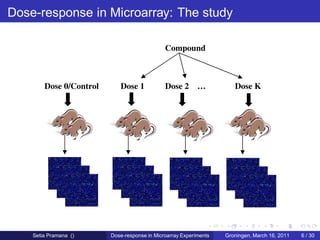
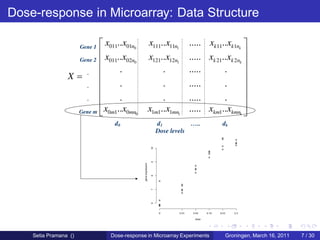
The document discusses dose-response modeling of gene expression data in microarray experiments, emphasizing the importance of identifying effective doses of compounds in drug discovery. It presents a structured approach involving feature selection, parametric modeling, and model averaging to analyze the relationship between drug doses and gene expression across multiple genes. The study highlights a case on antipsychotic compounds, demonstrating the significance of the estimated effective dose (ed50) in understanding drug efficacy and safety.