Geoinformatics is the science and technology dealing with geographic information and related data. It involves acquiring, storing, processing, analyzing and disseminating geospatial data. Key branches of geoinformatics include remote sensing, geographic information systems, cartography, global navigation satellite systems, photogrammetry and database management systems. Remote sensing uses sensors on platforms like satellites and aircraft to collect imagery and geospatial data of the Earth without direct contact.
As in the modern days this Presentation covers the breif description about the introduction of Remote Sensing to the students of Civil Engineering with Basic concepts
Application of Remote Sensing in Civil EngineeringIEI GSC
Presentation cum talk delivered by Dr Anjana Vyas, Dean CEPT University, Ahmedabad during 31st National Convention of Civil Engineering organized by The Institution of Engineers (India) Gujarat State Center, Ahmedabad
REMOTE SENSING A VERY USEFUL TECHNOLOGY TO MANKINDkaushikakumar
Hi! I am Kaushika i have given a clear explanation about remotesensing and its types.I have aso explained about the advantages of remote sensing technology.I hope it will be very useful for u.
A remote sensing system uses a detector to sense the reflected or emitted energy from the earth's surface, perhaps modified by the intervening atmosphere. The sensor can be on a satellite, aircraft, or drone. The sensor turns the energy into a voltage, which an analog to digital converter turns into a single integer value (called the Digital Number, or DN) for the energy. Alternatively a digital detector can store the DN directly. We can then display this value with an appropriate color to build up an image of the region sensed by the system. The DN represents the energy sensed by the sensor in a particular part of the electromagnetic spectrum, emitted or reflected from a particular region. The principles can also be applied to sonar imagery, especially useful in water where sound penetrates readily whereas electromagnetic energy attenuates rapidly.
Definitions,
Remote sensing systems can be active or passive: active systems put out their own source of energy (a large "flash bulb") whereas passive systems use solar energy reflected from the surface or thermal energy emitted by the surface. Active systems can achieve higher resolution.
Satellite resolution considers four things: spatial, spectral, radiometric, and temporal resolution.
Electromagnetic radiation and the atmosphere control many aspects of a remote sensing system.
Satellite orbits determine many characteristics of the imagery, what the satellite sees, and how often it revisits an area.
The signal to noise ratio is important for the design of remote sensing systems.
Satellite band tradeoffs.
Interpreting satellite reflectance patterns and images uses various statistical measures to assess surface properties in the image.
The colors used on the display are gray shading for single bands, and RGB for multi-band composites. We can also perform image merge and sharpening to combine the advantages of both panchromatic (higher spatial resolution) and color imagery (better differentiation of surface materials).
Keys for image analysis
Hyperspectral imagery
Spectral reflectance library--different materials reflect radiation differently
APPLICATION OF REMOTE SENSING AND GIS IN AGRICULTURELagnajeetRoy
India is a country that depends on agriculture. Today in this era of technological supremacy, agriculture is also using different new technologies like some robotic machinery to remote sensing and Geographical Information System (GIS) for the betterment of agriculture. It is easy to get the information about that area where human cannot check the condition everyday and help in gathering the data with the help of remote sensing. Whereas GIS helps in preparation of map that shows an accurate representation of data we get through remote sensing. From disease estimation to stress factor due to water, from ground water quality index to acreage estimation in various way agriculture is being profited by the application of remote sensing and GIS in agriculture. The applications of those software or techniques are very new to the agriculture domain still much more exploration is needed in this part. New software’s are developing in different parts of the world and remote sensing. Today farmers understand the beneficiaries of these kinds of techniques to the farm field which help in increasing productivity that will help future generation as technology is hype in traditional system of farming.
Remote sensing is the acquisition of information about an object or phenomenon without making physical contact with the object and thus in contrast to in situ observation. In modern usage, the term generally refers to the use of aerial sensor technologies to detect and classify objects on Earth (both on the surface, and in the atmosphere and oceans) by means of propagated signals (e.g. electromagnetic radiation). It may be split into active remote sensing (when a signal is first emitted from aircraft or satellites)[1][2][3] or passive (e.g. sunlight) when information is merely recorded.
Remote Sensing Data Acquisition,Scanning/Imaging systemsdaniyal rustam
full of concepts about RS data acquisition scanning and imaging systems. Best for students of remote sensing. in this presentation we briefly explained the concept of scanning in remote sensing.
Quality of water :
It includes all the physical, chemical and biological parameters along with test to be used for defining water quality and water schemes for city
NO1 Uk best vashikaran specialist in delhi vashikaran baba near me online vas...Amil Baba Dawood bangali
Contact with Dawood Bhai Just call on +92322-6382012 and we'll help you. We'll solve all your problems within 12 to 24 hours and with 101% guarantee and with astrology systematic. If you want to take any personal or professional advice then also you can call us on +92322-6382012 , ONLINE LOVE PROBLEM & Other all types of Daily Life Problem's.Then CALL or WHATSAPP us on +92322-6382012 and Get all these problems solutions here by Amil Baba DAWOOD BANGALI
#vashikaranspecialist #astrologer #palmistry #amliyaat #taweez #manpasandshadi #horoscope #spiritual #lovelife #lovespell #marriagespell#aamilbabainpakistan #amilbabainkarachi #powerfullblackmagicspell #kalajadumantarspecialist #realamilbaba #AmilbabainPakistan #astrologerincanada #astrologerindubai #lovespellsmaster #kalajaduspecialist #lovespellsthatwork #aamilbabainlahore#blackmagicformarriage #aamilbaba #kalajadu #kalailam #taweez #wazifaexpert #jadumantar #vashikaranspecialist #astrologer #palmistry #amliyaat #taweez #manpasandshadi #horoscope #spiritual #lovelife #lovespell #marriagespell#aamilbabainpakistan #amilbabainkarachi #powerfullblackmagicspell #kalajadumantarspecialist #realamilbaba #AmilbabainPakistan #astrologerincanada #astrologerindubai #lovespellsmaster #kalajaduspecialist #lovespellsthatwork #aamilbabainlahore #blackmagicforlove #blackmagicformarriage #aamilbaba #kalajadu #kalailam #taweez #wazifaexpert #jadumantar #vashikaranspecialist #astrologer #palmistry #amliyaat #taweez #manpasandshadi #horoscope #spiritual #lovelife #lovespell #marriagespell#aamilbabainpakistan #amilbabainkarachi #powerfullblackmagicspell #kalajadumantarspecialist #realamilbaba #AmilbabainPakistan #astrologerincanada #astrologerindubai #lovespellsmaster #kalajaduspecialist #lovespellsthatwork #aamilbabainlahore #Amilbabainuk #amilbabainspain #amilbabaindubai #Amilbabainnorway #amilbabainkrachi #amilbabainlahore #amilbabaingujranwalan #amilbabainislamabad
Water scarcity is the lack of fresh water resources to meet the standard water demand. There are two type of water scarcity. One is physical. The other is economic water scarcity.
Vaccine management system project report documentation..pdfKamal Acharya
The Division of Vaccine and Immunization is facing increasing difficulty monitoring vaccines and other commodities distribution once they have been distributed from the national stores. With the introduction of new vaccines, more challenges have been anticipated with this additions posing serious threat to the already over strained vaccine supply chain system in Kenya.
Event Management System Vb Net Project Report.pdfKamal Acharya
In present era, the scopes of information technology growing with a very fast .We do not see any are untouched from this industry. The scope of information technology has become wider includes: Business and industry. Household Business, Communication, Education, Entertainment, Science, Medicine, Engineering, Distance Learning, Weather Forecasting. Carrier Searching and so on.
My project named “Event Management System” is software that store and maintained all events coordinated in college. It also helpful to print related reports. My project will help to record the events coordinated by faculties with their Name, Event subject, date & details in an efficient & effective ways.
In my system we have to make a system by which a user can record all events coordinated by a particular faculty. In our proposed system some more featured are added which differs it from the existing system such as security.
Forklift Classes Overview by Intella PartsIntella Parts
Discover the different forklift classes and their specific applications. Learn how to choose the right forklift for your needs to ensure safety, efficiency, and compliance in your operations.
For more technical information, visit our website https://intellaparts.com
Industrial Training at Shahjalal Fertilizer Company Limited (SFCL)MdTanvirMahtab2
This presentation is about the working procedure of Shahjalal Fertilizer Company Limited (SFCL). A Govt. owned Company of Bangladesh Chemical Industries Corporation under Ministry of Industries.
Immunizing Image Classifiers Against Localized Adversary Attacksgerogepatton
This paper addresses the vulnerability of deep learning models, particularly convolutional neural networks
(CNN)s, to adversarial attacks and presents a proactive training technique designed to counter them. We
introduce a novel volumization algorithm, which transforms 2D images into 3D volumetric representations.
When combined with 3D convolution and deep curriculum learning optimization (CLO), itsignificantly improves
the immunity of models against localized universal attacks by up to 40%. We evaluate our proposed approach
using contemporary CNN architectures and the modified Canadian Institute for Advanced Research (CIFAR-10
and CIFAR-100) and ImageNet Large Scale Visual Recognition Challenge (ILSVRC12) datasets, showcasing
accuracy improvements over previous techniques. The results indicate that the combination of the volumetric
input and curriculum learning holds significant promise for mitigating adversarial attacks without necessitating
adversary training.
Immunizing Image Classifiers Against Localized Adversary Attacks
Remote sensing overview
1. What Is Geoinformatics:
Geoinformatics is the science and the technology
which develops and uses information science,
infrastructure to address the problems of
geography, geosciences and related branches of
engineering.
“The art, science or technology dealing with
acquisition, storage, processing, production,
presentation and dissemination of geoinformation“
2. Branches of geoinformatics
include
1. Remote Sensing
2. Geographic Information Systems (GIS)
3. Cartography
4. Global Navigation Satellite
Systems(GPS)
5. Photogrammetry
6. DBMS- Data Base Management System
3. I N D I AN I N ST I T U T E O F RE MO T E SE N SI N G , D E H RAD U N
2/11/2016
1
Remote Sensing Overview
&
Earth Observation Data for
Urban Planning
4. I N D I AN I N ST I T U T E O F RE MO T E SE N SI N G , D E H RAD U N
REMOTE SENSING (Areal and Space based)
‐ Range of satellite data available: IRS series (Resourcesat, Cartosat,
RISAT, etc.), Geoeye, Quickbird, Worldview, IKONOS…
PHOTOGRAMMETRY
‐ Areal
‐ Digital (Cartosat-1, Pleiades, ALOS PALSAR, SPOT...)
‐ Close range Photogrammetry
LiDAR-Terrestrial Laser Scanner
GEOGRAPHICAL INFORMATION SYSTEM (GIS)
‐ Facilitates data generation, integration and analysis
GLOBAL POSITIONING SYSTEM (GPS)
‐ Facilitates geo-referencing, asset mapping..
UNMANNED AERIAL VEHICLE (UAV)- mapping of urban areas
GROUND PENETRATING RADAR (GPR)- underground utilities..
…
Innovative Technologies for Urban Planning
5. I N D I AN I N ST I T U T E O F RE MO T E SE N SI N G , D E H RAD U N
Remote Sensing
Science and
obtaining
art of
information
about an object, area, or
phenomenon through the
analysis of data acquired
by a device that is not in
contact.
-Lillesand and Kiefer (1994)
6. I N D I AN I N ST I T U T E O F RE MO T E SE N SI N G , D E H RAD U N
Brief history of Remote Sensing
1909 Wilbur Wright and a motion picture
photographer are first to use an aircraft
as a platform - over Centocelli, Italy
1950s “Remote sensing” coined by Evelyn
Pruitt in mid-1950s
1972 ERTS (Landsat) 1 launched
1970-80Rapid advances in digital image
processing due to powerful micro-
processor based computers available
1988 Indian Remote Sensing Satellite (IRS)
launched.
…….
7. I N D I AN I N ST I T U T E O F RE MO T E SE N SI N G , D E H RAD U N
Sun
Satellite
Ground Station
Data Archival
Data Products
Interpretation & Analysis Final Product
Remote Sensing Process
A
B
C
D
E
F G
8. I N D I AN I N ST I T U T E O F RE MO T E SE N SI N G , D E H RAD U N
Remote Sensing Process
Energy Source or Illumination (A)
Illuminates or provides electromagnetic energy to target
of interest.
Radiation and the Atmosphere (B)
As energy travels from its source to target, it will come
in contact with and interact with atmosphere it passes
through. This interaction may take place a second time
as energy travels from target to sensor.
9. I N D I AN I N ST I T U T E O F RE MO T E SE N SI N G , D E H RAD U N
Satellite
D
Remote Sensing Process
Earth
C
10. I N D I AN I N ST I T U T E O F RE MO T E SE N SI N G , D E H RAD U N
Interaction with the Target (C)
Once energy makes its way to target through
atmosphere, it interacts with target depending on
properties of both target and the radiation.
Recording of Energy by the Sensor (D)
After energy has been scattered by, or emitted from
target, we require a sensor (remote - not in contact with
the target) to collect and record electromagnetic
radiation.
Remote Sensing Process
11. I N D I AN I N ST I T U T E O F RE MO T E SE N SI N G , D E H RAD U N
Ground Station
Data Archival
Data Products
Interpretation & Analysis
E
F
Remote Sensing Process
12. I N D I AN I N ST I T U T E O F RE MO T E SE N SI N G , D E H RAD U N
Transmission, Reception, and Processing (E)
Energy recorded by sensor has to be transmitted, often in
electronic form, to a receiving and processing station
where data are processed into an image (hardcopy and/or
digital form).
Interpretation and Analysis (F)
Processed image is interpreted, visually and/or digitally or
electronically, to extract information about target which
was illuminated.
Remote Sensing Process
13. I N D I AN I N ST I T U T E O F RE MO T E SE N SI N G , D E H RAD U N
Final Product
G
Remote Sensing Process
14. I N D I AN I N ST I T U T E O F RE MO T E SE N SI N G , D E H RAD U N
Platforms and Sensors
from <1 m
to 36,000 km height
PLATFORMS
Stage to mount camera or sensor to acquire information about
a target under investigation. Based on its altitude above earth
Ground borne, ii) Airsurface, platforms may be classified a i)
borne and iii) Space borne.
Ground-based platforms
Mainly used for collecting ground truth or for laboratory
simulation studies.
Air-borne platforms
Used to acquire aerial photographs for photo-interpretation
and Photogrammetry purposes. Scanners are tested against
their utility and performance from these platforms before
these are flown onboard satellite missions.
Space-borne platforms
Platforms in space are not affected by the earth's atmosphere.
These platforms are freely moving in their orbits around the
earth, and entire earth or any part of the earth can be covered
at specified intervals. The coverage mainly depends on the
orbit of the satellite.
15. I N D I AN I N ST I T U T E O F RE MO T E SE N SI N G , D E H RAD U N
Orbits
Geostationary satellites
An equatorial west to east
satellite orbiting the earth
at an altitude of 36000
km, the altitude at which
it makes one revolution in
24 hours, synchronous
with the earth's rotation.
These are mainly used for
communication and
meteorological appl. viz.,
GOES, METEOSAT,
INTELSAT, INSATsatellites,
etc.
36,000 km
~800 km
1. Geostationary
2. Polar orbiting or Sun-synchronous
Sun-Synchronous satellites
An earth satellite orbit in
which the orbital plane is
near polar and the
altitude is such that the
satellite passes over all
places on earth having the
same latitude twice in
at the sameeach orbit
local sun-time. LANDSAT
SPOT series, IRS
NOAA, SEASAT,
series,
series,
TIROS, HCMM, SKYLAB,
SPACE SHUTTLE
16. I N D I AN I N ST I T U T E O F RE MO T E SE N SI N G , D E H RAD U N
Passive Vs. Active Remote Sensing
Most remote-sensing systems are
passive
They use energy provided by the sun,
and Earth. e.g. Aerial photographs and
most satellite systems
Used for earth resources mapping and
monitoring
Some systems are active
They generate their own energy e.g.
RADAR (radio detection and ranging),
LIDAR (light detection and ranging) and
SONAR(Sound navigation ranging)
Used for altimetry and imaging.
17. I N D I AN I N ST I T U T E O F RE MO T E SE N SI N G , D E H RAD U N
Advantages of remote sensing
1. Global
coverage
2. Synoptic
view
4.
Cost
3. Repeatability
18. I N D I AN I N ST I T U T E O F RE MO T E SE N SI N G , D E H RAD U N
Limitations of Remote Sensing
Data acquisition
Remote sensing instruments needs calibration
Systematic and non-systematic errors
Data interpretation
Need to have some knowledge of the phenomena being
studied
Need to understand measurement uncertainties
Error correction (Human or process induced)
19. I N D I AN I N ST I T U T E O F RE MO T E SE N SI N G , D E H RAD U N
Resolution
Ability to distinguish objects which are spatially
near or spectrally similar.
We often specify the resolution in terms of linear size of
smallest feature that we can discriminate (often expressed
in meters).
Remote sensors measure differences and variations of
objects that are often described in terms of four main
resolutions, each of which affect the accuracy and
usefulness of remote sensors for urban mapping.
Resolution
Spatial Spectral Radiometric Temporal
20. I N D I AN I N ST I T U T E O F RE MO T E SE N SI N G , D E H RAD U N
Spatial Resolution: higher spatial resolution desirable as most of
urban areas are densely built and features are comparatively small in
size.
Minimum of four pixels within an object to identify (one-half the width of the
smallest dimension)
Role of shape, size, texture, orientation, pattern, shadow, association, etc.
Land use vs. land cover?
Spectral Resolution: Multispectral data enhances ability to
discern features but interpreter’s intervention is must to
discriminate among various urban features.
Hyperspectral data to distinguish urban features
Temporal Resolution: e.g., land use transformations, urban
sprawl, change in socio-economic characteristics.
Radiometric Resolution: enhances capability to distinguish
features and interpretation
Requirements for Urban Mapping
21. I N D I AN I N ST I T U T E O F RE MO T E SE N SI N G , D E H RAD U N
. EVERY 30 MIN IMAGING
. 1M+ SCALES
. CLIMATE/ WEATHER
Indian Remote Sensing Satellite Systems
Choice of Resolution
22. I N D I AN I N ST I T U T E O F RE MO T E SE N SI N G , D E H RAD U N
. EVERY 22 DAYS IMAGING
. 1:50K SCALES
. DETAILED RESOURCES
. LOCAL AREA IMAGING
. 1:2000/4000/8000 SCALES
. STEREO CAPABILITY
Choice of Resolution.. Contd.
23. I N D I AN I N ST I T U T E O F RE MO T E SE N SI N G , D E H RAD U N
2012
RISAT-1
24. I N D I AN I N ST I T U T E O F RE MO T E SE N SI N G , D E H RAD U N
Spatial Resolution
Spatial resolution refers to the size of the smallest
object that can be resolved on the ground.
HIGH SPATIAL RESOLUTION (0.6m - 4m)
‐ GeoEye-1, WorldView-1, WorldView-2, QuickBird,
IKONOS, FORMOSAT-2, ALOS, CARTOSAT-1, CARTOSAT-2,
2A, 2B, SPOT-5, IRS-P6 LISS-IV…
MEDIUM SPATIAL RESOLUTION (4m - 30 m)
‐ ASTER, LANDSAT, Resourcesat…
LOW SPATIAL RESOLUTION (30m - > 1000 m)
‐ SeaWiFS, GOES, Resourcesat AWiFS, Oceansat OCM, etc.
25. I N D I AN I N ST I T U T E O F RE MO T E SE N SI N G , D E H RAD U N
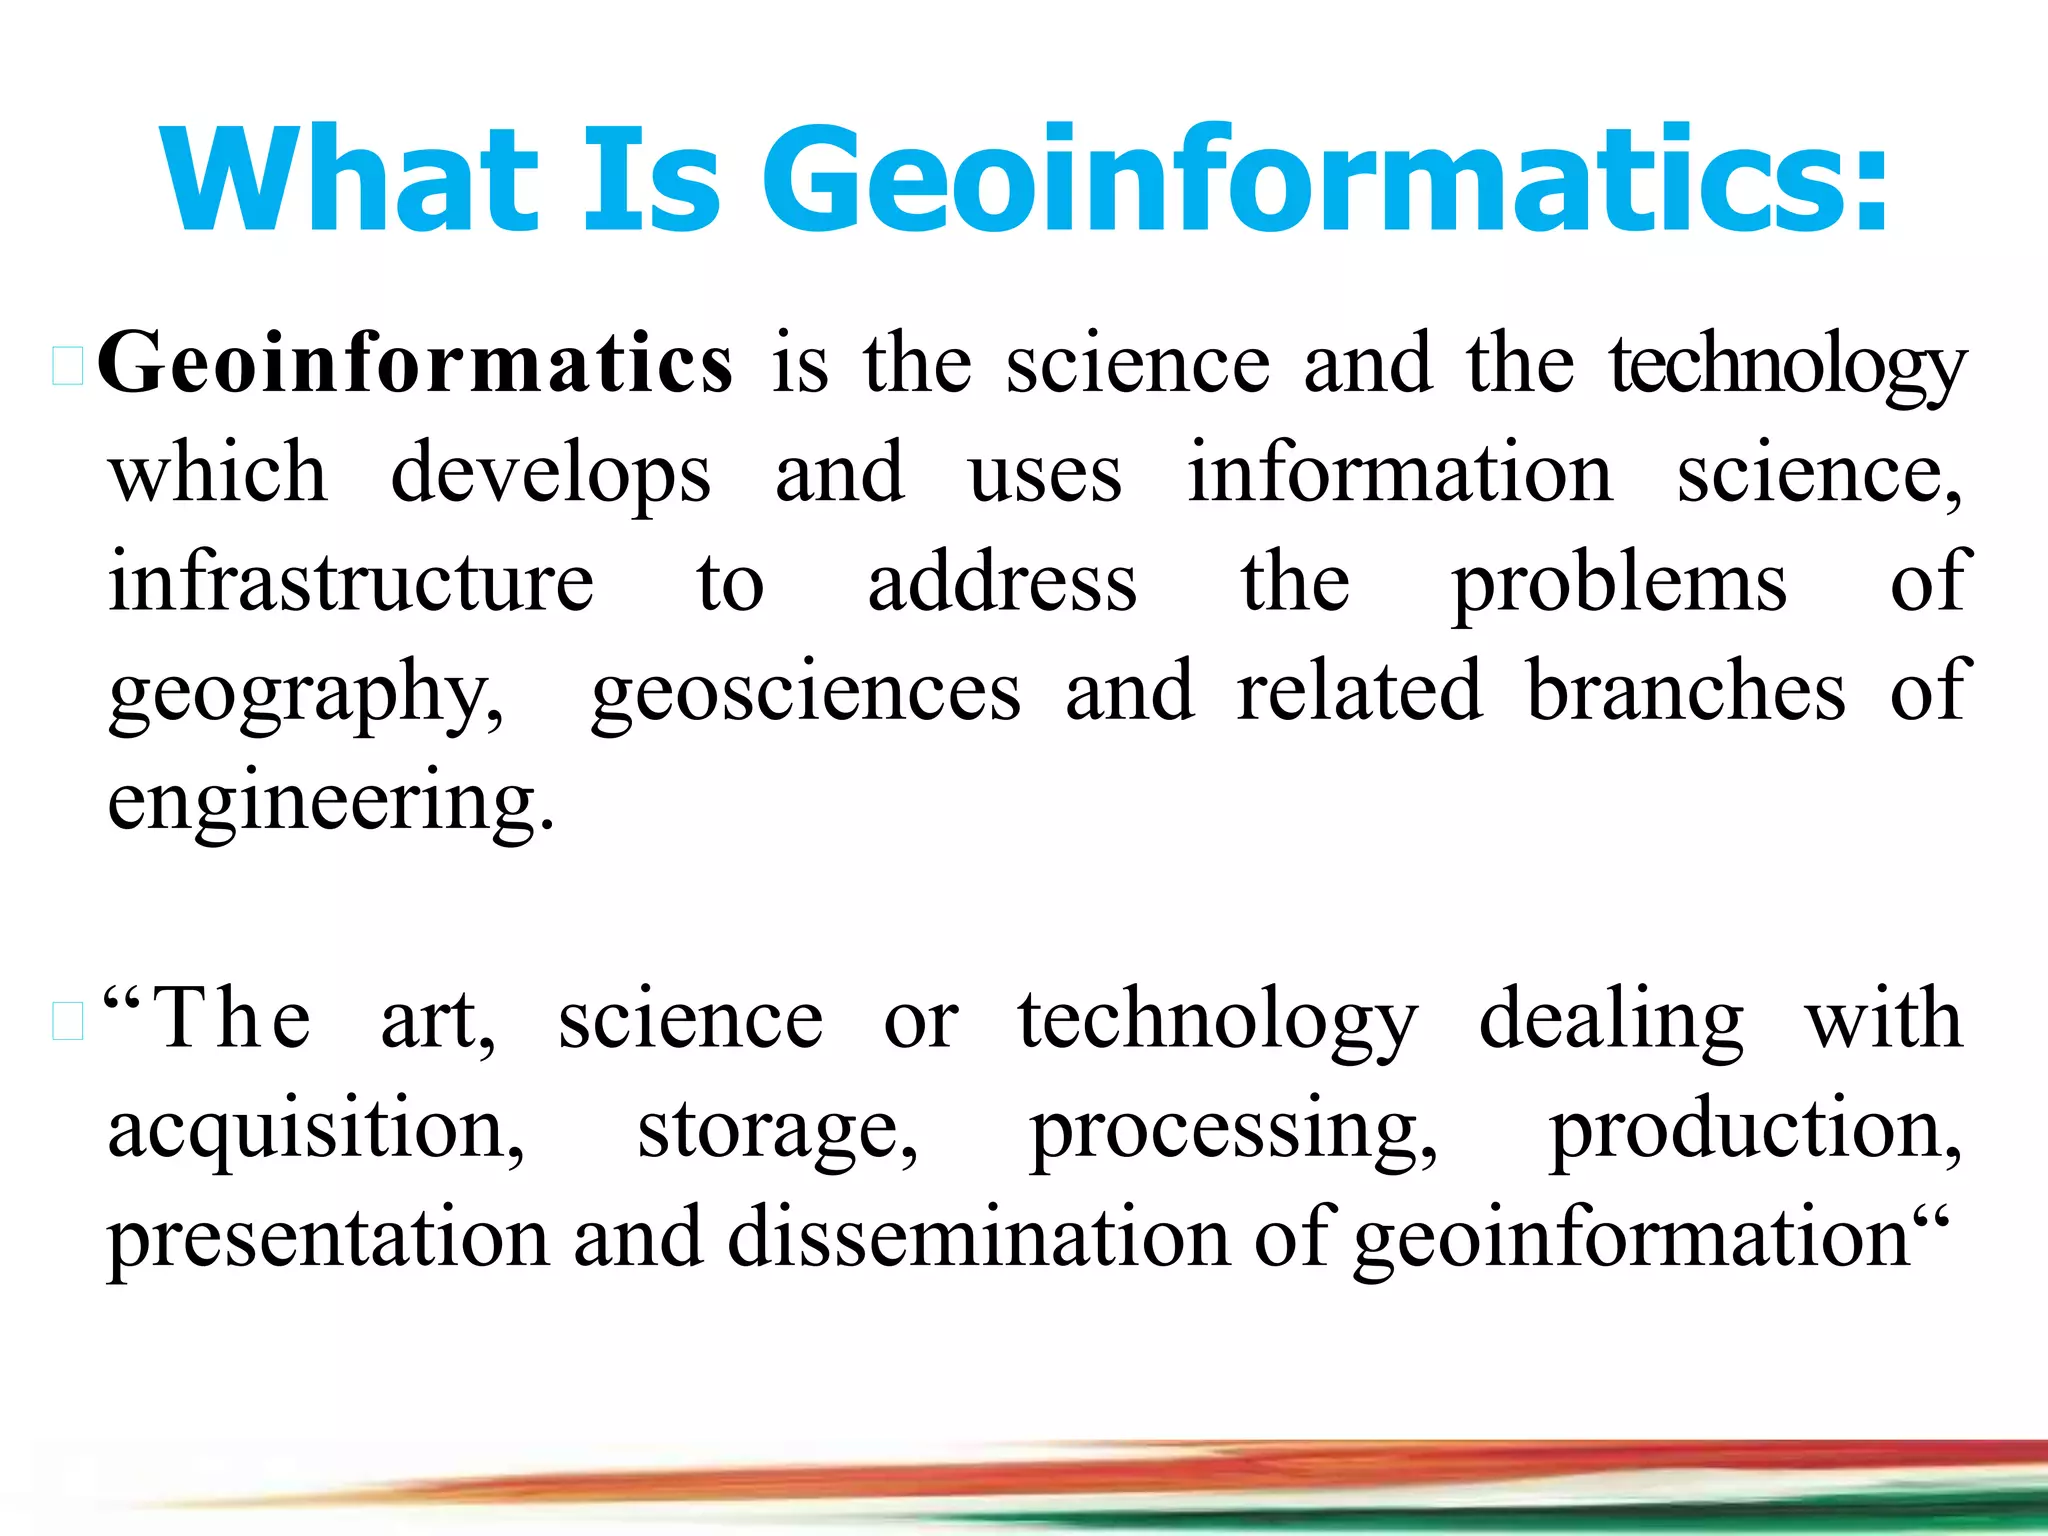
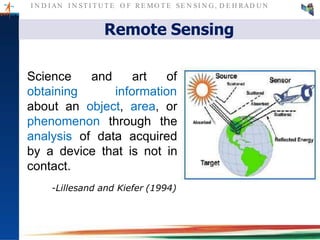
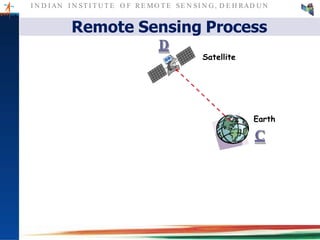
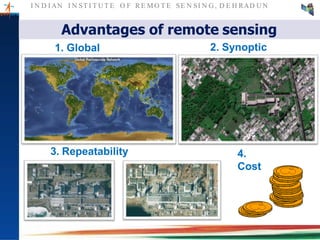
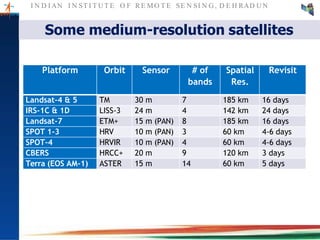
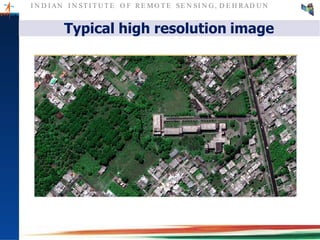
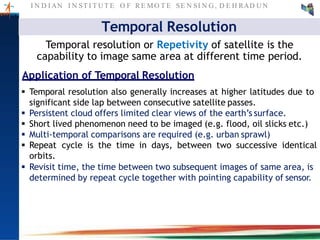
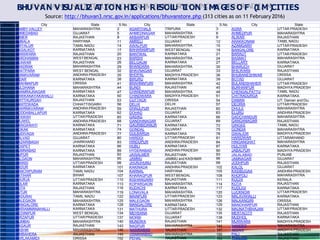
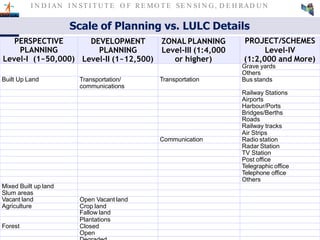
High Resolution Satellite Data
Satellite Sensor No. of Bands Spatial Resolution [m] Archive from
Resourcesat-1,2 LISS-IV 1 5.8 2011
CartoSat-1 ( Stereo) PAN 1 2.5 2005
Cartosat-2, 2A, 2B PAN 1 0.8 2007
IRS-1C, 1D PAN 1 5.8 1997
Pléiades 1A , 1B MS - HiRI 4 2.8 2012
Pléiades 1A, 1B (Stereo) PAN - HiRI 1 0.5 2012
SPOT-6 NAOMI MS 4 6 2013
SPOT-6 NAOMI PAN 1 1.5 2013
KOMPSAT-3 MS 4 2.8 2012
KOMPSAT-3 PAN 1 0.7 2012
WorldView-1 PAN 1 0.5 2007
WorldView-2 MS 8 1.84 2009
WorldView-2 PAN 1 0.5 2009
GeoEye-1 MS 4 2 2008
GeoEye-1 PAN 1 0.5 2008
ALOS (Stereo) PRISM 1 2.5 2006
EROS-B EROS B 1 0.7 2006
KOMPSAT-2 MS 4 4 2006
KOMPSAT-2 PAN 1 1 2006
FORMOSAT-2 PAN 1 2 2005
OrbView-3 MS 4 4 2003
OrbView-3 PAN 1 1 2003
QuickBird MS 4 2.4 2001
QuickBird PAN 1 0.6 2001
EROS-A EROS A 1 1.8 2000
IKONOS MS 4 4 1999
IKONOS PAN 1 1 1999
26. I N D I AN I N ST I T U T E O F RE MO T E SE N SI N G , D E H RAD U N
Some medium-resolution satellites
Platform Orbit Sensor # of
bands
Spatial
Res.
Revisit
Landsat-4 & 5 TM 30 m 7 185 km 16 days
IRS-1C & 1D LISS-3 24 m 4 142 km 24 days
Landsat-7 ETM+ 15 m (PAN) 8 185 km 16 days
SPOT 1-3 HRV 10 m (PAN) 3 60 km 4-6 days
SPOT-4 HRVIR 10 m (PAN) 4 60 km 4-6 days
CBERS HRCC+ 20 m 9 120 km 3 days
Terra (EOS AM-1) ASTER 15 m 14 60 km 5 days
27. I N D I AN I N ST I T U T E O F RE MO T E SE N SI N G , D E H RAD U N
Some low-resolution satellites
Platform Orbit Sensor Res. # of
bands
Swath Revisit
Meteosat GEO VISSR 2.5 km 3 ½Earth 30 min
NOAA Polar AVHRR 1 km 7 3000 km Daily
Resurs-O1 S-sync MSU-SK1 200 m 4 760 km 3-5 days
SeaStar S-sync SeaWiFS 1.1 km 8 2800 km Daily
28. I N D I AN I N ST I T U T E O F RE MO T E SE N SI N G , D E H RAD U N
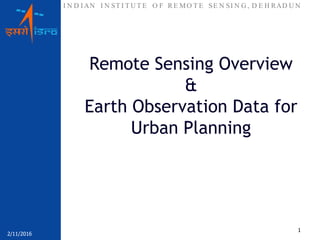
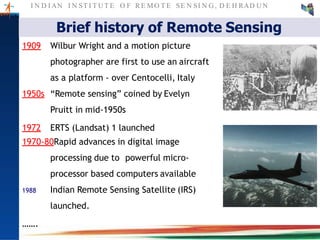
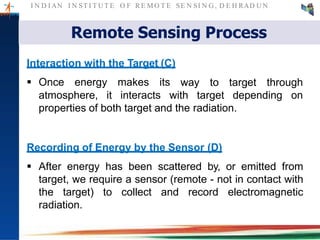
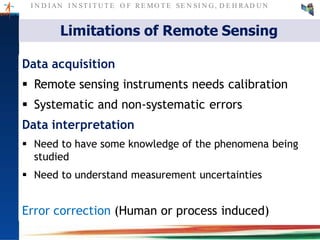
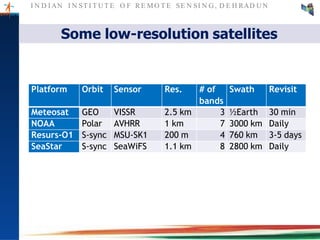
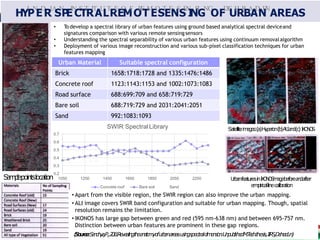
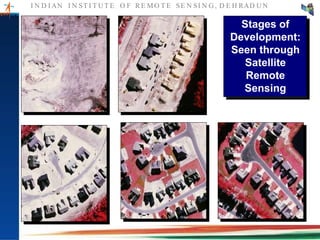
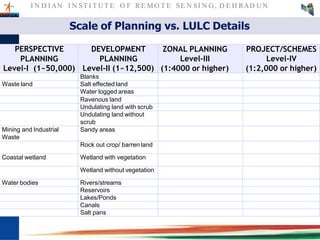
spectral bands. The characteristic spectrum of the
target pixel is acquired in a hyperspectral image.
Example:- NASA's EO-1 satellite
[ Hyperspectral image of Benthic
habitats around Virgin islands, national
Park, St. John, U.S ]
Panchromatic Image
B&W image (one band) ranging from 0.4-0.7 µ, visible
Multispectral Image
Features detected using several discrete bands. Width of
these bands that spectral resolution refers too.
Example:- A multispectral IKONOS image consists of four
bands: Blue, Green, Red and Near Infrared, while a Landsat
TM multispectral image consists of seven bands: blue, green,
red, near-IR bands, two SWIR bands, and a thermal IR band.
Hyperspectral Image
Consists of about a hundred or more continuous
Panchromatic
Multi
Spectral
Hyper Spectral
Spectral Resolution
ability to resolve spectral features and bands into separate components
Spectral
Resolution
29. I N D I AN I N ST I T U T E O F RE MO T E SE N SI N G , D E H RAD U N
Electromagnetic Spectrum
Visible: 0.4-0.7; blue: 0.4-0.5 green: 0.5-0.6 red: 0.6-0.7
30. I N D I AN I N ST I T U T E O F RE MO T E SE N SI N G , D E H RAD U N
Spectral Reflectance Curve
31. I N D I AN I N ST I T U T E O F RE MO T E SE N SI N G , D E H RAD U N
Typical high resolution image
32. HY
I
P
N
E
D
R
IA
S
N
PE
IN
C
S
T
T
R
IT
A
U
L
T
R
E
E
O
M
F
O
RE
T
M
E
O
S
T
E
E
N
S
S
EN
IN
SI
G
NG
O
,
F
DE
U
H
R
R
B
A
A
D
N
UN
AREAS
• To develop a spectral library of urban features using ground based analytical spectral deviceand
signatures comparison with various remote sensingsensors
• Understanding the spectral separability of various urban features using continuum removalalgorithm
• Deployment of various image reconstruction and various sub-pixel classification techniques for urban
features mapping
Urban Material Suitable spectral configuration
Brick 1658:1718:1728 and 1335:1476:1486
Concrete roof 1123:1143:1153 and 1002:1073:1083
Road surface 688:699:709 and 658:719:729
Bare soil 688:719:729 and 2031:2041:2051
Sand 992:1083:1093
Samplepointslocation
Satelliteimages:(a)Hyperion(b)ALIand(c)IKONOS
UrbanfeaturesinIKONOSimagebeforeandafter
empiricallinecalibration
• Apart from the visible region, the SWIR region can also improve the urban mapping.
• ALI image covers SWIR band configuration and suitable for urban mapping. Though, spatial
resolution remains the limitation.
• IKONOS has large gap between green and red (595 nm-638 nm) and between 695-757 nm.
Distinction between urban features are prominent in these gap regions.
(Source:Sandhya,P.,2011.Revealingtheanatomyofurbanareasusingspectraldimension.UnpublishedM.Tech.thesis,IIRS,Dehradun)
0.2
0.7
0.6
0.5
0.4
0.3
1050 1250 1450 1650 1850 2050 2250
SWIR Spectral Library
Concrete roof Bare soil Sand
33. I N D I AN I N ST I T U T E O F RE MO T E SE N SI N G , D E H RAD U N
Radiometric Resolution
Radiometric resolution determines how fine the
sensor can distinguish between objects of similar
reflection. It refers to the smallest change in
intensity level that can be detected by sensing
system.
Quantization refers to technique of representing
radiometric levels by a limited set of numbers.
For e.g., If a sensor of 8 bit is used to record the
data there would be 28=256 digital values
available, ranging from ‘0’ to ‘255’.
34. I N D I AN I N ST I T U T E O F RE MO T E SE N SI N G , D E H RAD U N
8-bit quantization
(256 levels)
6-bit quantization
(64 levels)
4-bit quantization
(16 levels)
3-bit quantization
(8 levels)
2-bit quantization
(4 levels)
1-bit quantization
(2 levels)
Example of Radiometric Resolution
35. I N D I AN I N ST I T U T E O F RE MO T E SE N SI N G , D E H RAD U N
Temporal Resolution
Temporal resolution or Repetivity of satellite is the
capability to image same area at different time period.
Application of Temporal Resolution
Temporal resolution also generally increases at higher latitudes due to
significant side lap between consecutive satellite passes.
Persistent cloud offers limited clear views of the earth’s surface.
Short lived phenomenon need to be imaged (e.g. flood, oil slicks etc.)
Multi-temporal comparisons are required (e.g. urban sprawl)
Repeat cycle is the time in days, between two successive identical
orbits.
Revisit time, the time between two subsequent images of same area, is
determined by repeat cycle together with pointing capability of sensor.
36. I N D I AN I N ST I T U T E O F RE MO T E SE N SI N G , D E H RAD U N
Stages of
Development:
Seen through
Satellite
Remote
Sensing
37. I N D I AN I N ST I T U T E O F RE MO T E SE N SI N G , D E H RAD U N
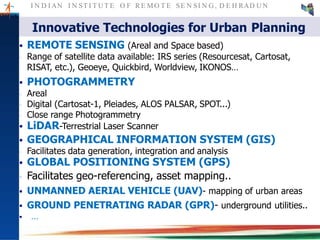
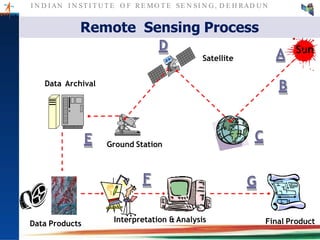
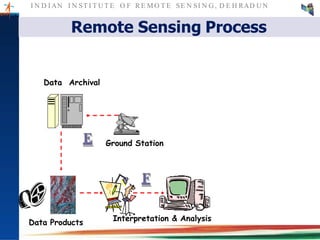
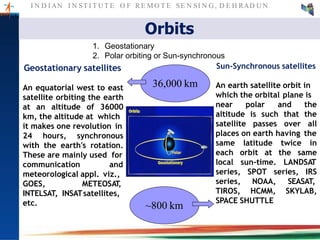
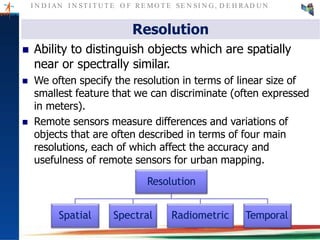
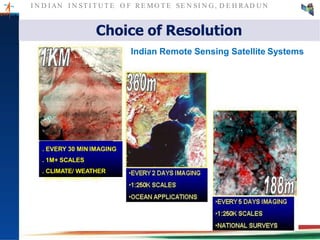
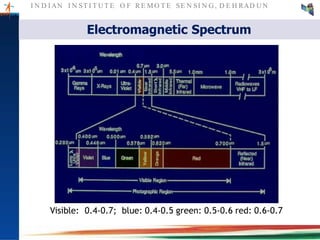
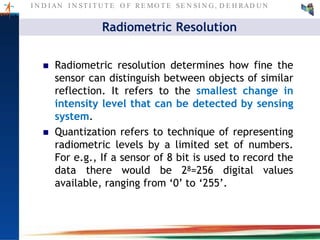
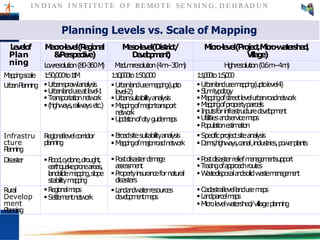
Mapping Scale vs. Resolution
Resolution is a function of latitude, zoom level, and
a constant.
Scale is dependent on screen resolution or DPI.
Map scale = 1
(pixel ground size [m/pixel] × pixel density[pixels/m])
so that 1 m on the map represents x m on ground
Source:https://blogs.esri.com/esri/arcgis/2009/12/04/mathematical-relationships-among-map-scale-
raster-data-resolution-and-map-display-resolution/
38. I N D I AN I N ST I T U T E O F RE MO T E SE N SI N G , D E H RAD U N
Levelof
Plan
ning
Macro-level(Regional
&Perspective)
Meso-level(District/
Development)
Micro-level(Project,Micro-watershed,
Village)
Lowresolution(80-360M) Mediumresolution(4m–30m) Highresolution(0.6m–4m)
Mappingscale 1:50,000to1:1M 1:10,000to1:50,000 1:1,000to1:5,000
UrbanPlanning Urbansprawlanalysis
Urbanlanduseatlevel-1
Transportationnetwork
(highways,railwaysetc.)
Urbanlandusemapping(upto
level-2)
Urbansuitabilityanalysis
Mappingofmajortransport
network
Updationofcityguidemaps
Urbanlandusemapping(uptolevel4)
Slumtypology
Mappingofstreetlevelurbanroadnetwork
Mappingofpropertyparcels
Inputsforinfrastructuredevelopment
Utilitiesandservicemaps
Populationestimation
Infrastru
cture
Planning
Regionallevelcorridor
planning
Broadsitesuitabilityanalysis
Mappingofmajorroadnetwork
Specificprojectsiteanalysis
Dams,highways,canal,industries,powerplants
Disaster Flood,cyclone,drought,
earthquakeproneareas,
landslidemapping,slope
stabilitymapping
Postdisasterdamage
assessment
Propertyinsurancefornatural
disasters
Postdisasterreliefmanagementsupport
Tracingofapproachroutes
Wastedisposalandsolidwastemanagement
Rural
Develop
ment
Planning
Regionalmaps
Settlementnetwork
Landandwaterresources
developmentmaps
Cadastrallevellandusemaps
Landparcelmaps
Microlevelwatershed/villageplanning
Planning Levels vs. Scale of Mapping
39. I N D I AN I N ST I T U T E O F RE MO T E SE N SI N G , D E H RAD U N
Metro - 13 towns
Class I – 70 towns
Class II – 15 towns
Class III – 19 towns
Class IV – 17 towns
Class V – 6 towns
Class VI – 12 towns
National Urban Information System (NUIS)
Scope: Large scale Urban Geospatial
database for various levels of Urban
Planning, Infrastructure development and
e-governance.
Primary Layers
1. Urban land use
2. Physiography
3. Geomorphology
4. Geological Structures
5. Lithology
6. Soil
7. Drainage
8. Surface Waterbodies
9. Road
10. Rail
11. Canal
12. Transportation Nodes
Incorporated Layers
1. Administrative Boundaries
2. Forest Boundary
3. Settlement & Village Locations
4. City / Town Boundaries
No. of Towns – 152 (~56 sq.km)
Urban Geospatial database
for Urban Local Bodies
(ULBs) for Urban Planning,
Infrastructure development
and e-governance
Bhuvan-NUIS based online
Geospatial solution for
Master Plan Preparation
Datasets for Urban Planning
Source:http://bhuvan.nrsc.gov.in/gis/thematic/index.php
41. I N D I AN I N ST I T U T E O F RE MO T E SE N SI N G , D E H RAD U N
42. I N D I AN I N ST I T U T E O F RE MO T E SE N SI N G , D E H RAD U N
43. I N D I AN I N ST I T U T E O F RE MO T E SE N SI N G , D E H RAD U N
PERSPECTIVE
PLANNING
Level-I
(1:50,000)
DEVELOPMENT
PLANNING
Level-II
(1:12,500)
ZONAL PLANNING
Level-III
(1:4,000 or higher)
PROJECT/SCHEMES
Level-IV
(1:2,000 or higher)
Built up land Rural
Built up land Residential
High rise
Apartments
Flats
Medium rise
Apartments
Flats
Low rise
Apartments
Flats
Row houses
Tenements
Slums
Seasonal
Others
Built up land Industrial
Heavy
Light
Others
Built up land Commercial
Large
Small
Others
Built up land Recreational
Parks
Gardens
Playgrounds
Scale of Planning vs. LULC Details
44. I N D I AN I N ST I T U T E O F RE MO T E SE N SI N G , D E H RAD U N
PERSPECTIVE
PLANNING
Level-I (1~50,000)
DEVELOPMENT
PLANNING
Level-II(1~12,500)
ZONAL PLANNING
Level-III
(1:4,000 or higher)
PROJECT/SCHEMES
Level-IV
(1:2,000 or higher)
Race Course
Golf course
Planetariums
Aquariums
Historic buildings
Theatres
Exhibition halls
Gymnasium
Swimming pools
Others
Built up land Public & semi-public
Health
Primary Health centre
Hospitals
Dispensaries
Others
Education
Schools
Colleges
Universities
Others
Religious
Public Utilities
Government offices
Cantonment areas
Electric stations and transmissions
Gas storage and transmission
Petroleum Storage and transmission
Solid waste disposal sites
Sewerage Treatment plants
Scale of Planning vs. LULC Details
45. I N D I AN I N ST I T U T E O F RE MO T E SE N SI N G , D E H RAD U N
PERSPECTIVE
PLANNING
Level-I (1~50,000)
DEVELOPMENT
PLANNING
Level-II (1~12,500)
ZONAL PLANNING
Level-III (1:4,000
or higher)
PROJECT/SCHEMES
Level-IV
(1:2,000 and More)
Grave yards
Built Up Land Transportation/
communications
Transportation
Others
Bus stands
Railway Stations
Airports
Harbour/Ports
Bridges/Berths
Roads
Railway tracks
Communication
Air Strips
Radio station
Radar Station
TV Station
Post office
Telegraphic office
Telephone office
Others
Mixed Built up land
Slum areas
Vacant land
Agriculture
Open Vacant land
Crop land
Fallow land
Plantations
Forest Closed
Open
Scale of Planning vs. LULC Details
46. I N D I AN I N ST I T U T E O F RE MO T E SE N SI N G , D E H RAD U N
PERSPECTIVE
PLANNING
Level-I (1~50,000)
DEVELOPMENT
PLANNING
Level-II (1~12,500)
ZONAL PLANNING
Level-III
(1:4000 or higher)
PROJECT/SCHEMES
Level-IV
(1:2,000 or higher)
Blanks
Waste land Salt effected land
Water logged areas
Ravenous land
Undulating land with scrub
Undulating land without
scrub
Mining and Industrial
Waste
Sandy areas
Rock out crop/ barren land
Coastal wetland Wetland with vegetation
Wetland without vegetation
Water bodies Rivers/streams
Reservoirs
Lakes/Ponds
Canals
Salt pans
Scale of Planning vs. LULC Details
47. I N D I AN I N ST I T U T E O F RE MO T E SE N SI N G , D E H RAD U N