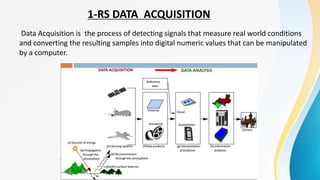
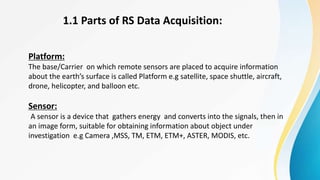
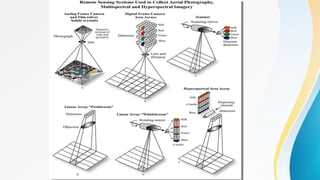
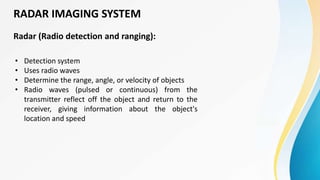
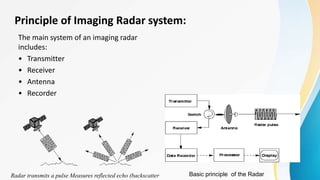
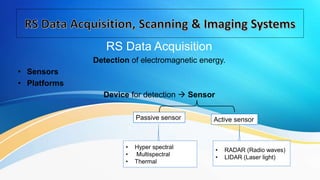
The document provides an overview of remote sensing (RS) data acquisition, detailing its components, platforms, sensors, and scanning techniques. It distinguishes between passive and active sensors, and explains various types of imaging systems, including multispectral, hyperspectral, thermal, radar, and lidar. Key data collection methods such as across-track and along-track scanning are discussed, highlighting their advantages and disadvantages.