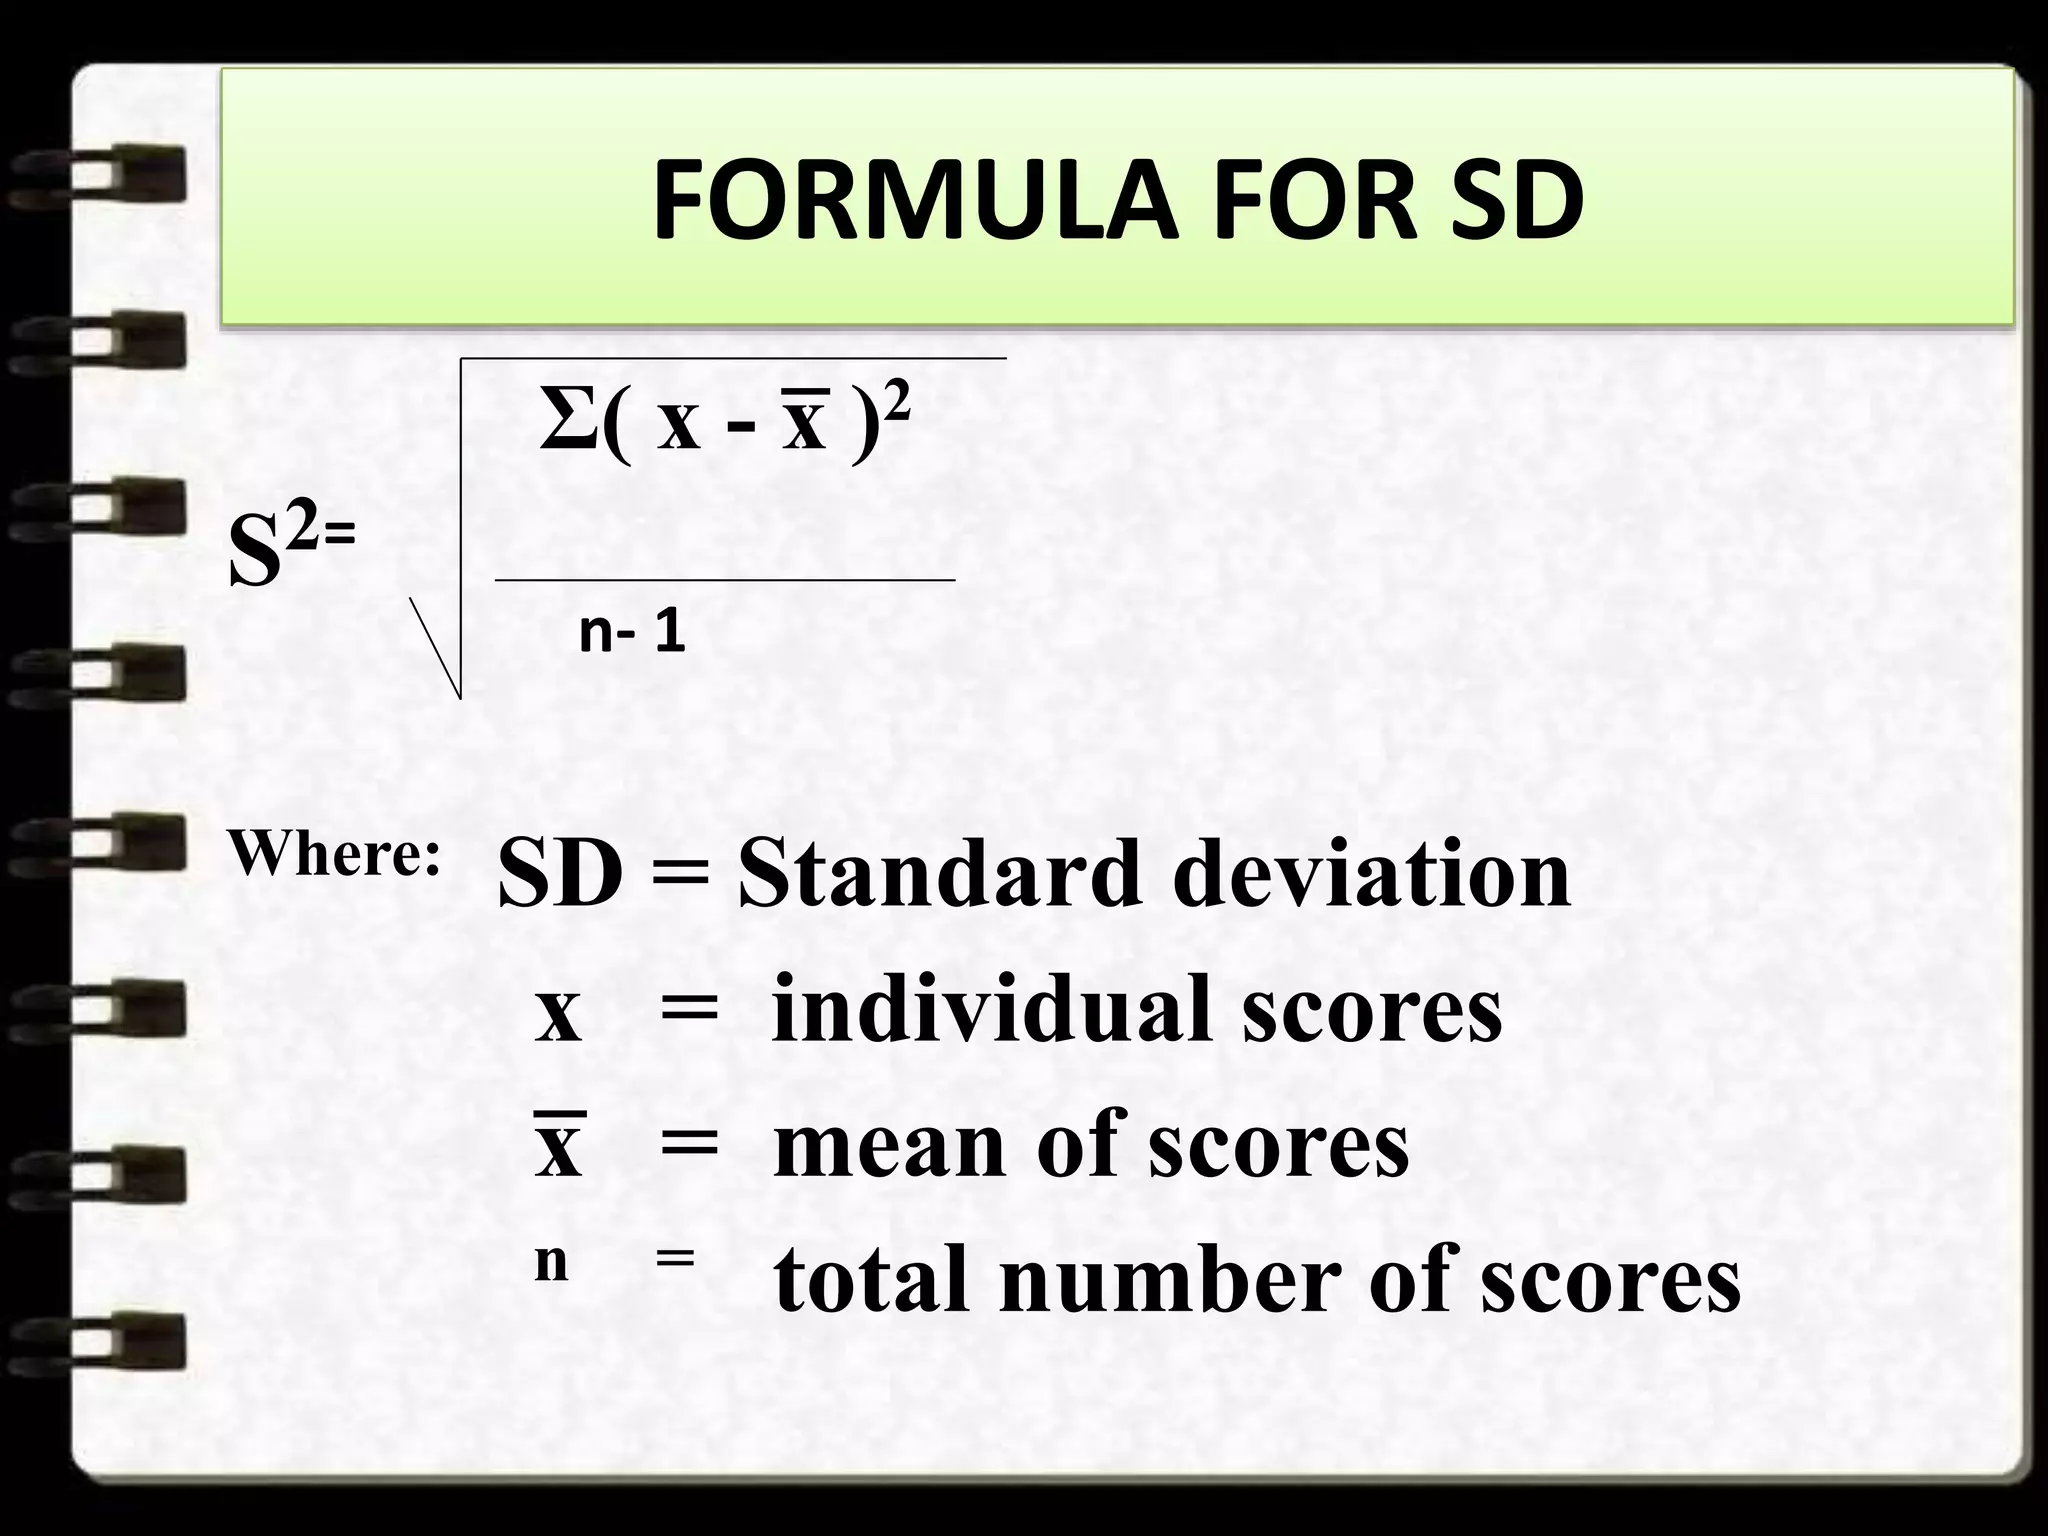
Measures
of
Variation
BY: JERLY TANODRA
JHONNA BARROSA
MARY GRACE PARADIANG
Measures of variation
-Measures of variation
are used to describe the
distribution of the data.
Range
-The range is the difference
between the greatest and least
data values.
FORMULA:
R= H-L
FIND THE RANGE
• GIVEN: TEST SCORES OF 40 STUDENTS IN
STATISTICS
30 33 54 44 53 49 46 44
32 35 57 43 56 50 45 43
31 34 51 39 52 49 46 42
28 33 52 41 51 45 47 44
27 34 53 36 48 42 37 38
STEPS IN FINDING THE RANGE
1. Arrange the data/number from least
value to greatest value.
EXAMPLE:
27,28,30,31,32,33,33,34,34,35,36,37,38,39,41,4
2,42,43,43,44,44,44,45,45,46,46,47,48,49,49,50
,51,51,52, 52,53,53,54,56,5757
STEPS IN FINDING THE RANGE
2. Find the RANGE
FORMULA:
R= H-L
SOLUTION:
R= 57- 27
= 30
INTERQUARTILE
• The interquartile range (IQR)
is a measure of variability,
based on dividing a data set
into quartiles.
QUARTILES
-Quartiles divide a rank-ordered data set into
four equal parts. The values that divide each part are
called the first, second, and third quartiles; and they
are denoted by Q1, Q2, and Q3, respectively.
• Q1 is the "middle" value in the first half of the
rank-ordered data set.
• Q2 is the median value in the set.
• Q3 is the "middle" value in the second half of the
rank-ordered data set.
FORMULA
• INTERQUARTILE RANGE
IQR = Q3 - Q1
STEPS IN GETTING THE IQR
1: Put the numbers in order.
EXAMPLE:
1, 2, 5, 6, 7, 9, 12, 15, 18, 19, 27.
2: Find the median.
1, 2, 5, 6, 7, 9, 12, 15, 18, 19, 27.
STEPS IN GETTING THE IQR
3: Place parentheses around the numbers
above and below the median.
Not necessary statistically, but it makes Q1
and Q3 easier to spot.
(1, 2, 5, 6, 7), 9, (12, 15, 18, 19, 27).
4: Find Q1 and Q3
Think of Q1 as a median in the lower half of
the data and think of Q3 as a median for the
upper half of data.
(1, 2, 5, 6, 7), 9, ( 12, 15, 18, 19, 27).
Q1 = 5 and Q3 = 18.
STEPS IN GETTING THE IQR
5: Subtract Q1 from Q3 to find
the interquartile range.
18 – 5 = 13.
Odd Set of Numbers:
Sample question: Find the IQR for the following data
set: 3, 5, 7, 8, 9, 11, 15, 16, 20, 21.
Step 1: Put the numbers in order.
3, 5, 7, 8, 9, 11, 15, 16, 20, 21.
Step 2: Make a mark in the center of the
data:
3, 5, 7, 8, 9, | 11, 15, 16, 20, 21.
Odd Set of Numbers:
Step 3: Place parentheses around the numbers above
and below the mark you made in Step 2–it makes Q1 and
Q3 easier to spot.
(3, 5, 7, 8, 9), | (11, 15, 16, 20, 21).
Step 4: Find Q1 and Q3
Q1 is the median (the middle) of the lower half of
the data, and Q3 is the median (the middle) of the
upper half of the data.
(3, 5, 7, 8, 9), | (11, 15, 16, 20, 21).
Q1 = 7 and Q3 = 16.
Odd Set of Numbers:
Step 5: Subtract Q1 from Q3.
16 – 7 = 9.
This is your IQR.
QUARTILE DEVIATION
• The semi interquartile range (SIR)
(also called the quartile deviation) is a
measure of spread. It tells you
something about how data is
dispersed around a central point
(usually the mean). The difference of
Q3−Q1 divided by 22
FORMULA
STEPS
Example:
Question: Find the Quartile Deviation for the
following set of data:
{490, 540, 590, 600, 620, 650, 680, 770, 830,
840, 890, 900}
Step 1: Find the first quartile, Q1.
This is the median of the lower half of the set
{490, 540, 590, 600, 620, 650}.
Q1 = (590 + 600) / 2 = 595.
STEPS
Step 2: Find the third quartile, Q3.
This is the median of the upper half of the set
{680, 770, 830, 840, 890, 900}.
Q3 = (830 + 840) / 2 = 835.
Step 3: Subtract Step 1 from Step 2.
835 – 595 = 240.
Step 4: Divide by 2. 240 / 2 = 120
The quartile deviation for this set of data is 12.
AVERAGE DEVIATION
• A measure of absolute
dispersion that is affected by
every individual score.
FORMULA FOR AVERAGE
DEVIATION
Σ/x-x̅ /
A.D=
n-1
Where A.D= average
deviation
n = total number of
scores
x = individual scores
x̅ =mean of all scores
EXAMPLE:
Calculation of Average
Deviation from Sample Raw scores
of Eight Students in Statistics and 9
students in Psychology
STATISTICS PSYCHOLOGY
X /X- x̅ / X /X- x̅ /
17 -10 15 -11.67
17 -10 19 -7.67
26 -1 20 -6.67
28 1 24 -2.67
30 3 28 1.33
30 3 30 3.33
31 4 32 5.33
37 10 32 5.33
216 42 40 13.33
240 57.33
• STATISTICS: PSYCHOLOGY:
226 240
x̅ = x̅ =
8 9
x̅ = 27 x̅ = 26.67
• AVERAGE DEVIATION:
Σ / X - x̅ /
AD=
n-1
STATISTICS: PSYCHOLOGY:
42 57.33
AD= AD =
8-1 9-1
AD = 6 AD = 7. 17
VARIANCE
• The Variance is a measure of
variability that considers the position
of each observation relative to the
mean of the set of scores.
Σ( x - x̅ )2
• Sample variance (s2
) =
n-1
• Where: x = individual score
x̅ = mean of the set of score
n = sample size
s2
= variance
Calculation of the Variance from Sample Raw
Scores of 8 students in Statistics
x (X-x̅ ) (x- x̅ )2
17 -10 100
17 -10 100
26 -1 1
28 1 1
30 3 9
30 3 9
31 4 16
37 10 100
Σ( x - x̅ )2
S2=
n-1
336
S2 =
8-1
S2 = 48
STANDARD DEVIATION
• The Standard deviation (SD) is the measure of
variability that measures all the scores in the
distribution rather than through extreme
scores.
• The standard deviation is simply the square
root of the variance.
FORMULA FOR SD
Σ( x - x̅ )2
S2=
n- 1
Where: SD = Standard deviation
x = individual scores
x̅ = mean of scores
n = total number of scores
Calculation of the Variance from Sample Raw
Scores of 8 students in Statistics
x (X-x̅ ) (x- x̅ )2
17 -10 100
17 -10 100
26 -1 1
28 1 1
30 3 9
30 3 9
31 4 16
37 10 100
Σ( x - x̅ )2
SD=
n-1
336
SD =
8-1
SD = 48
THE END !!!

Measures of-variation

  • 2.
  • 3.
    Measures of variation -Measuresof variation are used to describe the distribution of the data.
  • 4.
    Range -The range isthe difference between the greatest and least data values. FORMULA: R= H-L
  • 5.
    FIND THE RANGE •GIVEN: TEST SCORES OF 40 STUDENTS IN STATISTICS 30 33 54 44 53 49 46 44 32 35 57 43 56 50 45 43 31 34 51 39 52 49 46 42 28 33 52 41 51 45 47 44 27 34 53 36 48 42 37 38
  • 6.
    STEPS IN FINDINGTHE RANGE 1. Arrange the data/number from least value to greatest value. EXAMPLE: 27,28,30,31,32,33,33,34,34,35,36,37,38,39,41,4 2,42,43,43,44,44,44,45,45,46,46,47,48,49,49,50 ,51,51,52, 52,53,53,54,56,5757
  • 7.
    STEPS IN FINDINGTHE RANGE 2. Find the RANGE FORMULA: R= H-L SOLUTION: R= 57- 27 = 30
  • 8.
    INTERQUARTILE • The interquartilerange (IQR) is a measure of variability, based on dividing a data set into quartiles.
  • 9.
    QUARTILES -Quartiles divide arank-ordered data set into four equal parts. The values that divide each part are called the first, second, and third quartiles; and they are denoted by Q1, Q2, and Q3, respectively. • Q1 is the "middle" value in the first half of the rank-ordered data set. • Q2 is the median value in the set. • Q3 is the "middle" value in the second half of the rank-ordered data set.
  • 10.
  • 11.
    STEPS IN GETTINGTHE IQR 1: Put the numbers in order. EXAMPLE: 1, 2, 5, 6, 7, 9, 12, 15, 18, 19, 27. 2: Find the median. 1, 2, 5, 6, 7, 9, 12, 15, 18, 19, 27.
  • 12.
    STEPS IN GETTINGTHE IQR 3: Place parentheses around the numbers above and below the median. Not necessary statistically, but it makes Q1 and Q3 easier to spot. (1, 2, 5, 6, 7), 9, (12, 15, 18, 19, 27). 4: Find Q1 and Q3 Think of Q1 as a median in the lower half of the data and think of Q3 as a median for the upper half of data. (1, 2, 5, 6, 7), 9, ( 12, 15, 18, 19, 27). Q1 = 5 and Q3 = 18.
  • 13.
    STEPS IN GETTINGTHE IQR 5: Subtract Q1 from Q3 to find the interquartile range. 18 – 5 = 13.
  • 14.
    Odd Set ofNumbers: Sample question: Find the IQR for the following data set: 3, 5, 7, 8, 9, 11, 15, 16, 20, 21. Step 1: Put the numbers in order. 3, 5, 7, 8, 9, 11, 15, 16, 20, 21. Step 2: Make a mark in the center of the data: 3, 5, 7, 8, 9, | 11, 15, 16, 20, 21.
  • 15.
    Odd Set ofNumbers: Step 3: Place parentheses around the numbers above and below the mark you made in Step 2–it makes Q1 and Q3 easier to spot. (3, 5, 7, 8, 9), | (11, 15, 16, 20, 21). Step 4: Find Q1 and Q3 Q1 is the median (the middle) of the lower half of the data, and Q3 is the median (the middle) of the upper half of the data. (3, 5, 7, 8, 9), | (11, 15, 16, 20, 21). Q1 = 7 and Q3 = 16.
  • 16.
    Odd Set ofNumbers: Step 5: Subtract Q1 from Q3. 16 – 7 = 9. This is your IQR.
  • 17.
    QUARTILE DEVIATION • Thesemi interquartile range (SIR) (also called the quartile deviation) is a measure of spread. It tells you something about how data is dispersed around a central point (usually the mean). The difference of Q3−Q1 divided by 22
  • 18.
  • 19.
    STEPS Example: Question: Find theQuartile Deviation for the following set of data: {490, 540, 590, 600, 620, 650, 680, 770, 830, 840, 890, 900} Step 1: Find the first quartile, Q1. This is the median of the lower half of the set {490, 540, 590, 600, 620, 650}. Q1 = (590 + 600) / 2 = 595.
  • 20.
    STEPS Step 2: Findthe third quartile, Q3. This is the median of the upper half of the set {680, 770, 830, 840, 890, 900}. Q3 = (830 + 840) / 2 = 835. Step 3: Subtract Step 1 from Step 2. 835 – 595 = 240. Step 4: Divide by 2. 240 / 2 = 120 The quartile deviation for this set of data is 12.
  • 21.
    AVERAGE DEVIATION • Ameasure of absolute dispersion that is affected by every individual score.
  • 22.
    FORMULA FOR AVERAGE DEVIATION Σ/x-x̅/ A.D= n-1 Where A.D= average deviation n = total number of scores x = individual scores x̅ =mean of all scores
  • 23.
    EXAMPLE: Calculation of Average Deviationfrom Sample Raw scores of Eight Students in Statistics and 9 students in Psychology
  • 24.
    STATISTICS PSYCHOLOGY X /X-x̅ / X /X- x̅ / 17 -10 15 -11.67 17 -10 19 -7.67 26 -1 20 -6.67 28 1 24 -2.67 30 3 28 1.33 30 3 30 3.33 31 4 32 5.33 37 10 32 5.33 216 42 40 13.33 240 57.33
  • 25.
    • STATISTICS: PSYCHOLOGY: 226240 x̅ = x̅ = 8 9 x̅ = 27 x̅ = 26.67
  • 26.
    • AVERAGE DEVIATION: Σ/ X - x̅ / AD= n-1 STATISTICS: PSYCHOLOGY: 42 57.33 AD= AD = 8-1 9-1 AD = 6 AD = 7. 17
  • 27.
    VARIANCE • The Varianceis a measure of variability that considers the position of each observation relative to the mean of the set of scores.
  • 28.
    Σ( x -x̅ )2 • Sample variance (s2 ) = n-1 • Where: x = individual score x̅ = mean of the set of score n = sample size s2 = variance
  • 29.
    Calculation of theVariance from Sample Raw Scores of 8 students in Statistics x (X-x̅ ) (x- x̅ )2 17 -10 100 17 -10 100 26 -1 1 28 1 1 30 3 9 30 3 9 31 4 16 37 10 100
  • 30.
    Σ( x -x̅ )2 S2= n-1 336 S2 = 8-1 S2 = 48
  • 31.
    STANDARD DEVIATION • TheStandard deviation (SD) is the measure of variability that measures all the scores in the distribution rather than through extreme scores. • The standard deviation is simply the square root of the variance.
  • 32.
    FORMULA FOR SD Σ(x - x̅ )2 S2= n- 1 Where: SD = Standard deviation x = individual scores x̅ = mean of scores n = total number of scores
  • 33.
    Calculation of theVariance from Sample Raw Scores of 8 students in Statistics x (X-x̅ ) (x- x̅ )2 17 -10 100 17 -10 100 26 -1 1 28 1 1 30 3 9 30 3 9 31 4 16 37 10 100
  • 34.
    Σ( x -x̅ )2 SD= n-1 336 SD = 8-1 SD = 48
  • 35.