Download to read offline

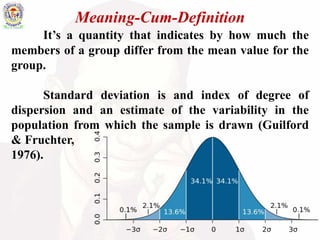


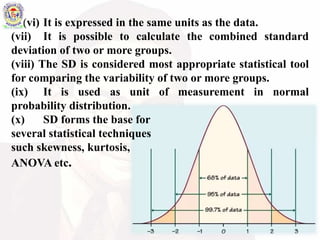


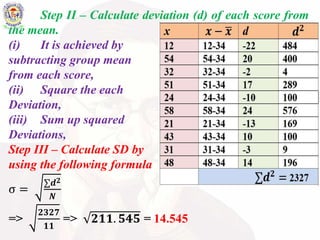


The document discusses standard deviation (SD) as a measure of variability in a data set, detailing its definition, significance in statistics, and characteristics such as its relationship with mean values. It provides methods for computing SD for ungrouped and grouped data along with examples. Additionally, it addresses how SD indicates data dispersion and its application in statistical techniques.