Download as ODP, PPTX

![3
1. Beavers et al. (2013). Practical considerations for using exploratory
factor analysis in educational research. [Online]
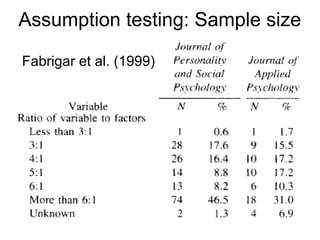
2. Fabrigar et al. (1999).
Evaluating the use of exploratory factor analysis in psychological
research. [Online]
3. Howitt & Cramer (2014).
Ch 31: Factor analysis: Simplifying complex data.
[Textbook/eReserve]
4. Streiner (1994). Figuring out factors: The use and misuse of factor
analysis. [Online]
5. Tabachnick & Fidell (2007).
Principal components and factor analysis. [eReserve]
6. Williams, Brown, & Osman (2012).
Exploratory factor analysis: A five-step guide for novices. [Online]
7. Wikiversity (2017). Exploratory factor analysis: Glossary. [Online]
Readings](https://image.slidesharecdn.com/exploratory-factor-analysis-1206420594617863-4/85/Exploratory-factor-analysis-3-320.jpg)
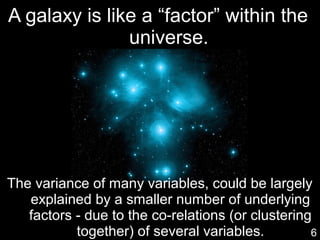
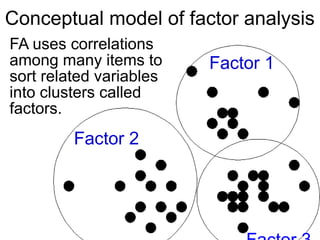
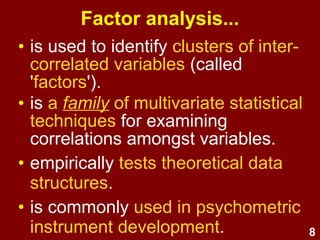
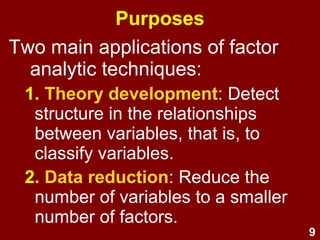
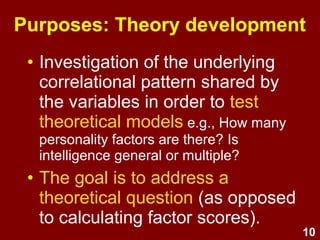
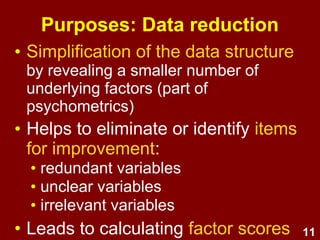
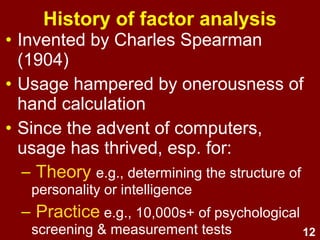
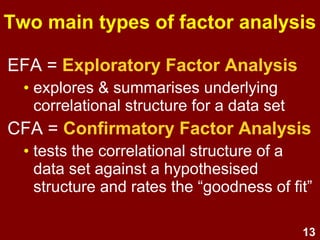
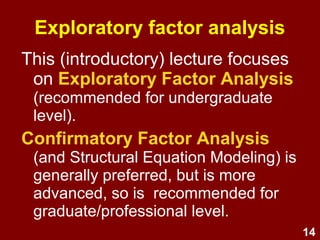

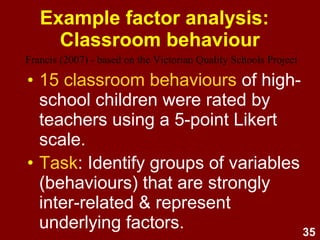
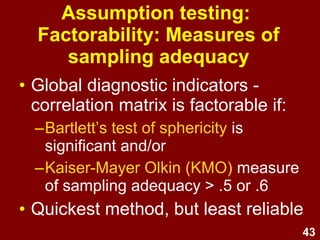
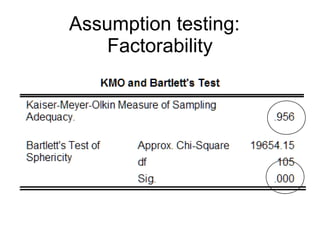
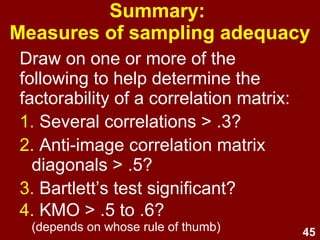

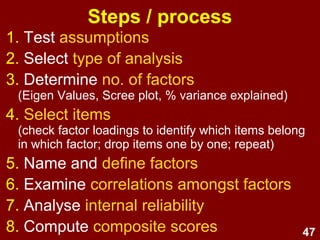


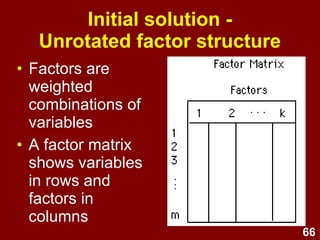

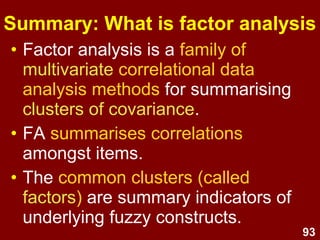
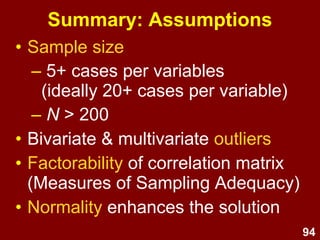
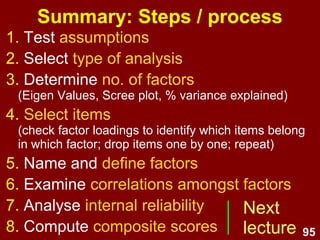
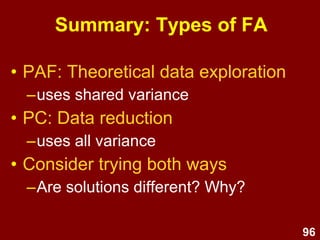
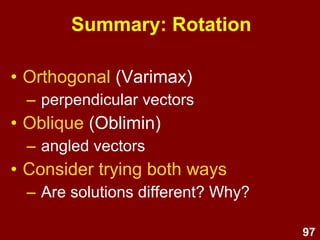
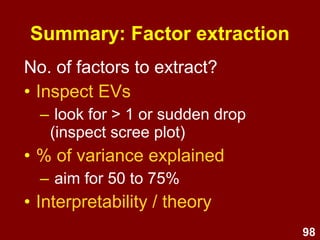

The document is a lecture on exploratory factor analysis (EFA) in psychology, detailing its purpose in identifying clusters of inter-correlated variables and aiding in theory development and data reduction. It presents historical context, examples of EFA applications, and outlines the steps to carry out the analysis. Additionally, it discusses the assumptions necessary for conducting EFA and differentiates between exploratory and confirmatory factor analysis.


