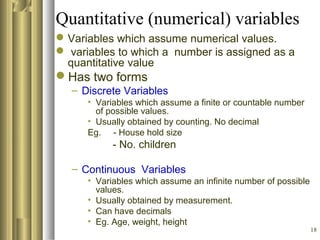
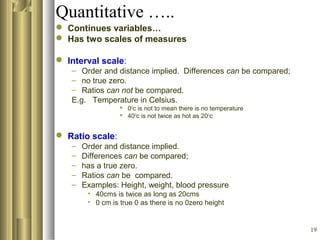
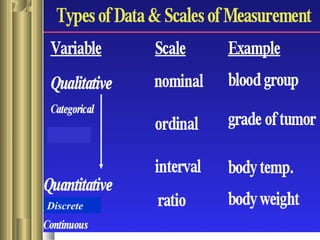
1
Introduction to
Biostatistics
Introduction to
Biostatistics
Lecture by:
Gurmesa Tura (MPH)
March 2011
AAU
2
Objectives
At the end of this lecture the students will
be able to:
Define statistics & Biostatistics
Explain the roles of statistics in medicine
Describe the types of data and scales of
measurement
 Identify different methods of data collection
3
Contents
Definition
Types of statistics
Roles of statistics
Types of data & scales of measurement
Data collection methods
4
What is statistics?
The scientific study of numerical
data based on variation in nature.
(Sokal and Rohlf)
A set of procedures and rules for
reducing large masses of data into
manageable proportions allowing
us to draw conclusions from those
data. (McCarthy)
5
Statistics…
Statistics is the art and science of
making decisions in the face of
uncertainty
Statistics is the science of collecting,
summarizing, presenting, interpreting
data, and of using them to test
hypotheses.
Biostatistics is statistics applied to
biological and health problems
6
What are statistical data?
Observation: information obtained from
a single person
Data: information gathered from group
of people
Statistical data: raw materials or facts
of any statistical observations arising
when ever measurements are made or
observations are classified
7
Types of statistics
Descriptive Statistics
– Collection,
– organization,
– summarization, and
– presentation of data.
Inferential Statistics
– Generalizing from samples to populations
using probabilities.
– Performing hypothesis testing,
– Determining relationships between variables,
– Making predictions.
8
Why study statistics in medicine?
Medicine and epidemiology are
becoming increasingly quantitative
Knowledge of statistics is required
to design, conduct and analyse
medical researches
Helps for better understanding of
medical literature
9
Roles of statistics
In clinical medicine
– Making clinical diagnosis
– Determining Rx and prognosis
– Handling variations (defining normal values
and normal ranges)
In public health
– Community diagnosis
In Research
– Designing and undertaking clinical & public
health research
10
Uses of statistics
1. Collecting data in the best possible
way
2. Describing a characteristics of a group
or population
3. Analyzing and interpreting data
4. Making generalization about
populations based on studies of
samples
11
Limitations of statistics
1. Statistics doesn’t deal with single (individual)
value.
– It deals only with aggregate values
1. Statistics can’t deal with qualitative
characteristics
– Deals with data which can be quantified
1. Statistical conclusions are not universally
true
– Context specific
1. Statistical interpretations require high degree
of skill & understanding of the subject.
12
Types of data
 Based on source :
– Primary & secondary data
1. Primary data
• Data collected by the investigator for
the purpose of specific study
• Original in character
• Mostly generated by surveys
• Complete, reliable and more accurate
13
Types of data…
2. Secondary data
When the investigator uses data which have
been collected by others for other purpose
Obtained from Journals, reports, Gov’t
publications etc
Less expensive (less money & time)
May be incomplete, less quality, less valid
14
Scales of measurement
 Variable is any aspect of an
individual or thing that is
measured and can take any value
for different individuals or cases
 Divided in to two
1. Qualitative (categorical) variable &
2. Quantitative (numerical) variables
15
Qualitative (categorical) variable
A variable which can not be
measured in quantitative
(numerical) form but can only be
identified by names.
It has two forms based on scales of
measurement
– Nominal
– Ordinal
16
Nominal scale
Represent categories or names
There is no orders in the categories
It has two forms:
– Dichotomous- has 2 value categories
• E.g. Sex: Male or Female
• Immunization: yes or No
• Diseases outcome : Died or survived
– Multichotomous: >two categories
• E.g.
– Blood group: A, B, AB or O
– Marital status: single, married, divorced or
widowed
17
Ordinal scale
Have order in the response categories
But, the distance or interval between categories
are not necessarily equal
– E.g Immunization status:
• Not immunized,
• Partially immunized
• Fully immunized
• Disease state
• Mild
• Moderate
• Severe
• Agreement questions
• Strongly agree
• Agree
• Indifferent
• Disagree
• Strongly disagree
18
Quantitative (numerical) variables
Variables which assume numerical values.
 variables to which a number is assigned as a
quantitative value
Has two forms
– Discrete Variables
• Variables which assume a finite or countable number
of possible values.
• Usually obtained by counting. No decimal
Eg. - House hold size
- No. children
– Continuous Variables
• Variables which assume an infinite number of possible
values.
• Usually obtained by measurement.
• Can have decimals
• Eg. Age, weight, height
19
Quantitative …..
 Continues variables…
 Has two scales of measures
 Interval scale:
– Order and distance implied. Differences can be compared;
– no true zero.
– Ratios can not be compared.
E.g. Temperature in Celsius.
 0O
c is not to mean there is no temperature
 40O
c is not twice as hot as 20O
c
 Ratio scale:
– Order and distance implied.
– Differences can be compared;
– has a true zero.
– Ratios can be compared.
– Examples: Height, weight, blood pressure
• 40cms is twice as long as 20cms
• 0 cm is true 0 as there is no 0zero height
20
Discrete
21
Data collection
The process of obtaining statistical data
Before any statistical work can be done
data must be collected
Collecting Primary data
– Observation
– Interview
– Use of self administered questionnaire
Collecting secondary data
– Use of documentary sources
22
Observation
Systematically selecting , watching and
recording behaviours of people or other
phenomena and aspects of the settings in
which they occur
For the purpose of obtaining specified
observation
Includes
– Visual observation
– Radiographic, Biomedical, x-ray,
microscope, clinical examinations, etc
23
Observation…
It can also be used In observing
behaviour of people, culture etc.
It could be
– Participant observation or
– Non-participant observation
24
Observation…
Advantage
– More accurate data on behaviour or
activity
Disadvantages
– Observer bias
– Prejudice
– Desirability bias
– Needs skilled human power in high
level machines
25
Interviews
Face to face interview
Telephone interview
Group interview or Focused Group Discussion
(FGD)
Self administered questionnaire
Mailed questionnaire
Computer interview
26
Face to face interview
Advantage
– Permits detailed & in-depth questions &
responses
– Minimizes non-response
Disadvantage
– Costly
– Interviewer bias
– Investigator bias
– Interviewer cheating
27
Telephone interview
Advantage
– Convenient
– Saves time
– Relatively inexpensive
– Less interviewer & investigator bias than
personal interview
Disadvantage
– Non-coverage
– Limited length & depth of questions and
responses
28
Self-administered Questionnaire
Advantage
– Cost effective for large areas
– Minimizes interviewer bias
– Promotes accurate answers
– Sensitive issues can be gathered
Disadvantage
– Low response rates
– Unanswered questions
– Incorrect answers
29
Mailed questionnaire
Advantage
– Allows collecting data with out
personal presence
Disadvantage
– Low response rate
– Not applicable for illiterates
– Low coverage in rural areas
30
Use of documentary sources
These include
– Clinical & other personal records
– Vital statistics
– Census data
Sources
– Official publications of CSA
– Publications of MOH & other ministries
– News papers & journals
– International publications (WHO, UNICEF,
etc)
– Health facilities’ records
31
Choosing method of data collection
Choosing which method(s) of data
collection depends on:
– Type of data we need
– Resources (time, personnel & facility)
– Accuracy & strength of the method
– Acceptability of the method by the
subjects
– Back ground of study subjects
– Etc
32
Thank you!

1.introduction

  • 1.
  • 2.
    2 Objectives At the endof this lecture the students will be able to: Define statistics & Biostatistics Explain the roles of statistics in medicine Describe the types of data and scales of measurement  Identify different methods of data collection
  • 3.
    3 Contents Definition Types of statistics Rolesof statistics Types of data & scales of measurement Data collection methods
  • 4.
    4 What is statistics? Thescientific study of numerical data based on variation in nature. (Sokal and Rohlf) A set of procedures and rules for reducing large masses of data into manageable proportions allowing us to draw conclusions from those data. (McCarthy)
  • 5.
    5 Statistics… Statistics is theart and science of making decisions in the face of uncertainty Statistics is the science of collecting, summarizing, presenting, interpreting data, and of using them to test hypotheses. Biostatistics is statistics applied to biological and health problems
  • 6.
    6 What are statisticaldata? Observation: information obtained from a single person Data: information gathered from group of people Statistical data: raw materials or facts of any statistical observations arising when ever measurements are made or observations are classified
  • 7.
    7 Types of statistics DescriptiveStatistics – Collection, – organization, – summarization, and – presentation of data. Inferential Statistics – Generalizing from samples to populations using probabilities. – Performing hypothesis testing, – Determining relationships between variables, – Making predictions.
  • 8.
    8 Why study statisticsin medicine? Medicine and epidemiology are becoming increasingly quantitative Knowledge of statistics is required to design, conduct and analyse medical researches Helps for better understanding of medical literature
  • 9.
    9 Roles of statistics Inclinical medicine – Making clinical diagnosis – Determining Rx and prognosis – Handling variations (defining normal values and normal ranges) In public health – Community diagnosis In Research – Designing and undertaking clinical & public health research
  • 10.
    10 Uses of statistics 1.Collecting data in the best possible way 2. Describing a characteristics of a group or population 3. Analyzing and interpreting data 4. Making generalization about populations based on studies of samples
  • 11.
    11 Limitations of statistics 1.Statistics doesn’t deal with single (individual) value. – It deals only with aggregate values 1. Statistics can’t deal with qualitative characteristics – Deals with data which can be quantified 1. Statistical conclusions are not universally true – Context specific 1. Statistical interpretations require high degree of skill & understanding of the subject.
  • 12.
    12 Types of data Based on source : – Primary & secondary data 1. Primary data • Data collected by the investigator for the purpose of specific study • Original in character • Mostly generated by surveys • Complete, reliable and more accurate
  • 13.
    13 Types of data… 2.Secondary data When the investigator uses data which have been collected by others for other purpose Obtained from Journals, reports, Gov’t publications etc Less expensive (less money & time) May be incomplete, less quality, less valid
  • 14.
    14 Scales of measurement Variable is any aspect of an individual or thing that is measured and can take any value for different individuals or cases  Divided in to two 1. Qualitative (categorical) variable & 2. Quantitative (numerical) variables
  • 15.
    15 Qualitative (categorical) variable Avariable which can not be measured in quantitative (numerical) form but can only be identified by names. It has two forms based on scales of measurement – Nominal – Ordinal
  • 16.
    16 Nominal scale Represent categoriesor names There is no orders in the categories It has two forms: – Dichotomous- has 2 value categories • E.g. Sex: Male or Female • Immunization: yes or No • Diseases outcome : Died or survived – Multichotomous: >two categories • E.g. – Blood group: A, B, AB or O – Marital status: single, married, divorced or widowed
  • 17.
    17 Ordinal scale Have orderin the response categories But, the distance or interval between categories are not necessarily equal – E.g Immunization status: • Not immunized, • Partially immunized • Fully immunized • Disease state • Mild • Moderate • Severe • Agreement questions • Strongly agree • Agree • Indifferent • Disagree • Strongly disagree
  • 18.
    18 Quantitative (numerical) variables Variableswhich assume numerical values.  variables to which a number is assigned as a quantitative value Has two forms – Discrete Variables • Variables which assume a finite or countable number of possible values. • Usually obtained by counting. No decimal Eg. - House hold size - No. children – Continuous Variables • Variables which assume an infinite number of possible values. • Usually obtained by measurement. • Can have decimals • Eg. Age, weight, height
  • 19.
    19 Quantitative …..  Continuesvariables…  Has two scales of measures  Interval scale: – Order and distance implied. Differences can be compared; – no true zero. – Ratios can not be compared. E.g. Temperature in Celsius.  0O c is not to mean there is no temperature  40O c is not twice as hot as 20O c  Ratio scale: – Order and distance implied. – Differences can be compared; – has a true zero. – Ratios can be compared. – Examples: Height, weight, blood pressure • 40cms is twice as long as 20cms • 0 cm is true 0 as there is no 0zero height
  • 20.
  • 21.
    21 Data collection The processof obtaining statistical data Before any statistical work can be done data must be collected Collecting Primary data – Observation – Interview – Use of self administered questionnaire Collecting secondary data – Use of documentary sources
  • 22.
    22 Observation Systematically selecting ,watching and recording behaviours of people or other phenomena and aspects of the settings in which they occur For the purpose of obtaining specified observation Includes – Visual observation – Radiographic, Biomedical, x-ray, microscope, clinical examinations, etc
  • 23.
    23 Observation… It can alsobe used In observing behaviour of people, culture etc. It could be – Participant observation or – Non-participant observation
  • 24.
    24 Observation… Advantage – More accuratedata on behaviour or activity Disadvantages – Observer bias – Prejudice – Desirability bias – Needs skilled human power in high level machines
  • 25.
    25 Interviews Face to faceinterview Telephone interview Group interview or Focused Group Discussion (FGD) Self administered questionnaire Mailed questionnaire Computer interview
  • 26.
    26 Face to faceinterview Advantage – Permits detailed & in-depth questions & responses – Minimizes non-response Disadvantage – Costly – Interviewer bias – Investigator bias – Interviewer cheating
  • 27.
    27 Telephone interview Advantage – Convenient –Saves time – Relatively inexpensive – Less interviewer & investigator bias than personal interview Disadvantage – Non-coverage – Limited length & depth of questions and responses
  • 28.
    28 Self-administered Questionnaire Advantage – Costeffective for large areas – Minimizes interviewer bias – Promotes accurate answers – Sensitive issues can be gathered Disadvantage – Low response rates – Unanswered questions – Incorrect answers
  • 29.
    29 Mailed questionnaire Advantage – Allowscollecting data with out personal presence Disadvantage – Low response rate – Not applicable for illiterates – Low coverage in rural areas
  • 30.
    30 Use of documentarysources These include – Clinical & other personal records – Vital statistics – Census data Sources – Official publications of CSA – Publications of MOH & other ministries – News papers & journals – International publications (WHO, UNICEF, etc) – Health facilities’ records
  • 31.
    31 Choosing method ofdata collection Choosing which method(s) of data collection depends on: – Type of data we need – Resources (time, personnel & facility) – Accuracy & strength of the method – Acceptability of the method by the subjects – Back ground of study subjects – Etc
  • 32.