![SOC2002: Sociological Analysis and Research Methods LECTURE 11: Data Analysis (1) Quantitative data analysis and SPSS Lecturer: Bonnie Green [email_address]](https://image.slidesharecdn.com/soc2002-lecture-11-1210411047876776-8/85/SOC2002-Lecture-11-1-320.jpg)
![SOC2002: Sociological Analysis and Research Methods LECTURE 11: Data Analysis (1) Quantitative data analysis and SPSS Lecturer: Bonnie Green [email_address]](https://image.slidesharecdn.com/soc2002-lecture-11-1210411047876776-8/75/SOC2002-Lecture-11-1-2048.jpg)
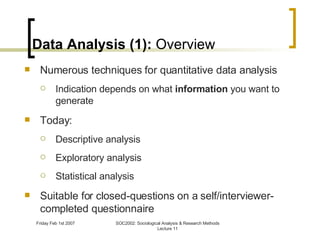
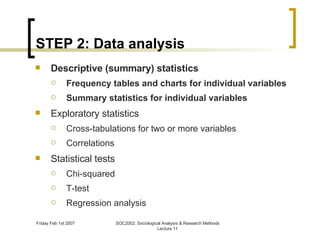
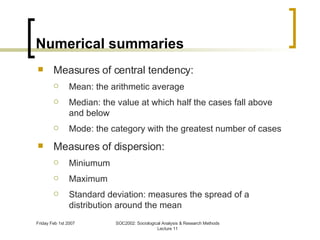
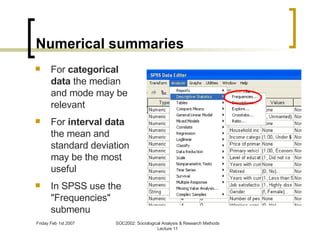
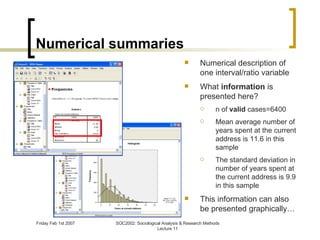
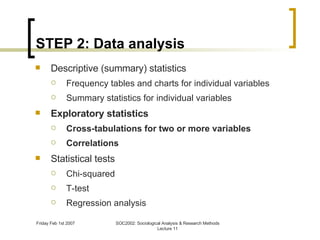
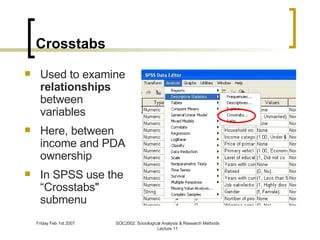
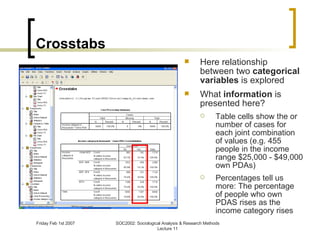
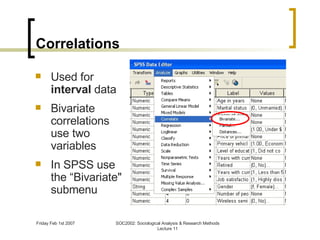
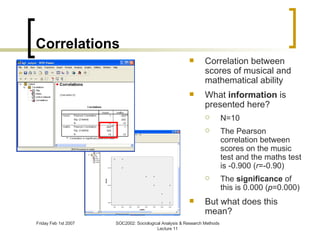
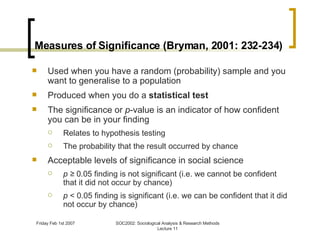
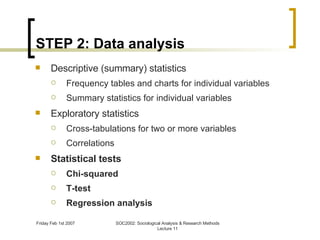
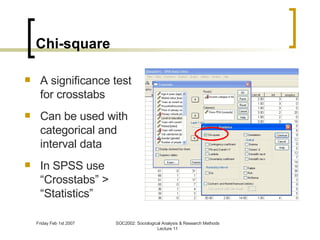
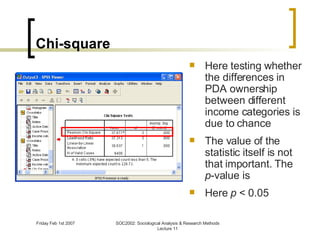
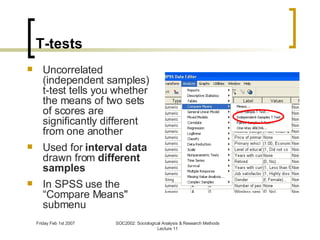
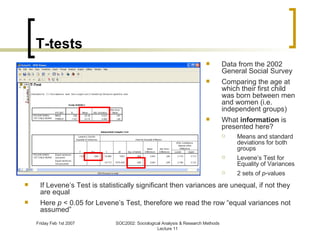
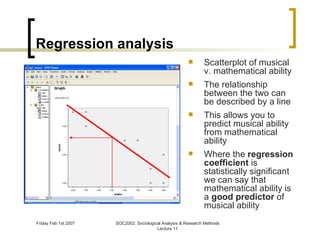
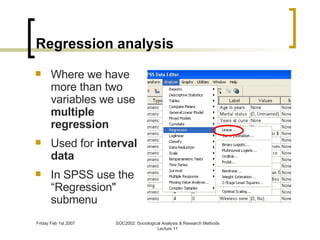
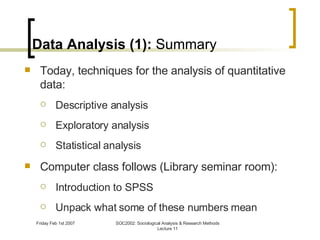

The document discusses various techniques for quantitative data analysis, including descriptive analysis, exploratory analysis, and statistical analysis. Descriptive analysis involves frequency tables, charts, and summary statistics to describe individual and groups of variables. Exploratory analysis examines relationships between two or more variables using cross-tabulations and correlations. Statistical analysis tests for significant relationships using techniques like chi-squared tests, t-tests, and regression analysis. The remainder of the document provides examples and explanations of these analytical methods.


