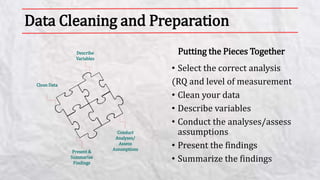
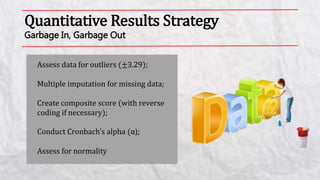
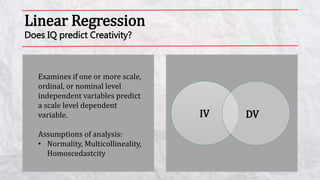
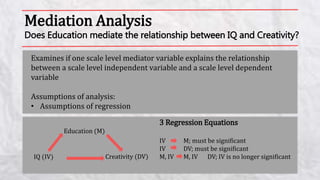
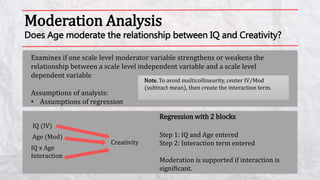
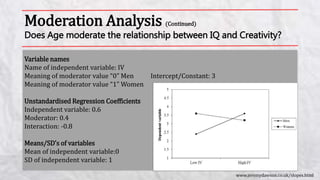
Quantitative Analysis
June 25th, 2014 By Dr. James Lani Statistics Solutions
Data Cleaning and Preparation
• Select the correct analysis
(RQ and level of measurement
• Clean your data
• Describe variables
• Conduct the analyses/assess
assumptions
• Present the findings
• Summarize the findings
Putting the Pieces TogetherDescribe
Variables
Clean Data
Present &
Summarize
Findings
Conduct
Analyses/
Assess
Assumptions
Quantitative Results Strategy
Garbage In, Garbage Out
Assess data for outliers (±3.29);
Multiple imputation for missing data;
Create composite score (with reverse
coding if necessary);
Conduct Cronbach’s alpha (α);
Assess for normality
Descriptive Statistics
Means & Standard Deviations, Frequency & Percentages
Variable n %
Location
Urban 72 48.0
Rural 78 52.0
Ethnicity
White 36 24.0
Hispanic 13 28.7
Other 71 47.3
Table 1
Frequencies and Percentages for Nominal Variables
Chi-Square
Goodness of Fit & Test of Independence
Chi-square analysis answers
what research questions?
Assumptions of analysis:
• Each cell has count of 1;
• 80% of cells have an
expected value of 5.
Conducting analysis;
Presenting findings;
Write up in narrative;
Tables and figures.
Republican Democrat Green Independent Libertarian
X X X X X
Repub. Democrat Green Indep. Libert.
Male X X X X X
Female X X X X X
Pearson Correlation
Examines the
relationship
between two or
more scales level
variables
Assumptions of the
analysis:
• Linearity
• Homoscedacity
• Normality
Assumptions
Linear
Non-Linear
Homoscedasticity Met
Heteroscedasticity
Normal
Non-normal
Independent Samples t-test
Let’s look at differences in IQ by Gender
Examines mean differences on
a scale level dependent
variable by a dichotomous
nominal level independent
variable.
Assumptions of analysis:
• Homogeneity of variance
• Normality
Males Females
Part 1=1 Part 4=2
Part 2=2 Part 5=3
Part 3=3 Part 6=4
X=2 X=3
Males Females
Part 1=1.9 Part 4=2.9
Part 2=2.0 Part 5=3.0
Part 3=2.1 Part 6=3.1
X=2 X=3
One-Way ANOVA
Let’s look at differences on Scores by Political Affiliation
Examines mean differences on
a scale level dependent
variable by a dichotomous
nominal level independent
variable.
Assumptions of analysis:
• Homogeneity of variance
• Normality
Males Females Independent
Part 1=1.9 Part 4=2.9 Part 7=3.9
Part 2=2.0 Part 5=3.0 Part 8=6.0
Part 3=2.1 Part 6=3.1 Part 9=8.1
X=2 X=3 X=6
Dependent Samples t-test
Let’s look at differences between science scores Pretest vs. Posttest
Examines the mean difference between two paired scale level variables.
Assumptions of analysis:
• Normality
Science Pretest Science Posttest
Part 1=1 Part 1=2
Part 2=2 Part 2=3
Part 3=3 Part 3=4
X=2 X=3
Science Pretest Science Posttest
Part 1=1.9 Part 1=2.9
Part 2=2.0 Part 2=3.0
Part 3=2.1 Part 3=3.1
X=2 X=3
Repeated-Measures ANOVA
Let’s look at differences among test scores Pretest vs. Posttest vs. Follow Up
Examines mean differences
among two or more scale level
variables
Assumptions of analyses:
• Sphericity
• Homogeneity of variance
Science
Pretest
Science
Posttest
Science
Follow-Up
Part 1=1.9 Part 1=2.9 Part 1=
Part 2=2.0 Part 2=3.0 Part 2=
Part 3=2.1 Part 3=3.1 Part 3=
X=2 X=3 X=
Linear Regression
Does IQ predict Creativity?
Examines if one or more scale,
ordinal, or nominal level
independent variables predict
a scale level dependent
variable.
Assumptions of analysis:
• Normality, Multicollineality,
Homoscedastcity
IV DV
Regressions:
Multiple, Logistic, Ordinal, Multinomial
It’s all about the level of measurement of the DV
Mediation Analysis
Does Education mediate the relationship between IQ and Creativity?
Examines if one scale level mediator variable explains the relationship
between a scale level independent variable and a scale level dependent
variable
Assumptions of analysis:
• Assumptions of regression
3 Regression Equations
IV M; must be significant
IV DV; must be significant
M, IV M, IV DV; IV is no longer significant
Education (M)
IQ (IV) Creativity (DV)
Moderation Analysis
Does Age moderate the relationship between IQ and Creativity?
Examines if one scale level moderator variable strengthens or weakens the
relationship between a scale level independent variable and a scale level
dependent variable
Assumptions of analysis:
• Assumptions of regression
Regression with 2 blocks
Step 1: IQ and Age entered
Step 2: Interaction term entered
Moderation is supported if interaction is
significant.
Age (Mod)
IQ (IV)
IQ x Age
Interaction
Creativity
Note. To avoid multicollinearity, center IV/Mod
(subtract mean), then create the interaction term.
Moderation Analysis (Continued)
Does Age moderate the relationship between IQ and Creativity?
Variable names
Name of independent variable: IV
Meaning of moderator value “0” Men Intercept/Constant: 3
Meaning of moderator value “1” Women
Unstandardised Regression Coefficients
Independent variable: 0.6
Moderator: 0.4
Interaction: -0.8
Means/SD’s of variables
Mean of independent variable:0
SD of independent variable: 1
www.jeremydawson.co.uk/slopes.html
Statistics Solutions Pro
Quantitative Analysis Made Easy!
Statistics Solutions Pro is the most
user-friendly, intuitive, statistical
analysis interpreter on the planet.
This tool is essential for all students
and researchers who need to use
statistical analyses to draw
appropriate conclusions from data.
We hope you find Statistics
Solutions Pro as beneficial and fun
to use as we do. Enjoy!
Only $299 for students
Visit
www. StatisticsSolutionsPro.com
for a free trial
I’m All Yours:
Questions and Answers
Join us August 30th in
Atlanta for our
Dissertation Workshop
https://www.statisticssolutions.com/dissertation-workshop/

Quantitative Analysis: Conducting, Interpreting, & Writing

  • 1.
    Quantitative Analysis June 25th,2014 By Dr. James Lani Statistics Solutions
  • 2.
    Data Cleaning andPreparation • Select the correct analysis (RQ and level of measurement • Clean your data • Describe variables • Conduct the analyses/assess assumptions • Present the findings • Summarize the findings Putting the Pieces TogetherDescribe Variables Clean Data Present & Summarize Findings Conduct Analyses/ Assess Assumptions
  • 3.
    Quantitative Results Strategy GarbageIn, Garbage Out Assess data for outliers (±3.29); Multiple imputation for missing data; Create composite score (with reverse coding if necessary); Conduct Cronbach’s alpha (α); Assess for normality
  • 4.
    Descriptive Statistics Means &Standard Deviations, Frequency & Percentages Variable n % Location Urban 72 48.0 Rural 78 52.0 Ethnicity White 36 24.0 Hispanic 13 28.7 Other 71 47.3 Table 1 Frequencies and Percentages for Nominal Variables
  • 5.
    Chi-Square Goodness of Fit& Test of Independence Chi-square analysis answers what research questions? Assumptions of analysis: • Each cell has count of 1; • 80% of cells have an expected value of 5. Conducting analysis; Presenting findings; Write up in narrative; Tables and figures. Republican Democrat Green Independent Libertarian X X X X X Repub. Democrat Green Indep. Libert. Male X X X X X Female X X X X X
  • 6.
    Pearson Correlation Examines the relationship betweentwo or more scales level variables Assumptions of the analysis: • Linearity • Homoscedacity • Normality Assumptions Linear Non-Linear Homoscedasticity Met Heteroscedasticity Normal Non-normal
  • 7.
    Independent Samples t-test Let’slook at differences in IQ by Gender Examines mean differences on a scale level dependent variable by a dichotomous nominal level independent variable. Assumptions of analysis: • Homogeneity of variance • Normality Males Females Part 1=1 Part 4=2 Part 2=2 Part 5=3 Part 3=3 Part 6=4 X=2 X=3 Males Females Part 1=1.9 Part 4=2.9 Part 2=2.0 Part 5=3.0 Part 3=2.1 Part 6=3.1 X=2 X=3
  • 8.
    One-Way ANOVA Let’s lookat differences on Scores by Political Affiliation Examines mean differences on a scale level dependent variable by a dichotomous nominal level independent variable. Assumptions of analysis: • Homogeneity of variance • Normality Males Females Independent Part 1=1.9 Part 4=2.9 Part 7=3.9 Part 2=2.0 Part 5=3.0 Part 8=6.0 Part 3=2.1 Part 6=3.1 Part 9=8.1 X=2 X=3 X=6
  • 9.
    Dependent Samples t-test Let’slook at differences between science scores Pretest vs. Posttest Examines the mean difference between two paired scale level variables. Assumptions of analysis: • Normality Science Pretest Science Posttest Part 1=1 Part 1=2 Part 2=2 Part 2=3 Part 3=3 Part 3=4 X=2 X=3 Science Pretest Science Posttest Part 1=1.9 Part 1=2.9 Part 2=2.0 Part 2=3.0 Part 3=2.1 Part 3=3.1 X=2 X=3
  • 10.
    Repeated-Measures ANOVA Let’s lookat differences among test scores Pretest vs. Posttest vs. Follow Up Examines mean differences among two or more scale level variables Assumptions of analyses: • Sphericity • Homogeneity of variance Science Pretest Science Posttest Science Follow-Up Part 1=1.9 Part 1=2.9 Part 1= Part 2=2.0 Part 2=3.0 Part 2= Part 3=2.1 Part 3=3.1 Part 3= X=2 X=3 X=
  • 11.
    Linear Regression Does IQpredict Creativity? Examines if one or more scale, ordinal, or nominal level independent variables predict a scale level dependent variable. Assumptions of analysis: • Normality, Multicollineality, Homoscedastcity IV DV
  • 12.
    Regressions: Multiple, Logistic, Ordinal,Multinomial It’s all about the level of measurement of the DV
  • 13.
    Mediation Analysis Does Educationmediate the relationship between IQ and Creativity? Examines if one scale level mediator variable explains the relationship between a scale level independent variable and a scale level dependent variable Assumptions of analysis: • Assumptions of regression 3 Regression Equations IV M; must be significant IV DV; must be significant M, IV M, IV DV; IV is no longer significant Education (M) IQ (IV) Creativity (DV)
  • 14.
    Moderation Analysis Does Agemoderate the relationship between IQ and Creativity? Examines if one scale level moderator variable strengthens or weakens the relationship between a scale level independent variable and a scale level dependent variable Assumptions of analysis: • Assumptions of regression Regression with 2 blocks Step 1: IQ and Age entered Step 2: Interaction term entered Moderation is supported if interaction is significant. Age (Mod) IQ (IV) IQ x Age Interaction Creativity Note. To avoid multicollinearity, center IV/Mod (subtract mean), then create the interaction term.
  • 15.
    Moderation Analysis (Continued) DoesAge moderate the relationship between IQ and Creativity? Variable names Name of independent variable: IV Meaning of moderator value “0” Men Intercept/Constant: 3 Meaning of moderator value “1” Women Unstandardised Regression Coefficients Independent variable: 0.6 Moderator: 0.4 Interaction: -0.8 Means/SD’s of variables Mean of independent variable:0 SD of independent variable: 1 www.jeremydawson.co.uk/slopes.html
  • 16.
    Statistics Solutions Pro QuantitativeAnalysis Made Easy! Statistics Solutions Pro is the most user-friendly, intuitive, statistical analysis interpreter on the planet. This tool is essential for all students and researchers who need to use statistical analyses to draw appropriate conclusions from data. We hope you find Statistics Solutions Pro as beneficial and fun to use as we do. Enjoy! Only $299 for students Visit www. StatisticsSolutionsPro.com for a free trial
  • 17.
  • 18.
    Join us August30th in Atlanta for our Dissertation Workshop https://www.statisticssolutions.com/dissertation-workshop/