Downloaded 106 times


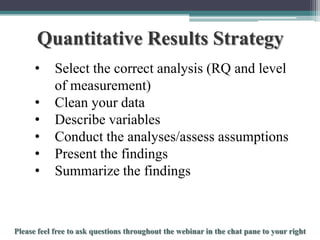
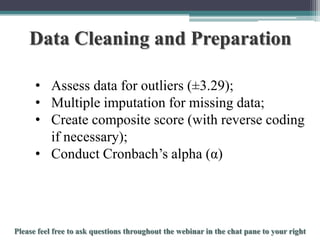
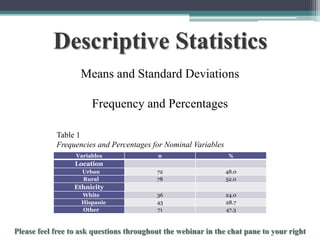
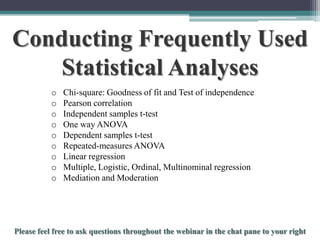
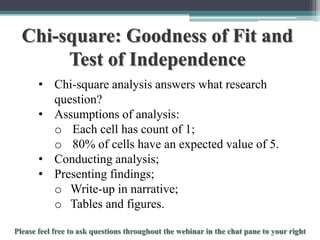

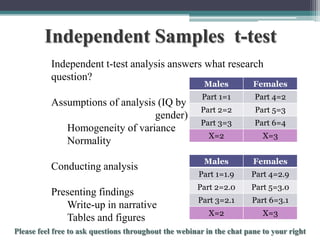
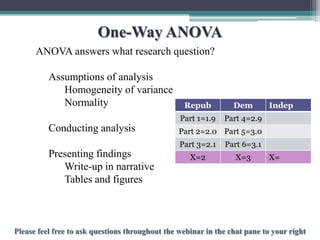
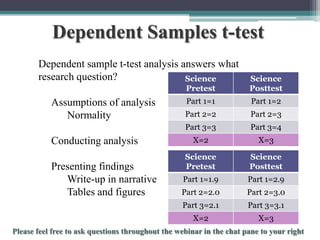
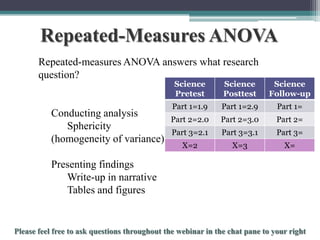
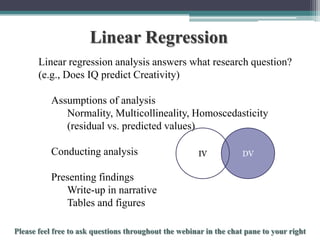
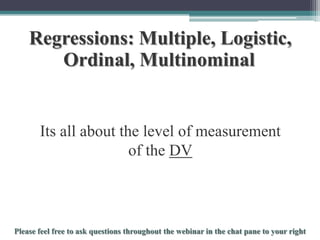

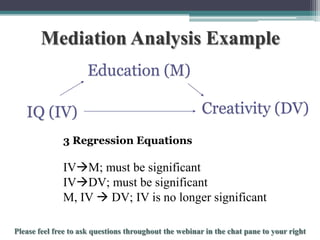
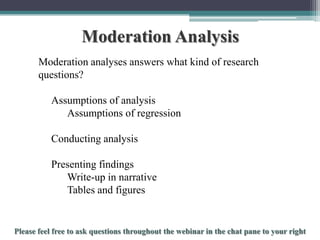


The document outlines methods for conducting and interpreting both quantitative and qualitative research results, emphasizing the importance of proper analysis techniques, data cleaning, and statistical assumptions. It covers key statistical tests such as chi-square, t-tests, ANOVA, and regression, alongside qualitative analysis methods including grounded theory and phenomenological approaches. Additionally, it offers insights on data preparation and presents findings, supporting researchers with practical guides for their work.