Downloaded 764 times
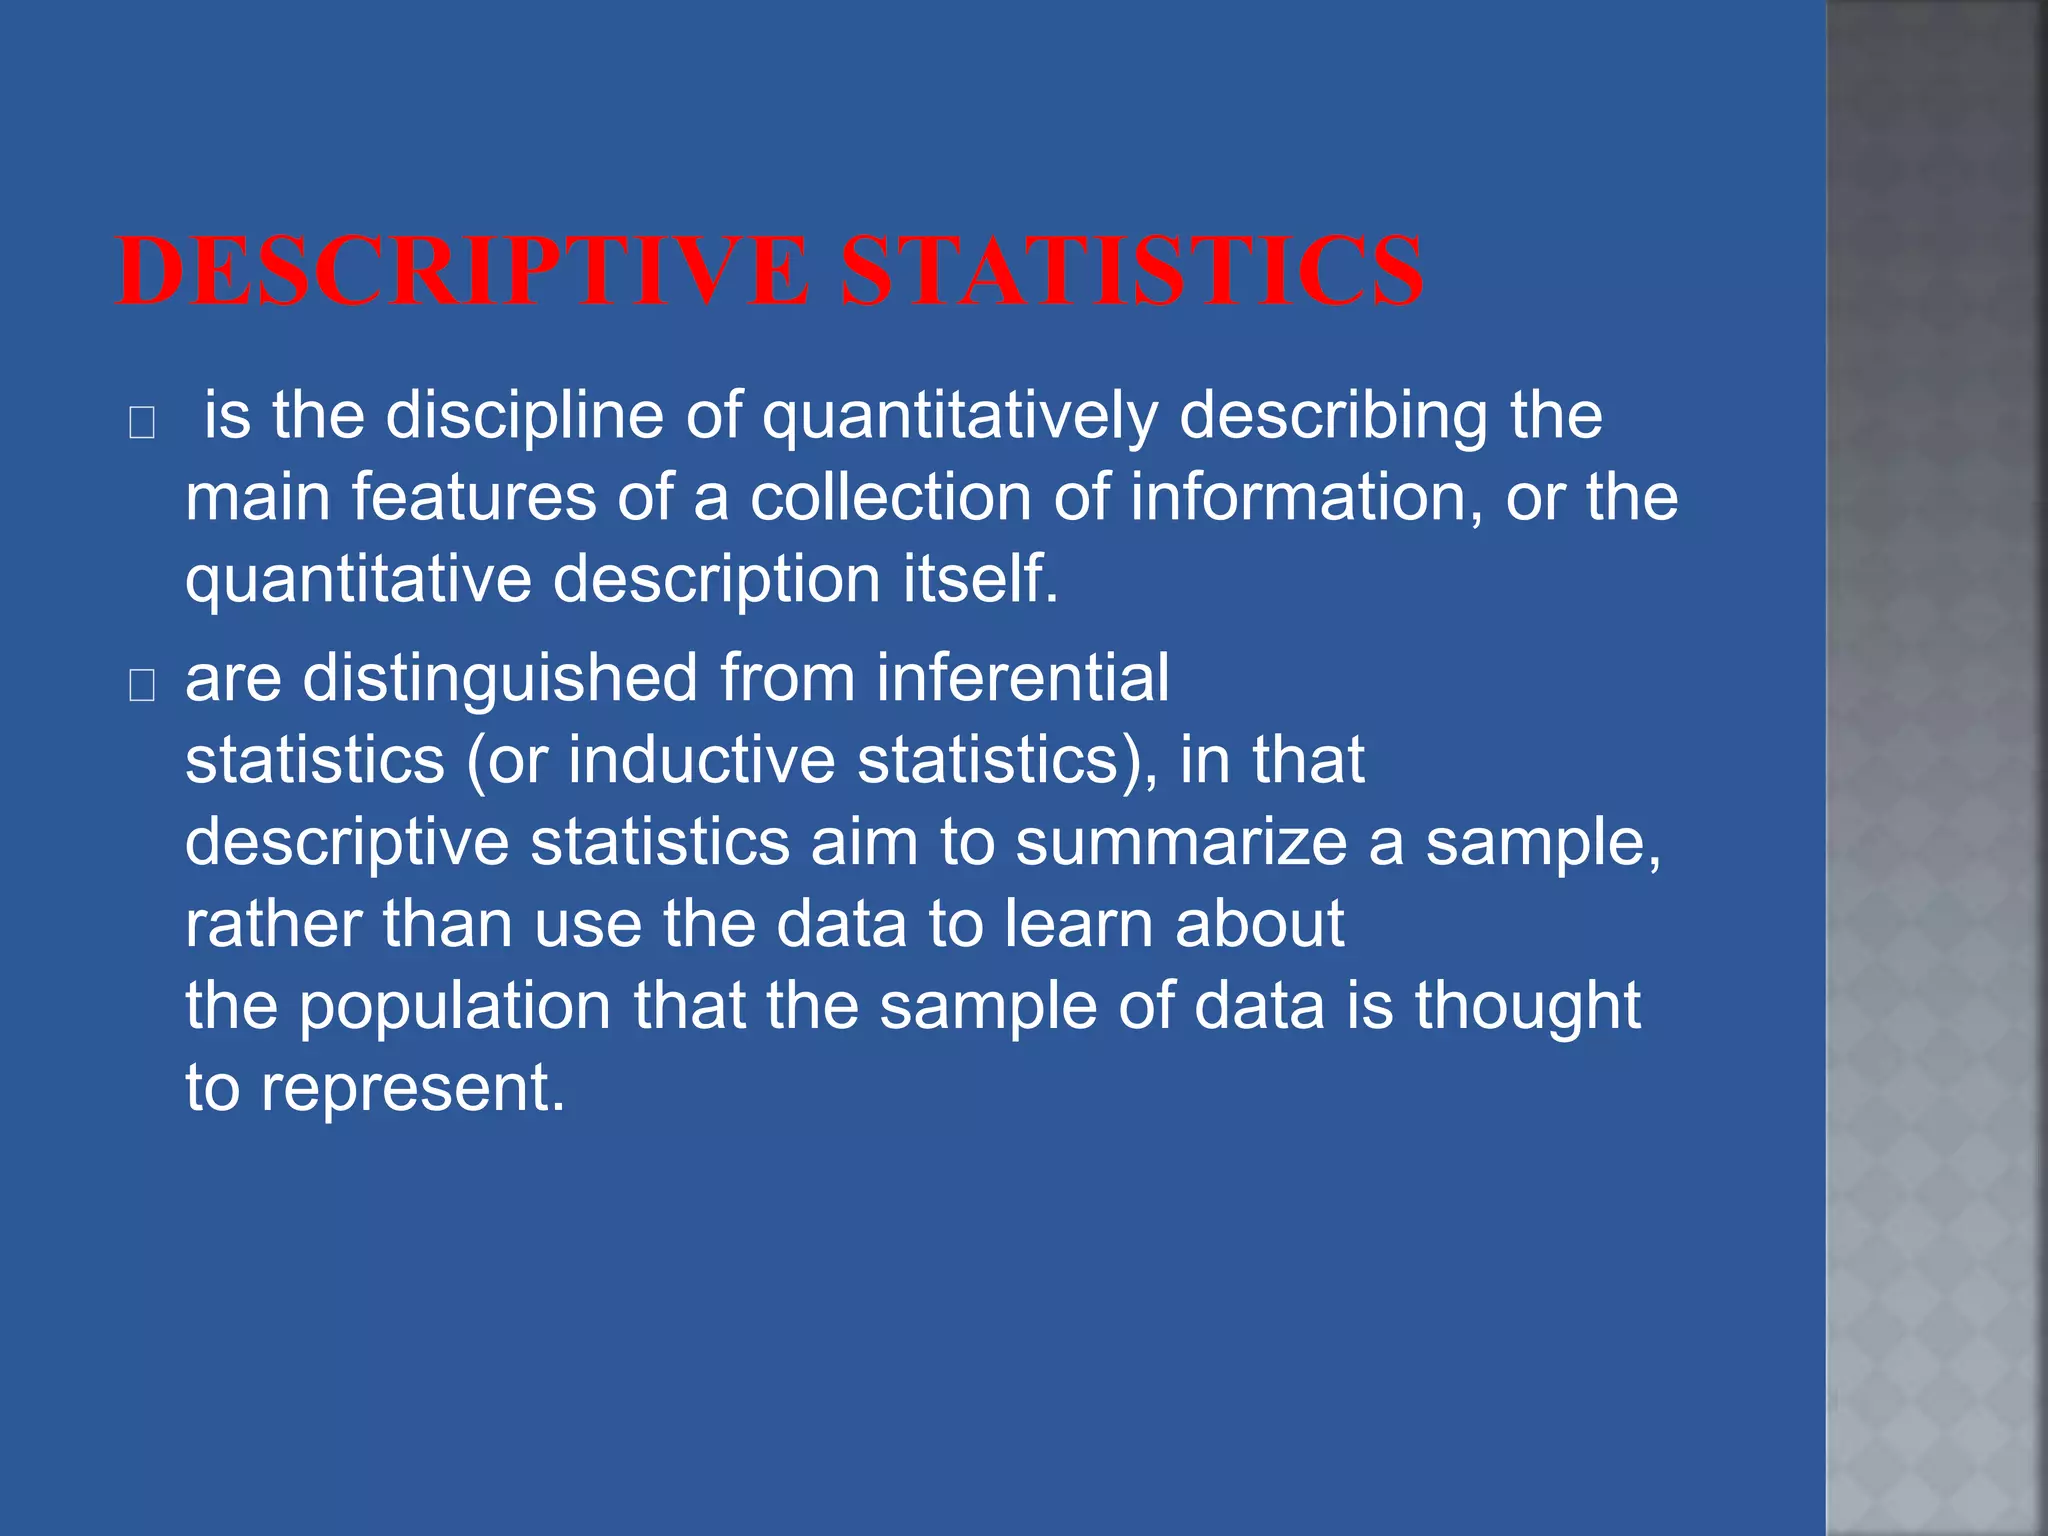


Descriptive statistics are used to summarize and describe data through measures like means and percentages. They aim to describe a sample rather than make inferences about the underlying population. Parametric statistics assume the data comes from a known probability distribution and allow inferences about the distribution's parameters, but require the data to meet certain assumptions. Non-parametric methods make fewer assumptions and allow comparisons of ordinal data, making them more robust and widely applicable than parametric methods.
Presentation by Norhac T. Kali on Research Methods focusing on Statistical Analysis.
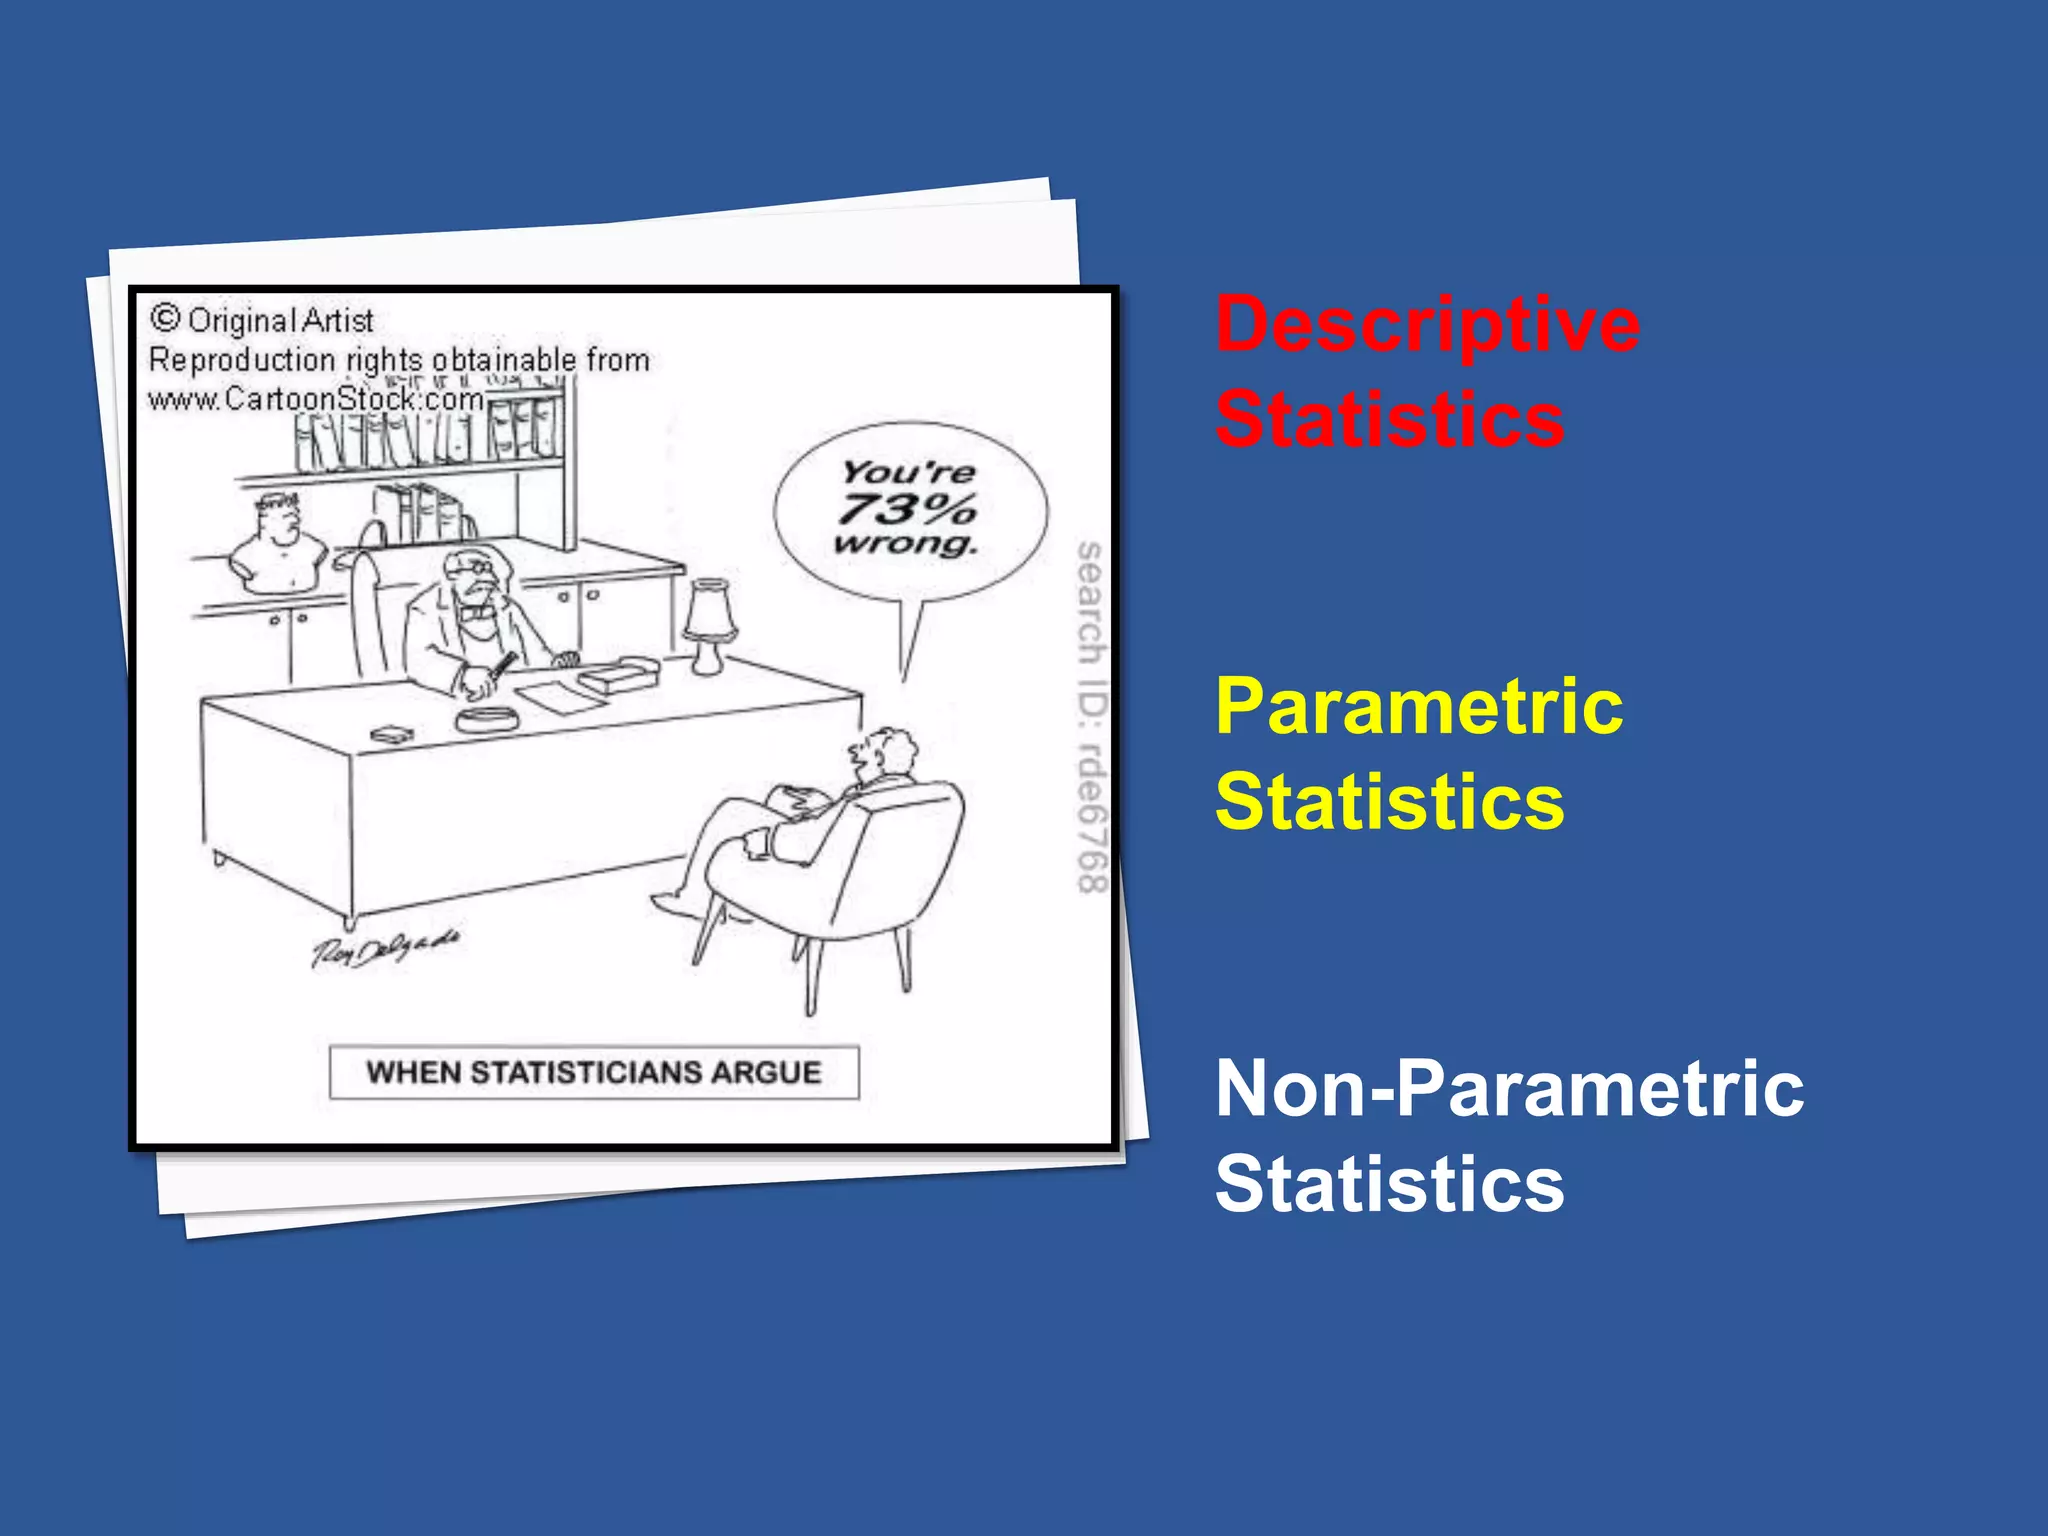
Introduction to Descriptive, Parametric, and Non-Parametric Statistics in research.
Descriptive statistics summarize a sample without inferring about the population.
Examples like basketball shooting percentage and GPAs illustrating descriptive statistics benefits.
Parametric statistics rely on data from probability distributions with specific assumptions.
Example illustrating parametric methods using test scores and predictions based on normal distribution.
Non-parametric statistics deals with ranked data, less assumptions, and broader applicability.