Downloaded 713 times
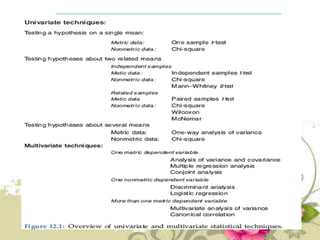
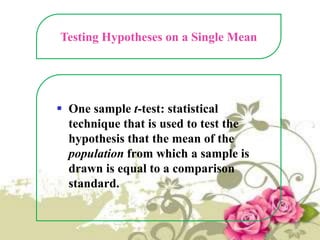
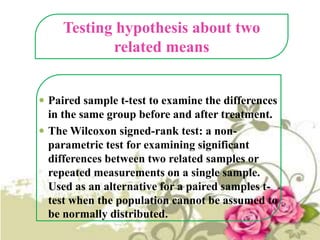
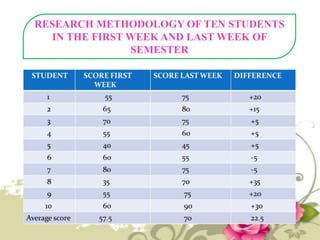
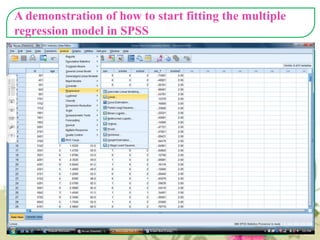
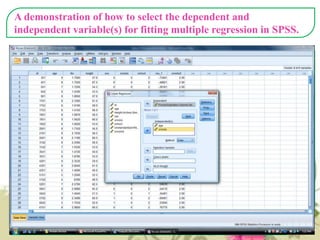
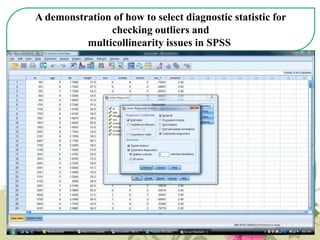
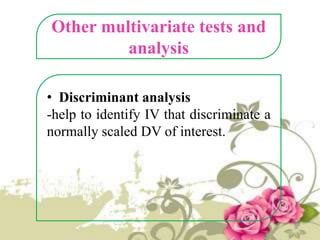


This document provides an overview of quantitative data analysis techniques for hypothesis testing, including types of errors, statistical power, and tests for single and multiple sample means. It also discusses regression analysis, issues of multicollinearity, and other multivariate tests such as discriminant analysis, logistic regression, and canonical correlation.