Downloaded 162 times


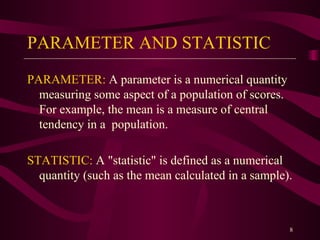


The document discusses biostatistics and its importance in research and data analysis. It defines key biostatistics concepts like population and sample, parameter and statistic, and measures of central tendency and dispersion. It also discusses hypothesis testing and provides an example analyzing body mass index data from a student population to compare means between gender groups and examine sampling error.


