Download to read offline
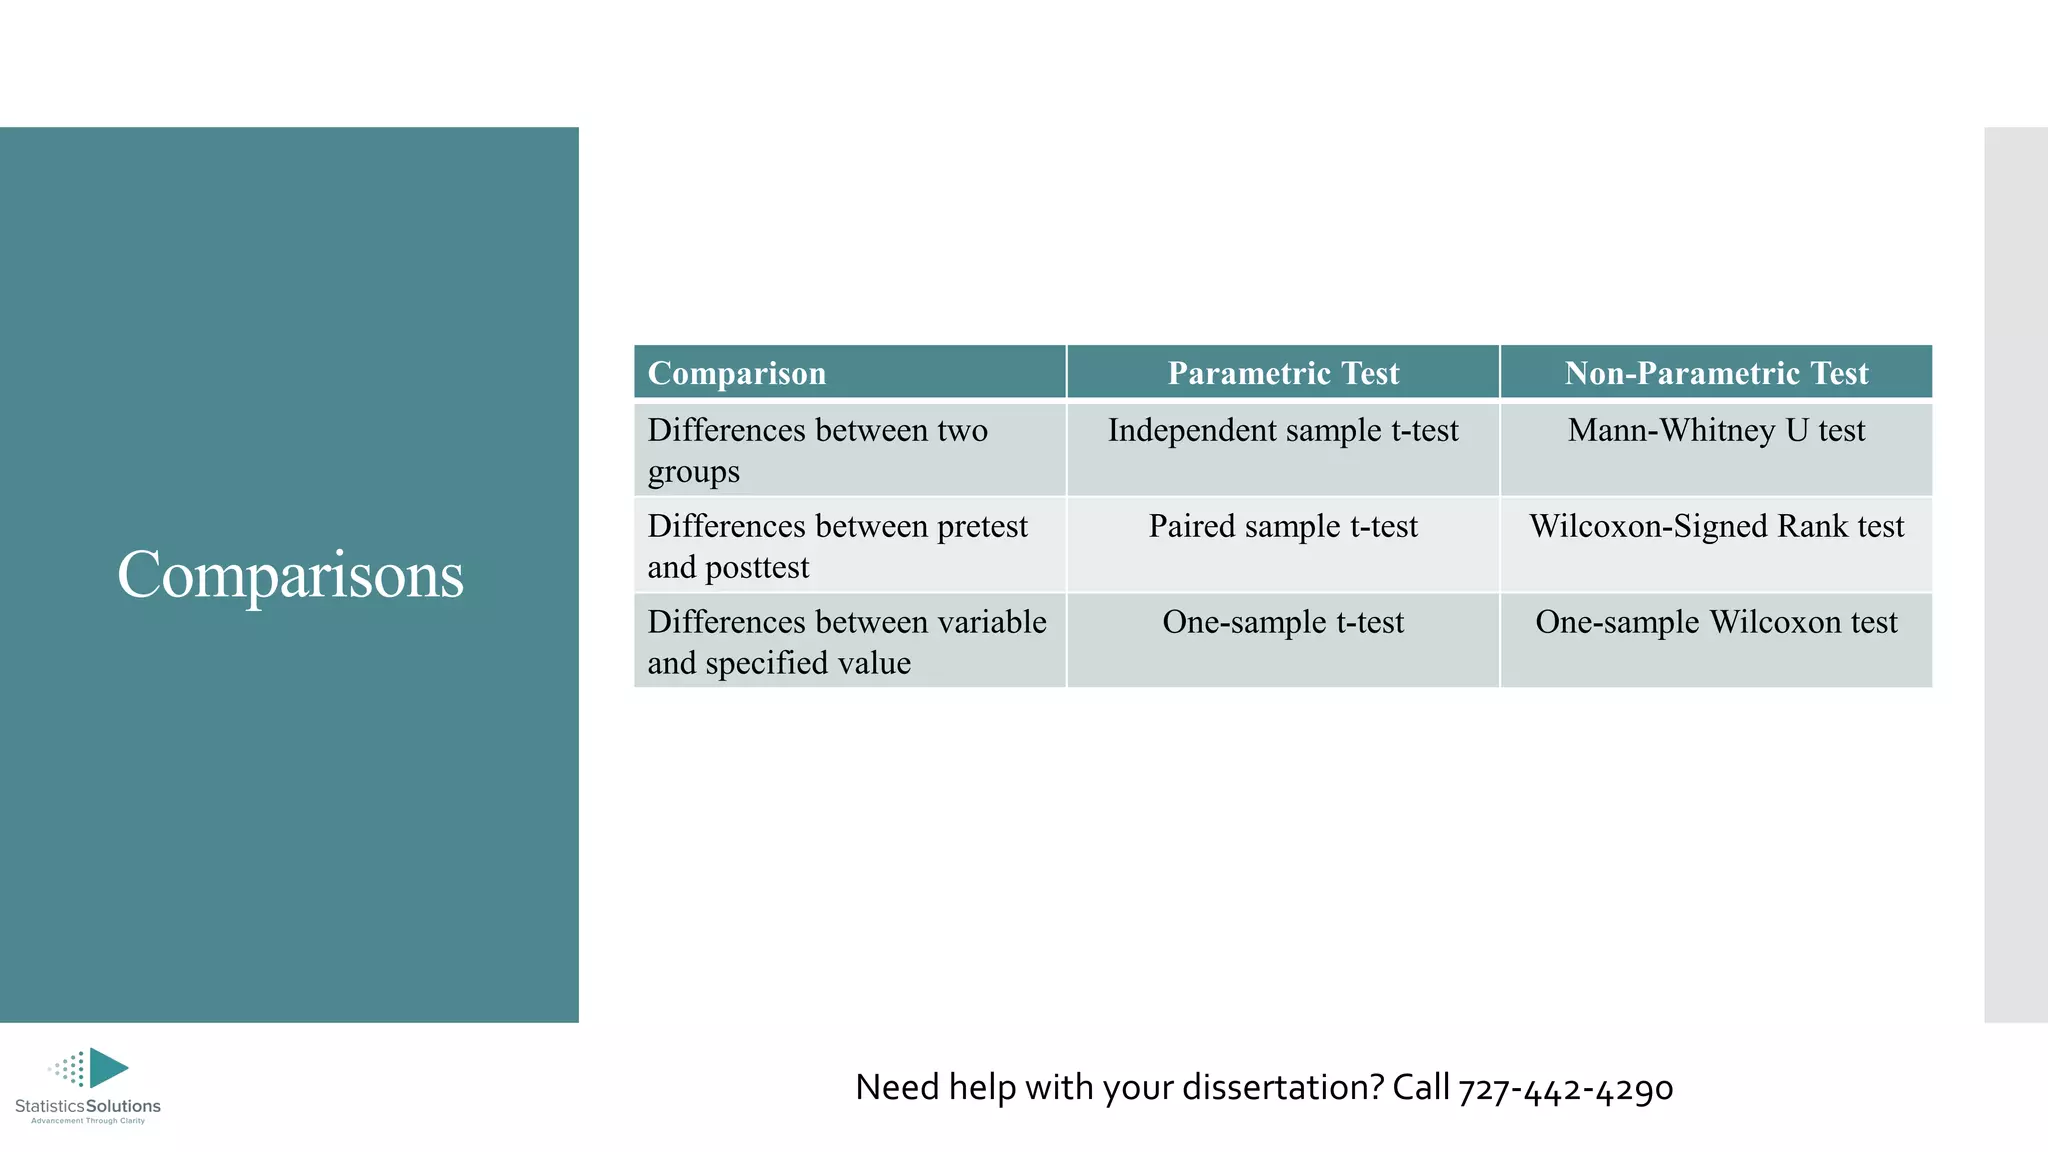
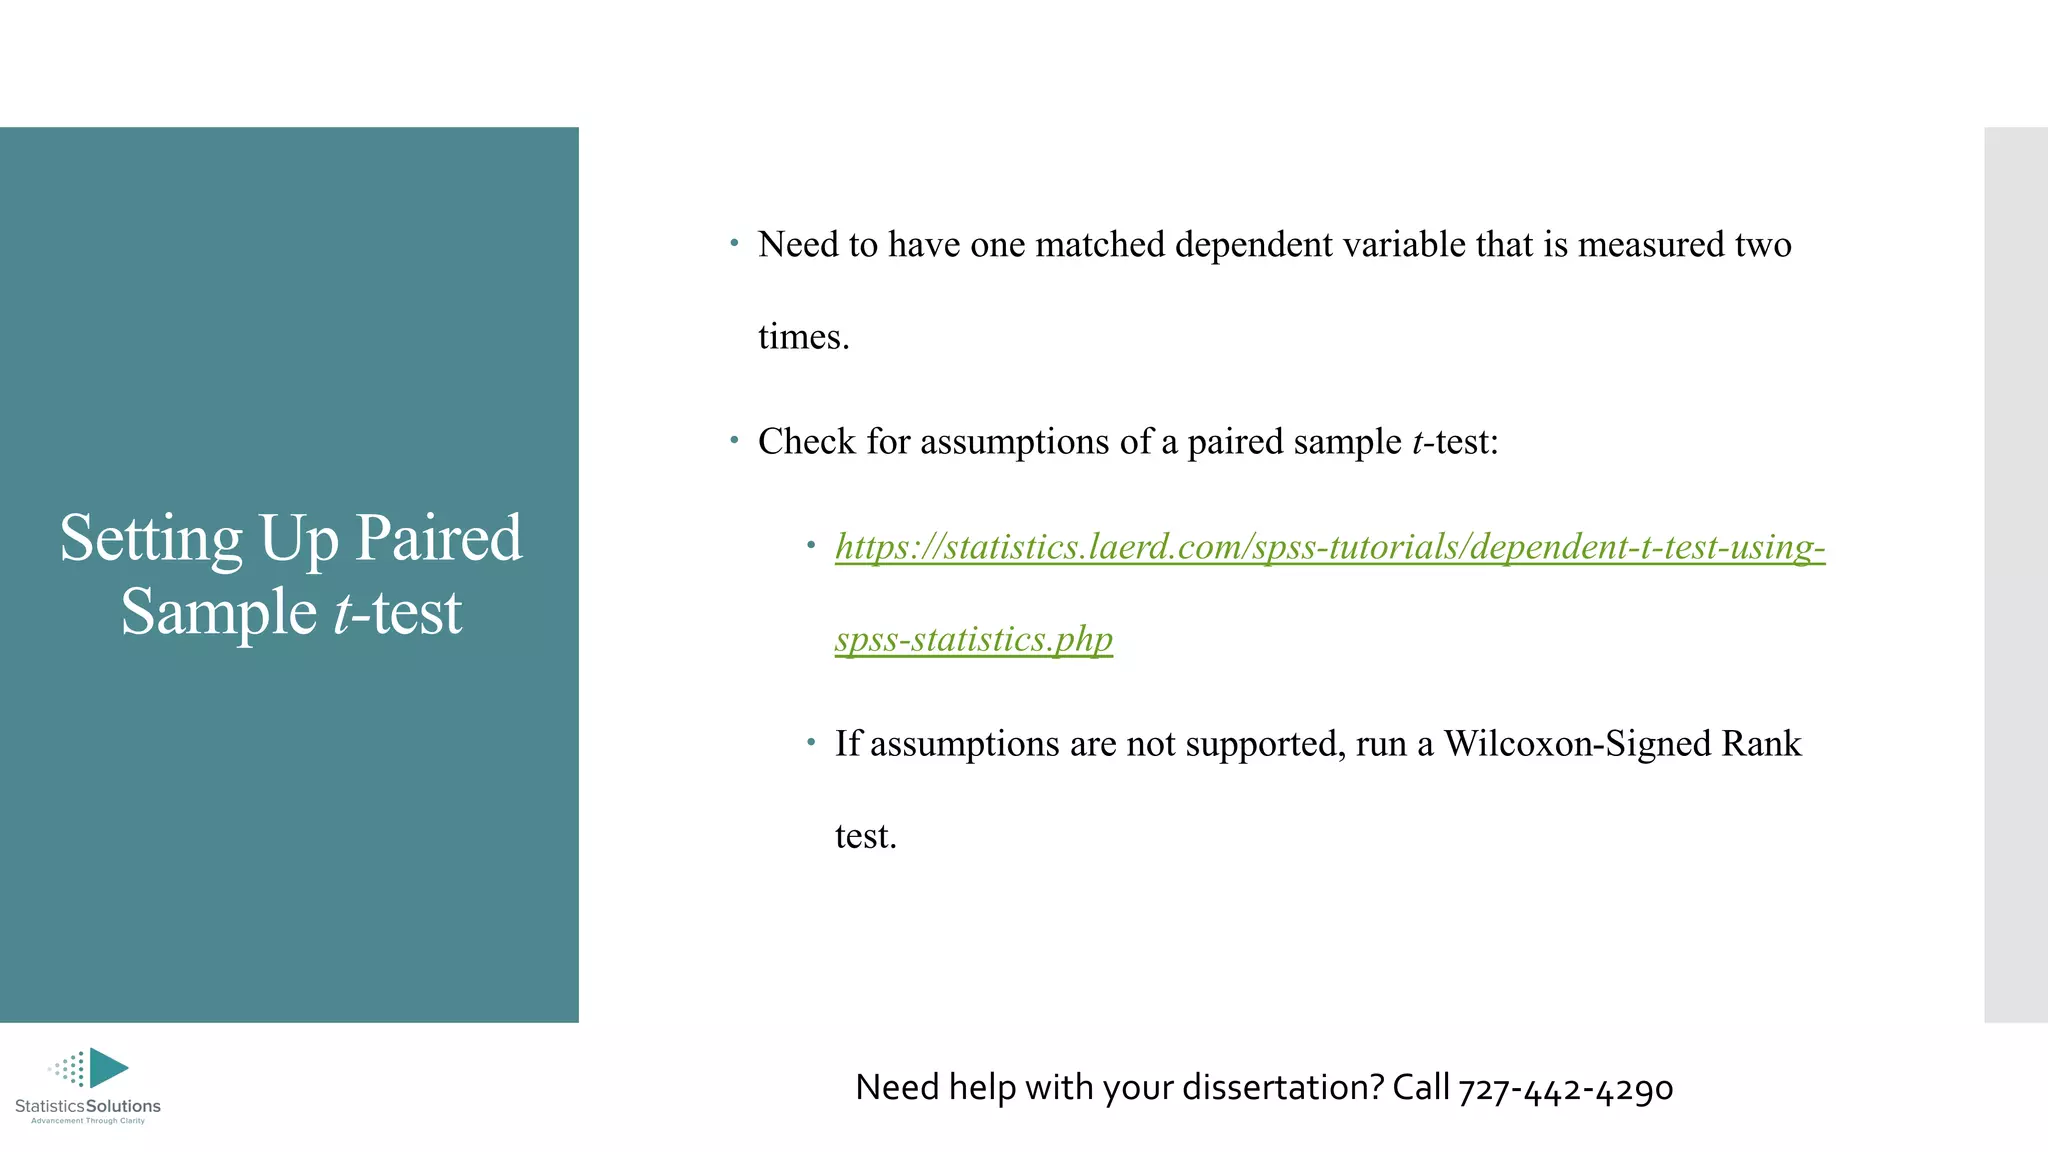
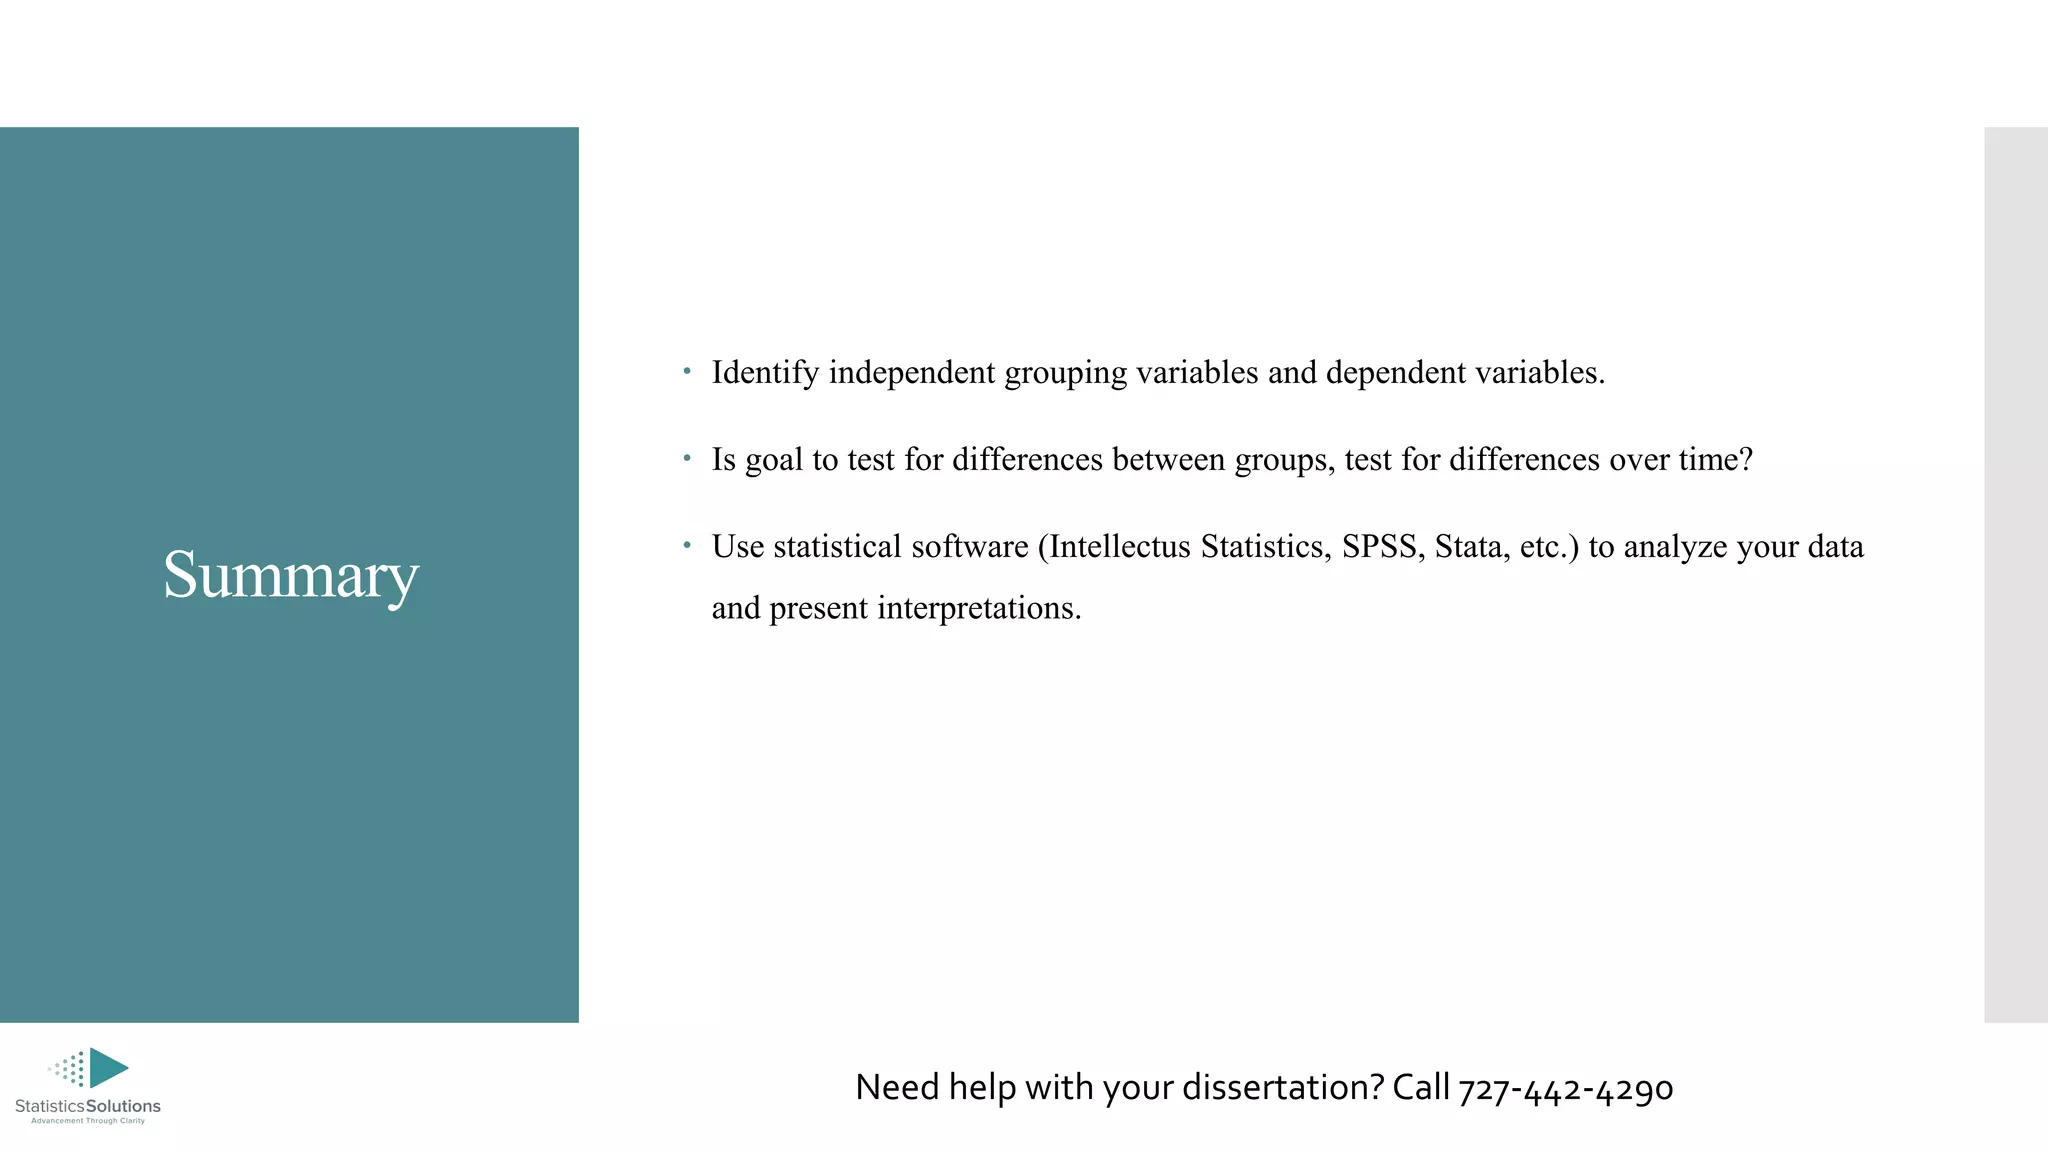

The document outlines how to conduct and interpret t-tests, including independent, paired, and one-sample tests, discussing the assumptions required for each type. It emphasizes the importance of checking for normality in data distributions and provides alternative non-parametric tests if those assumptions are not met. Additionally, it offers consulting services for dissertation support and encourages contacting the company for assistance.