Downloaded 365 times
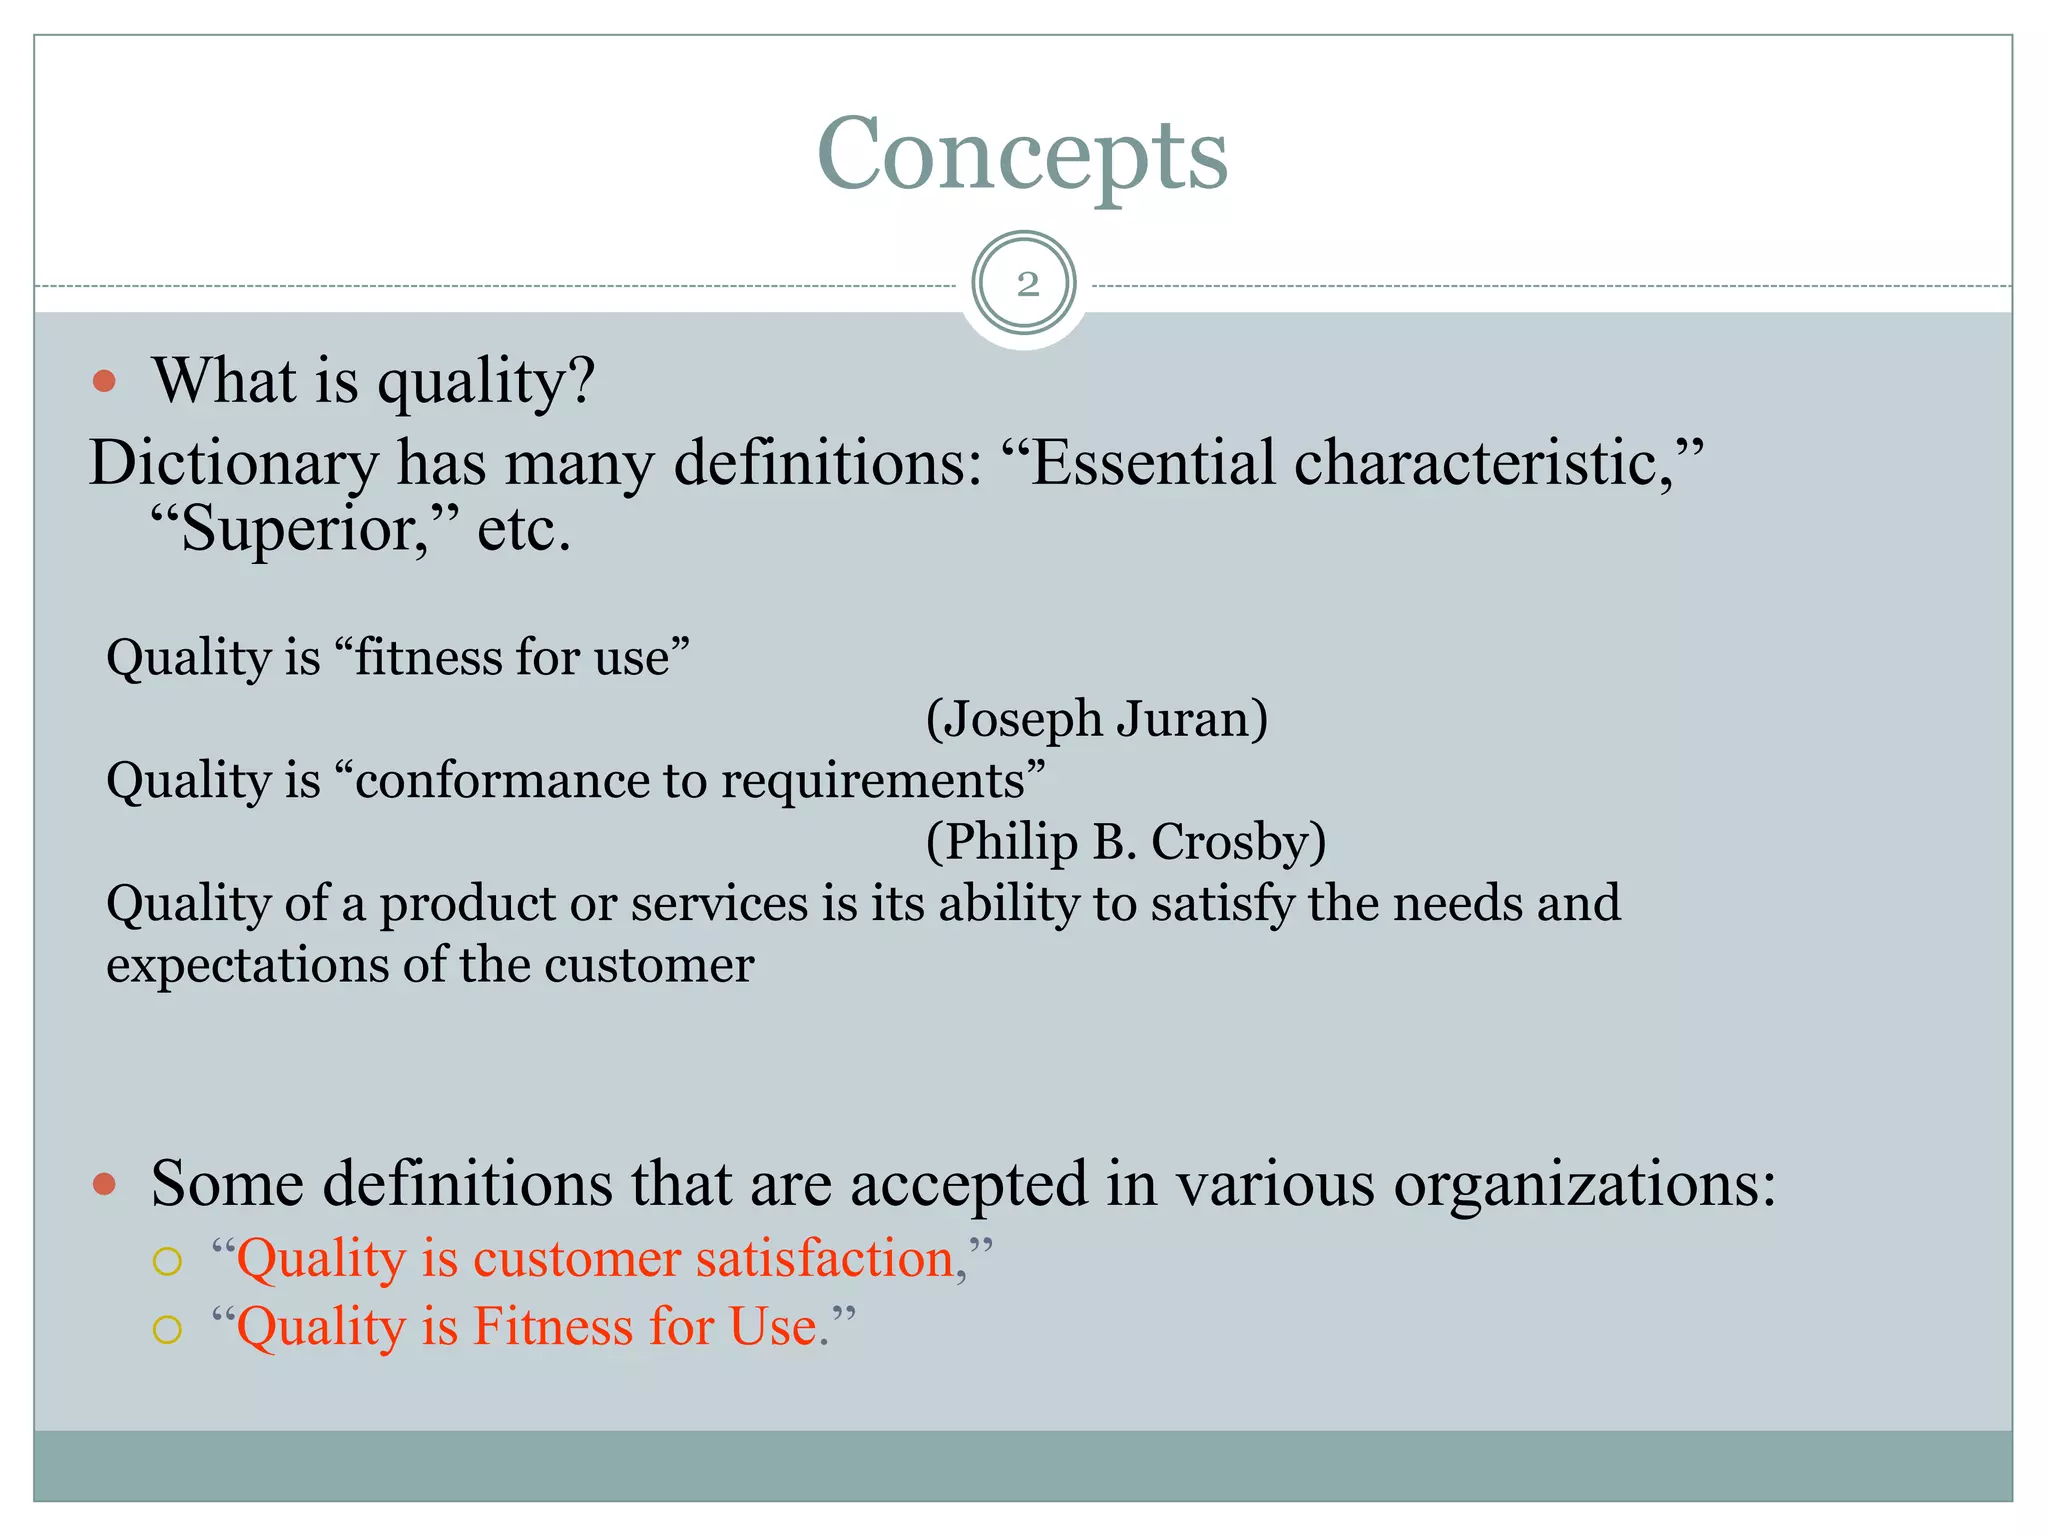
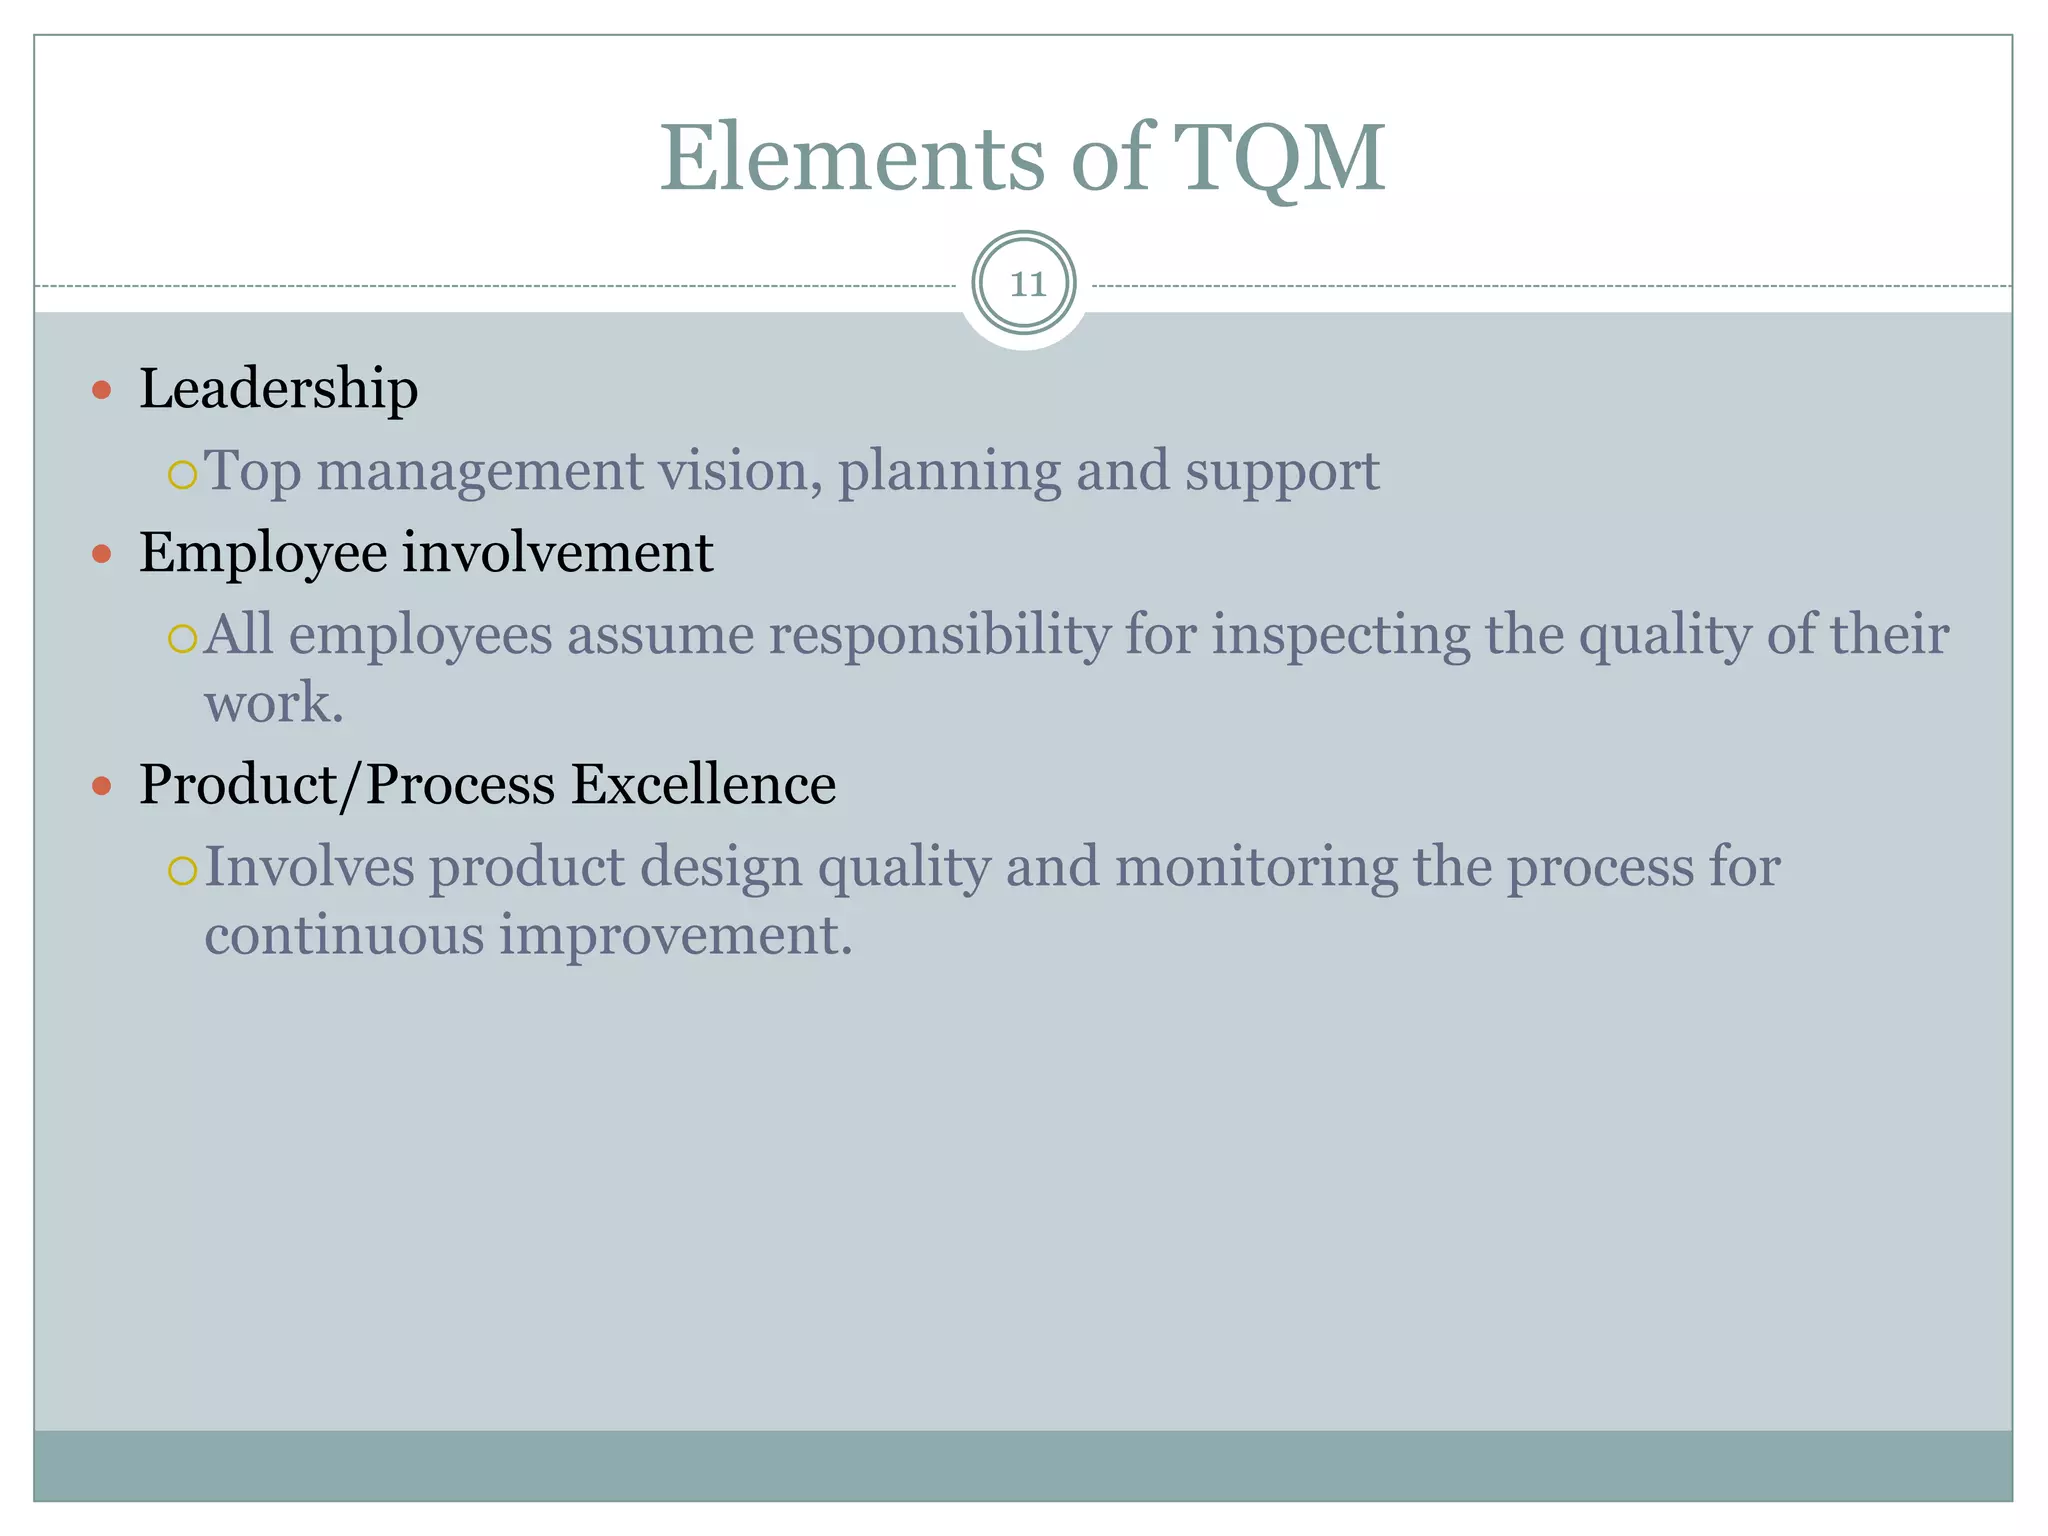
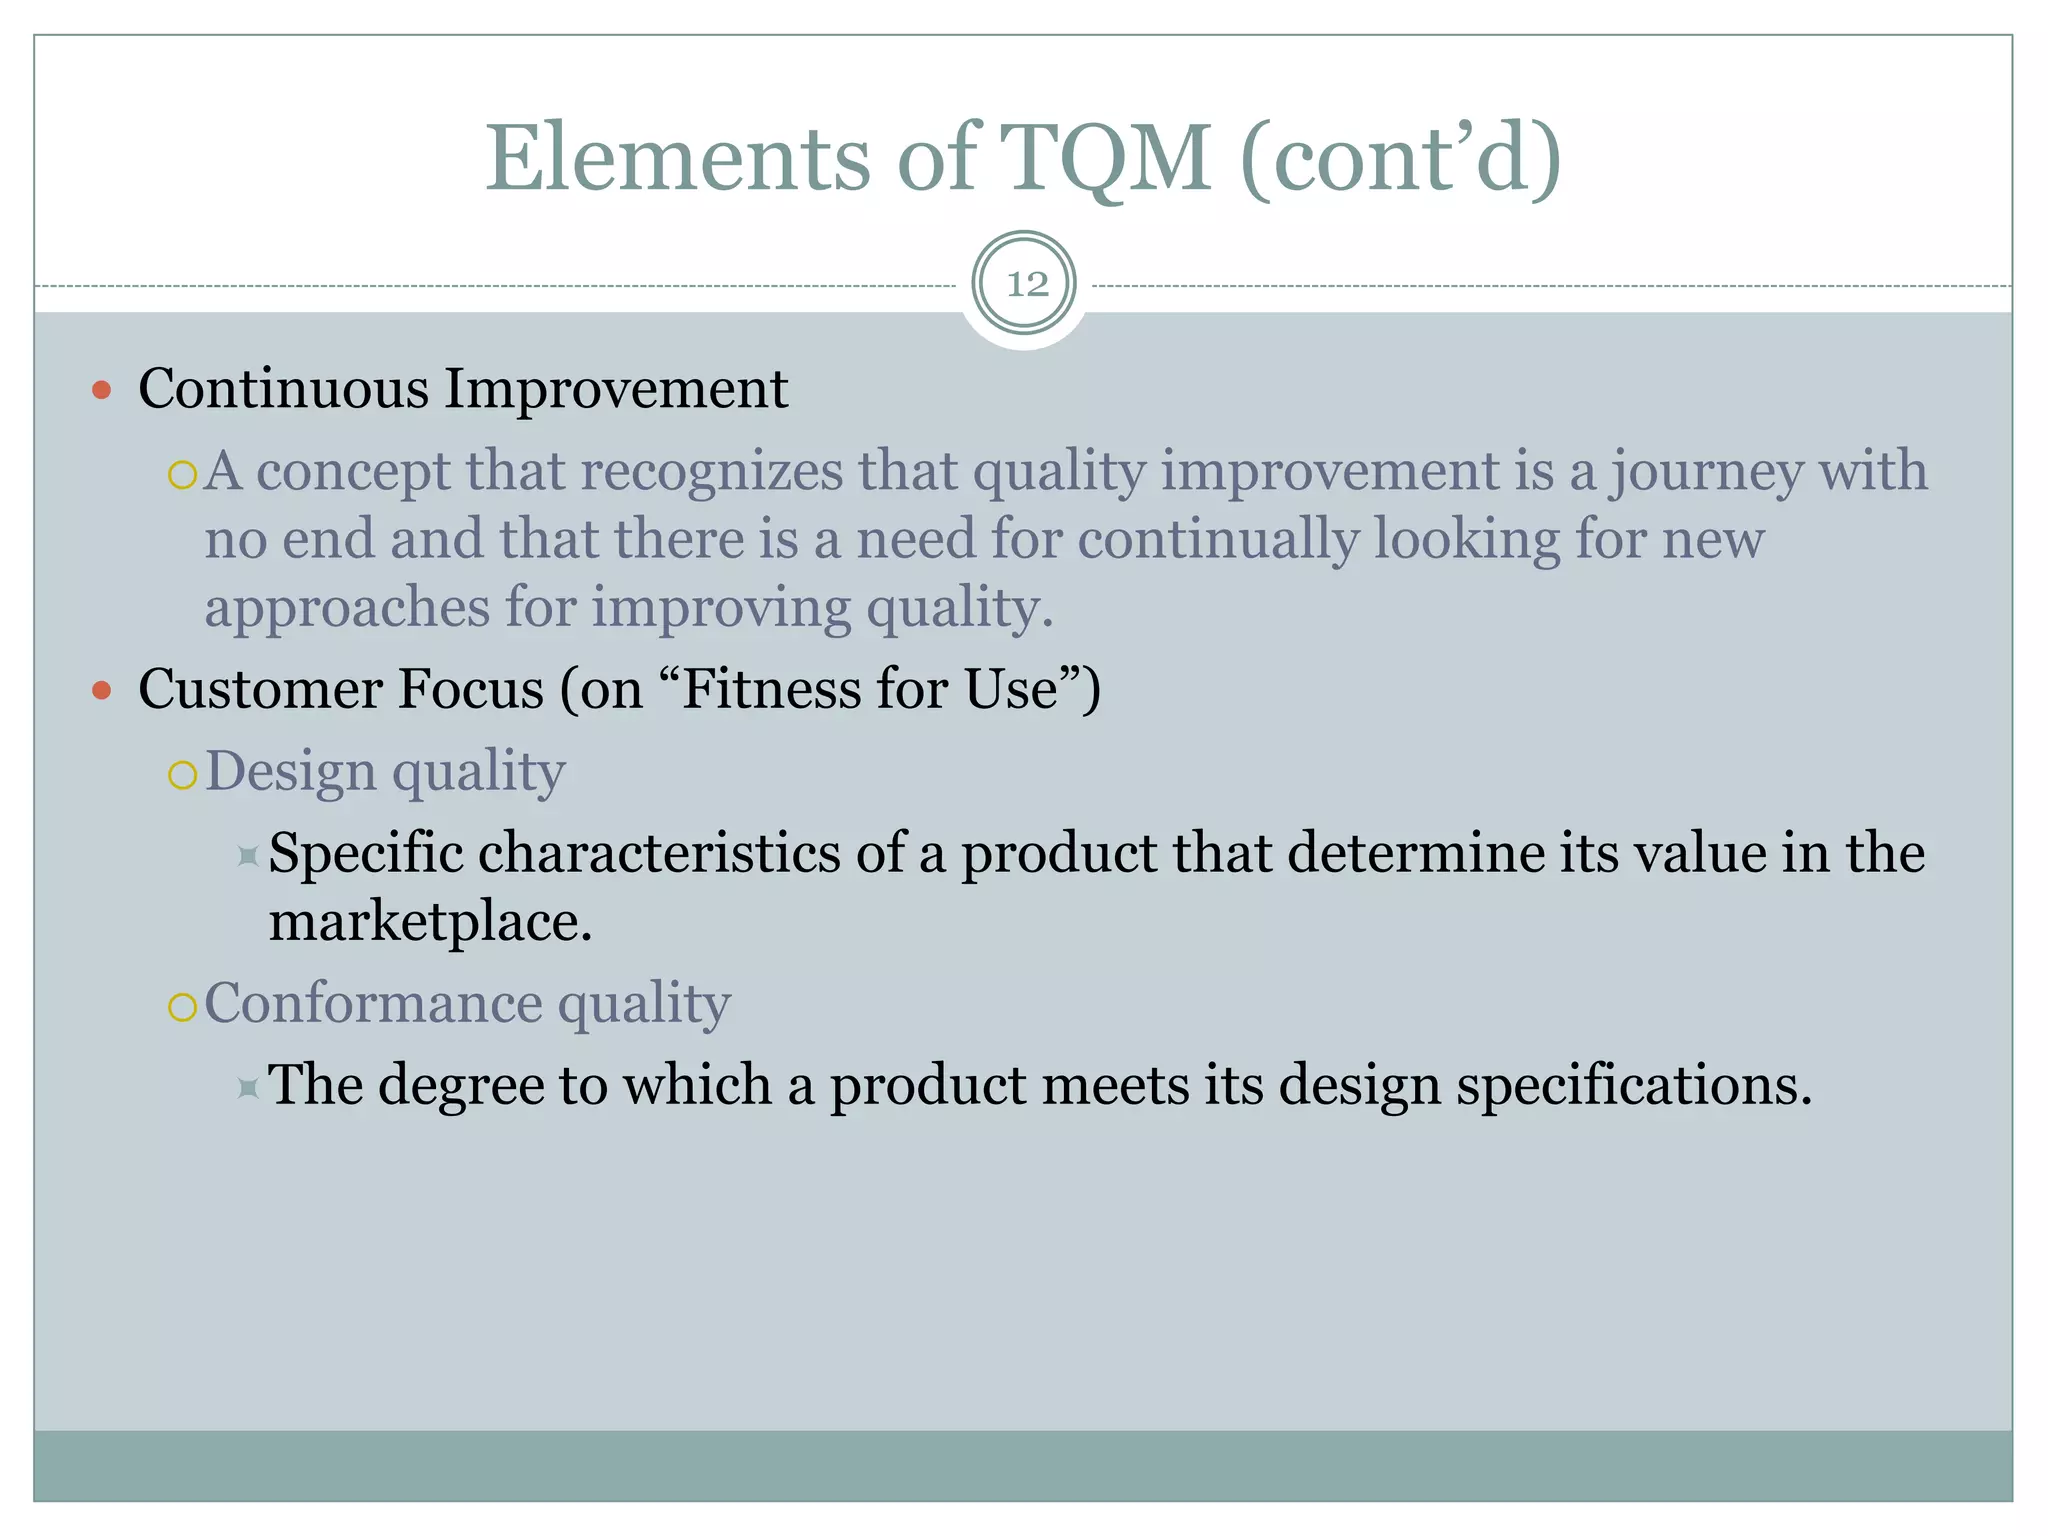
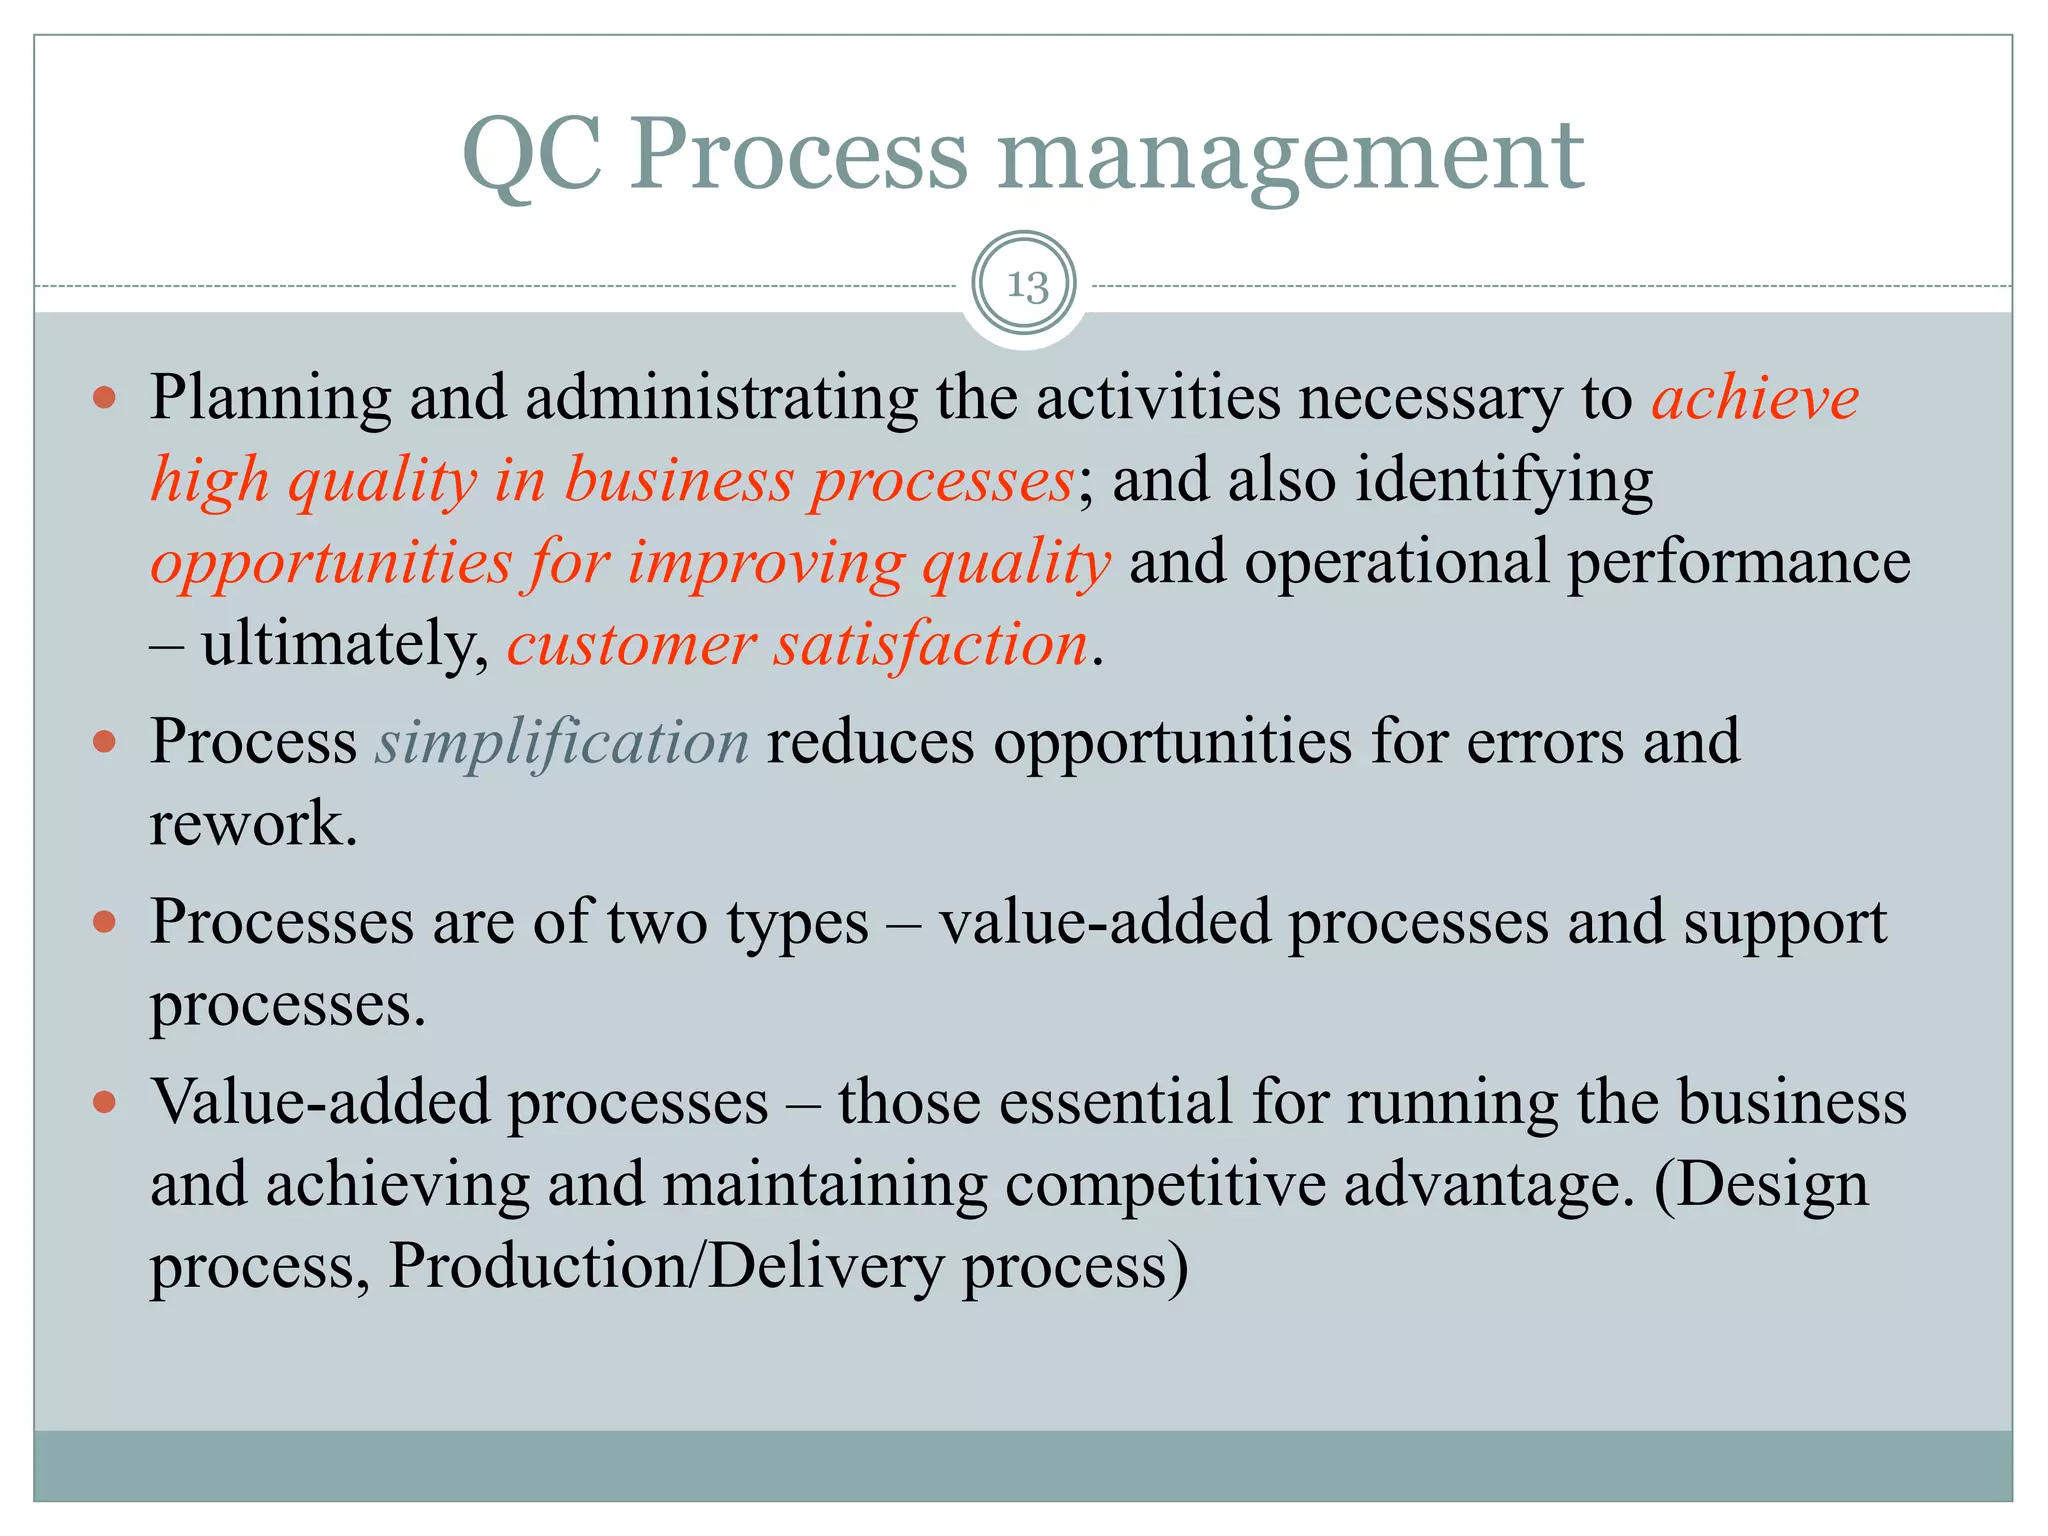

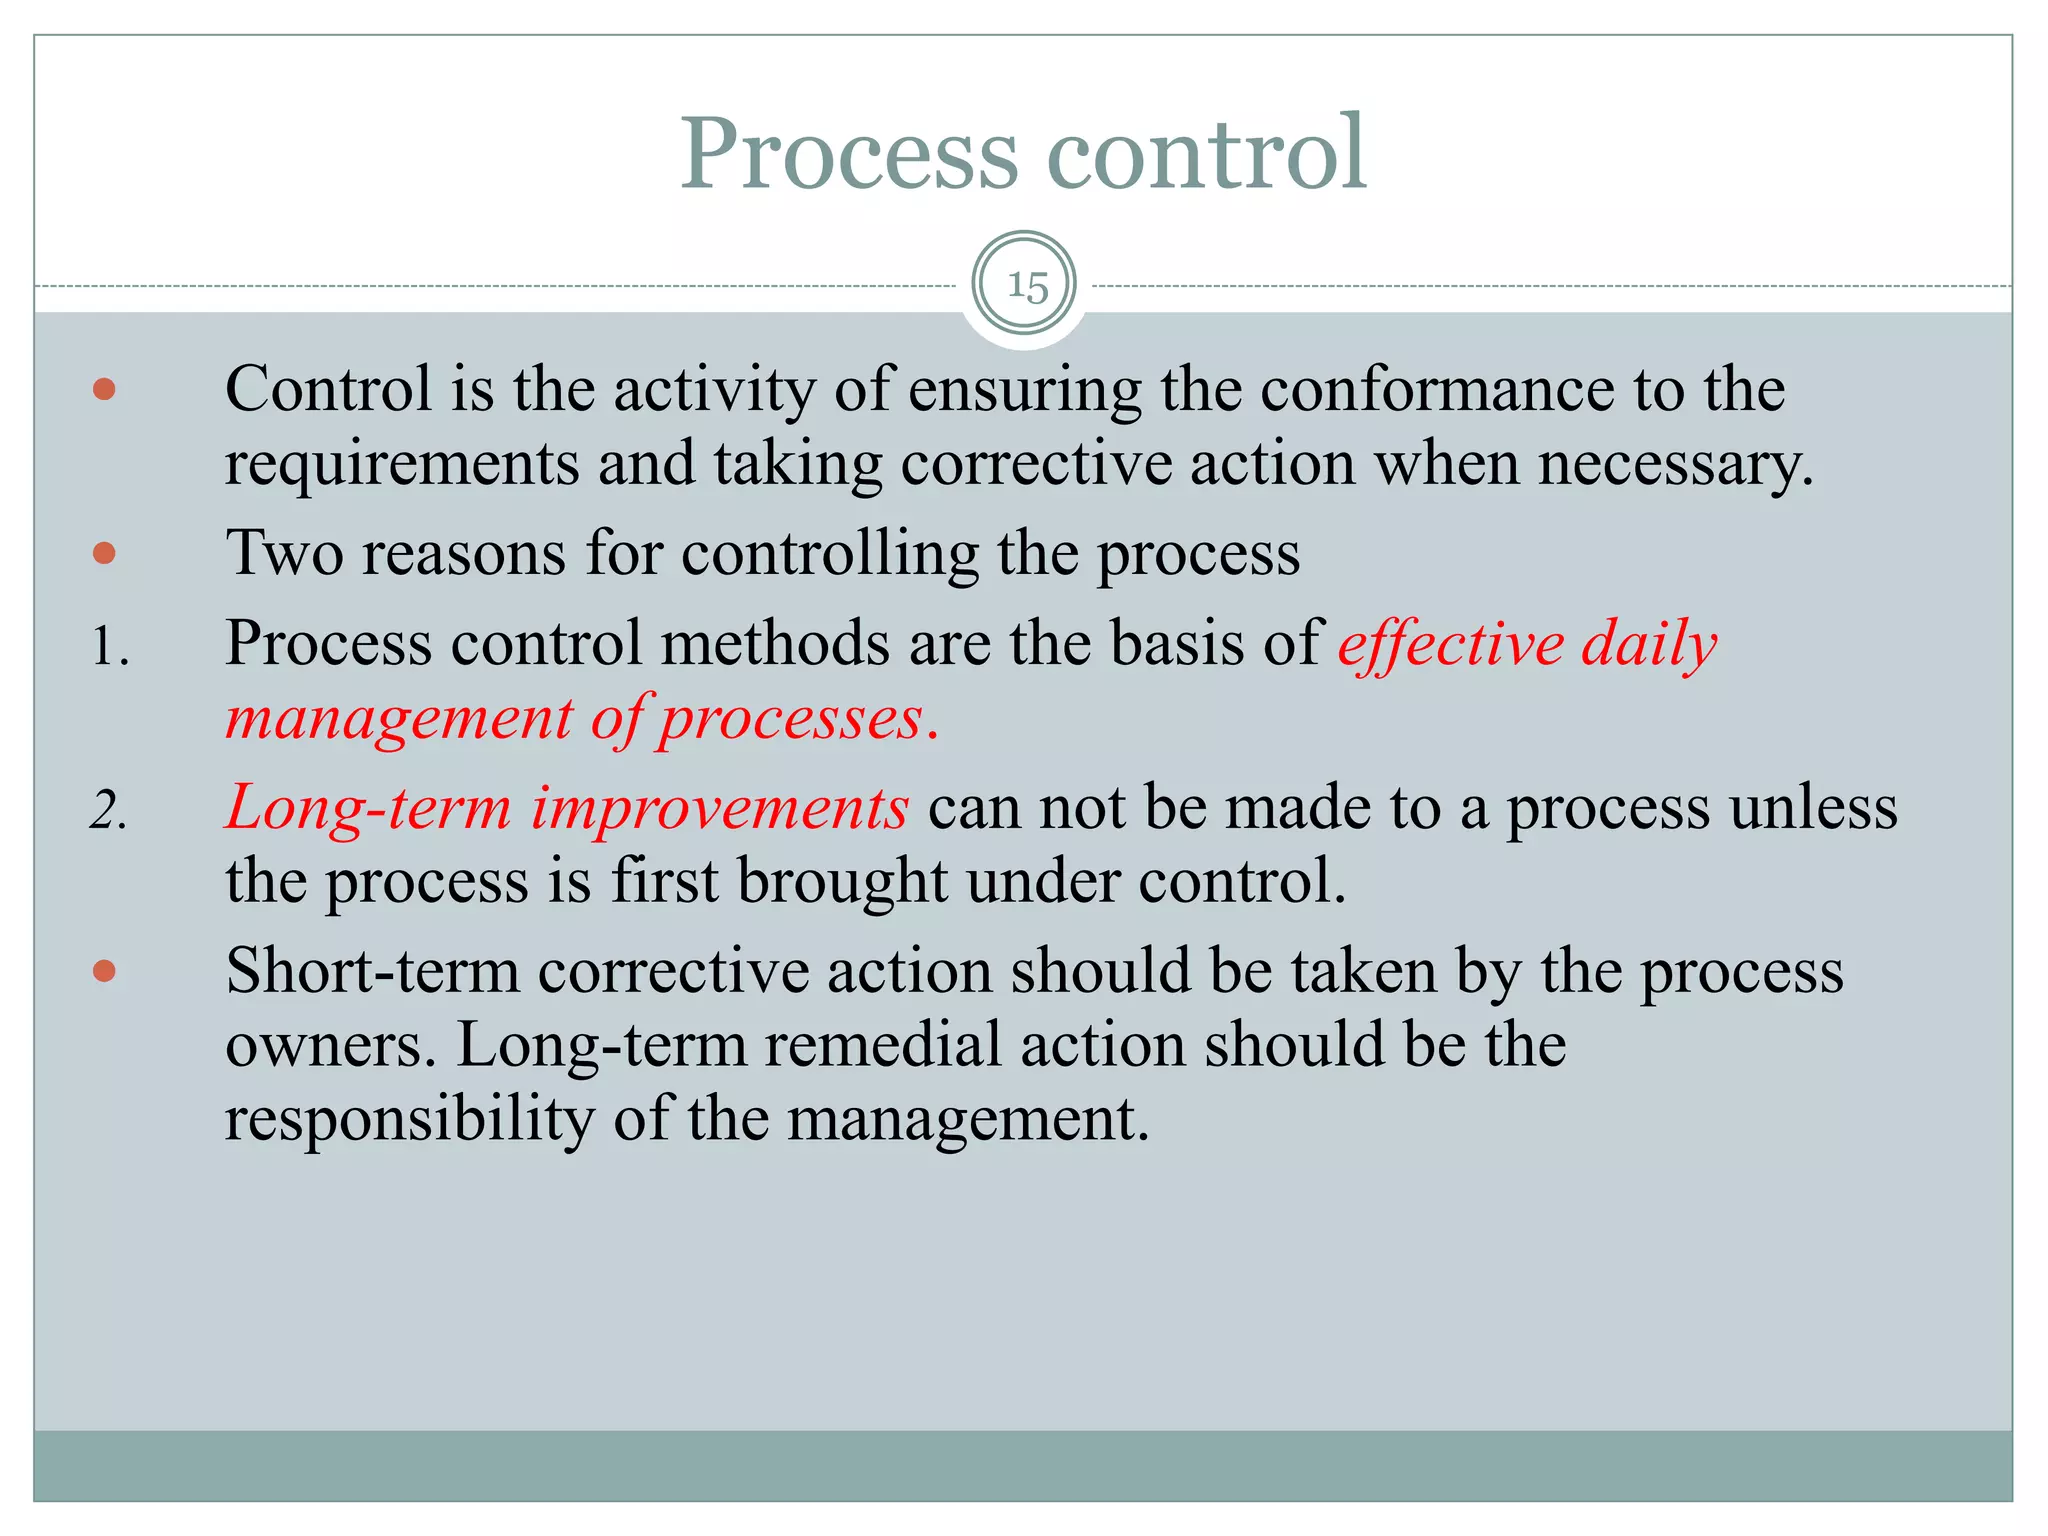


This document provides an overview of total quality management (TQM) concepts through a seminar presentation. It defines key TQM terms and principles, discusses the three major quality gurus and their philosophies, and outlines tools and techniques for process management and continuous improvement. The document emphasizes that TQM requires organization-wide commitment to customer satisfaction through integrated systems and the continuous improvement of processes.