Downloaded 11,327 times
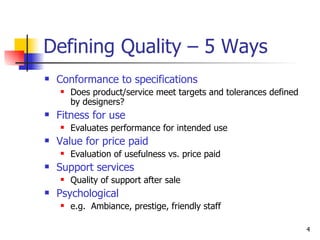
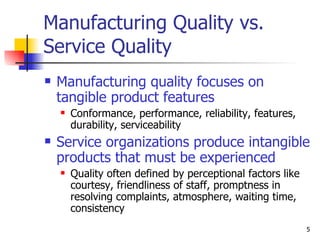
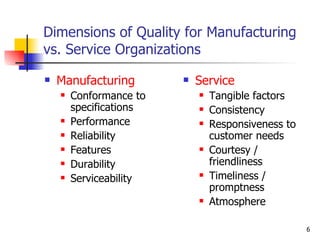
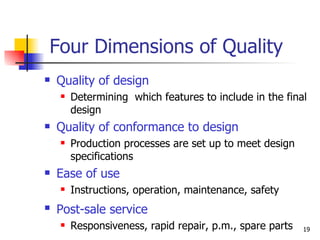
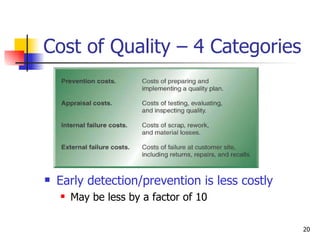

Total Quality Management (TQM) focuses on meeting customer expectations through integrated organizational efforts to improve quality. The key aspects of TQM discussed in the document include: 1) the four dimensions of quality for manufacturing and service organizations, 2) the costs of quality and prevention through tools like QFD and seven problem solving tools, 3) quality awards like the Malcolm Baldrige National Quality Award and Deming Prize that recognize excellence. TQM relies on concepts like continuous improvement, quality at the source, teams, and supplier certification.