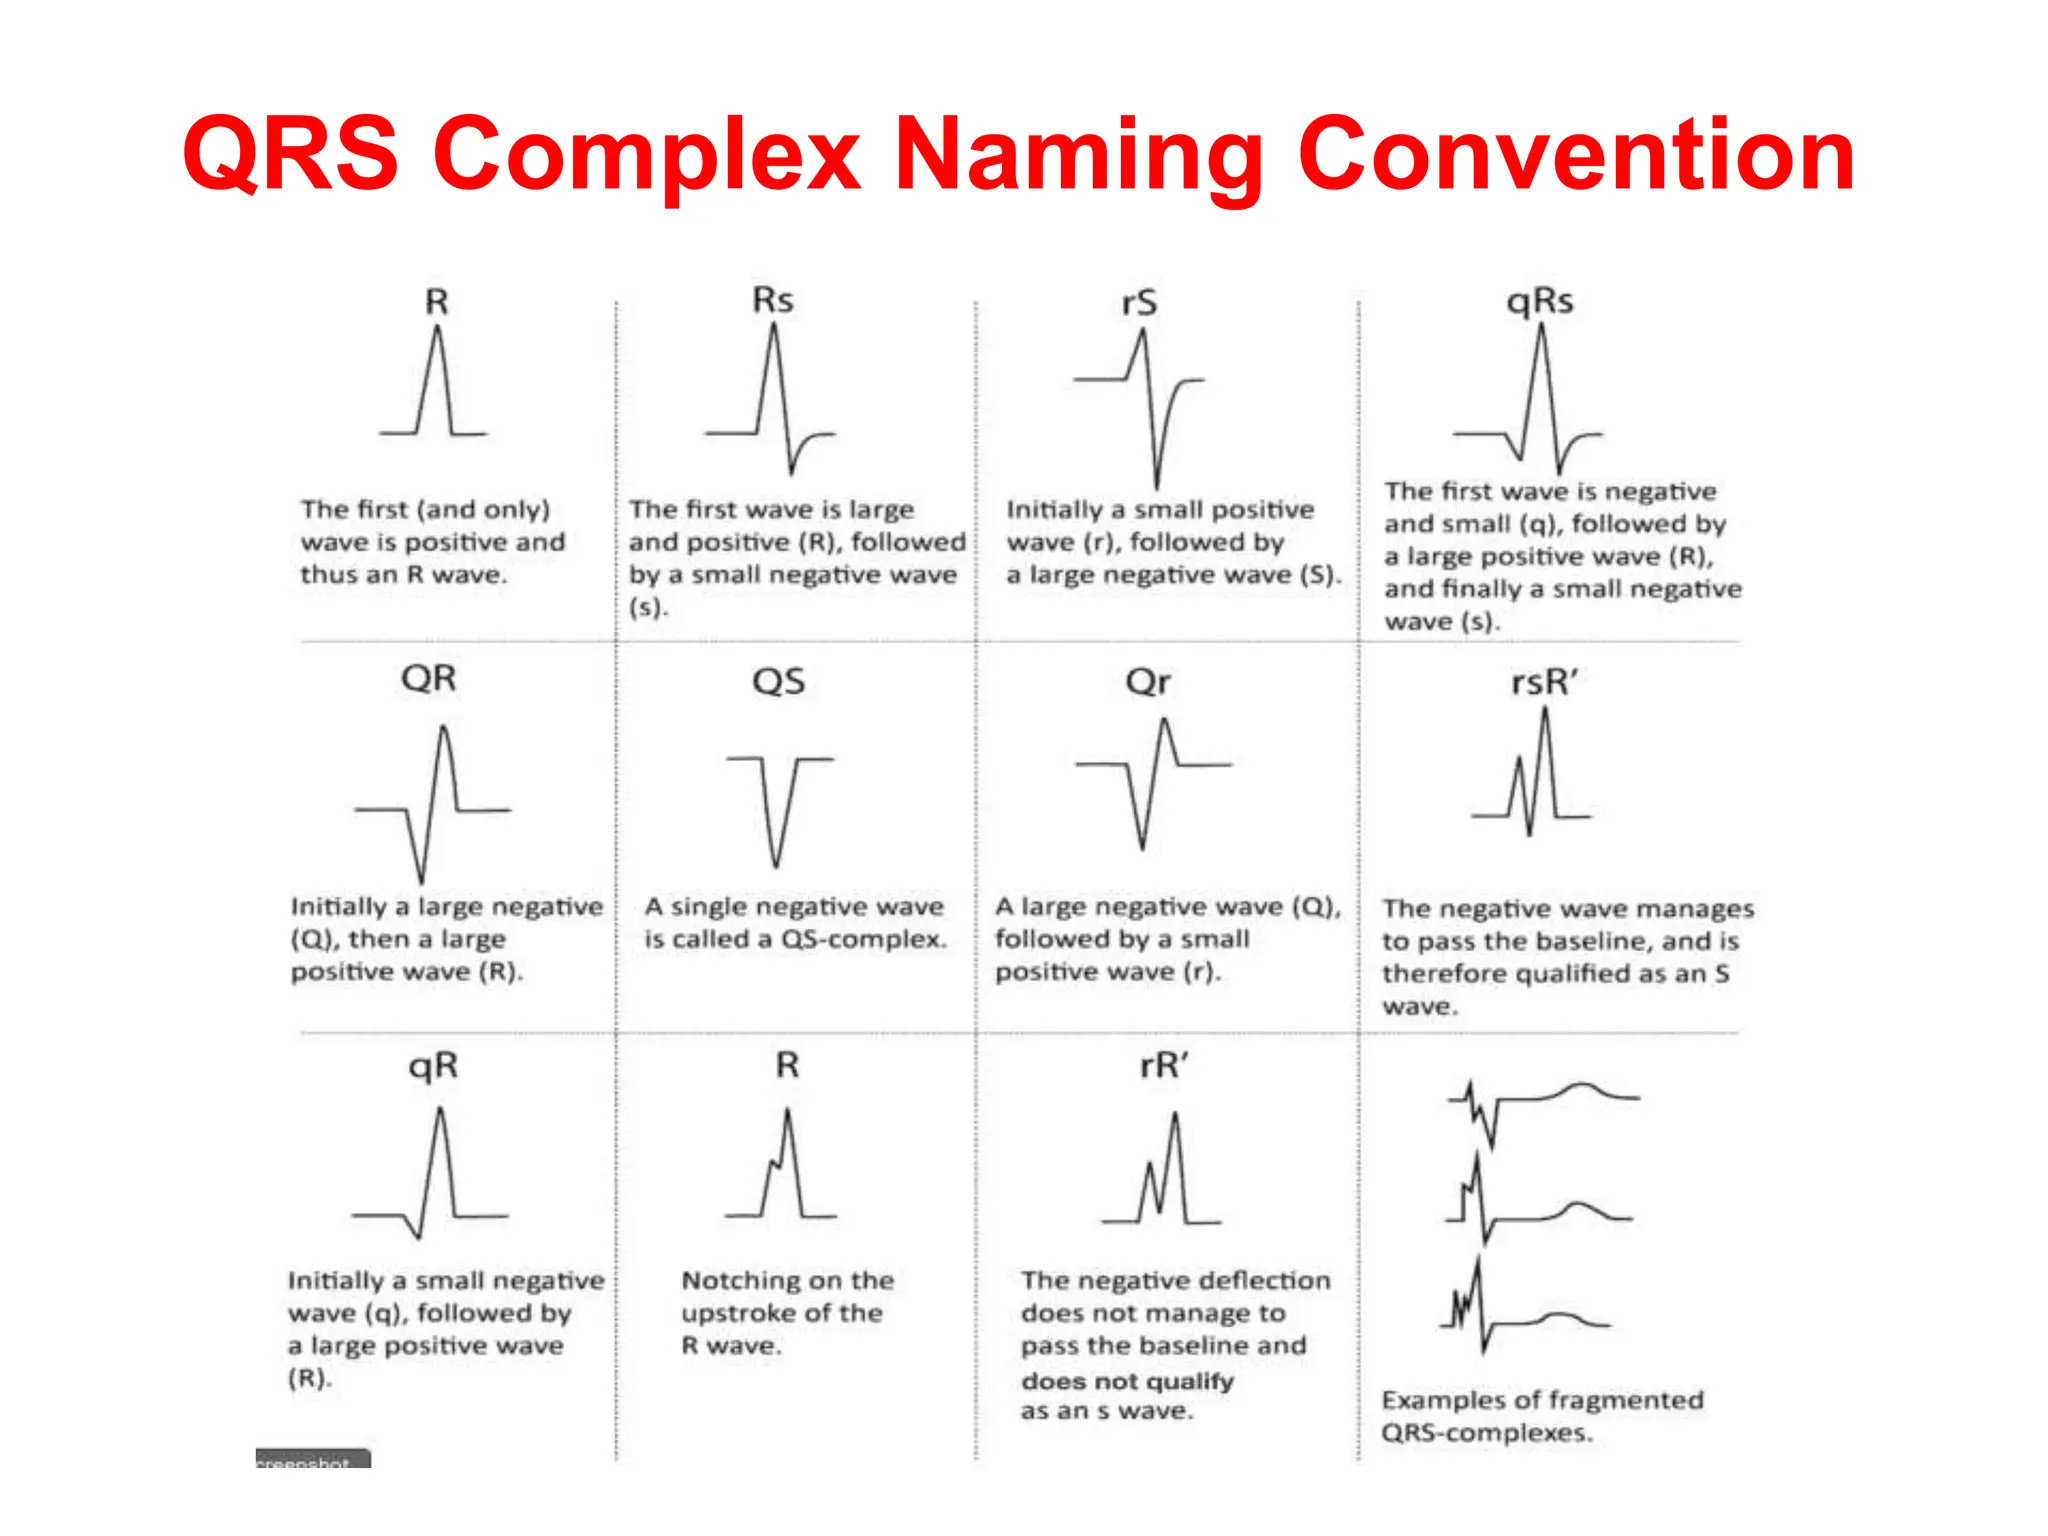
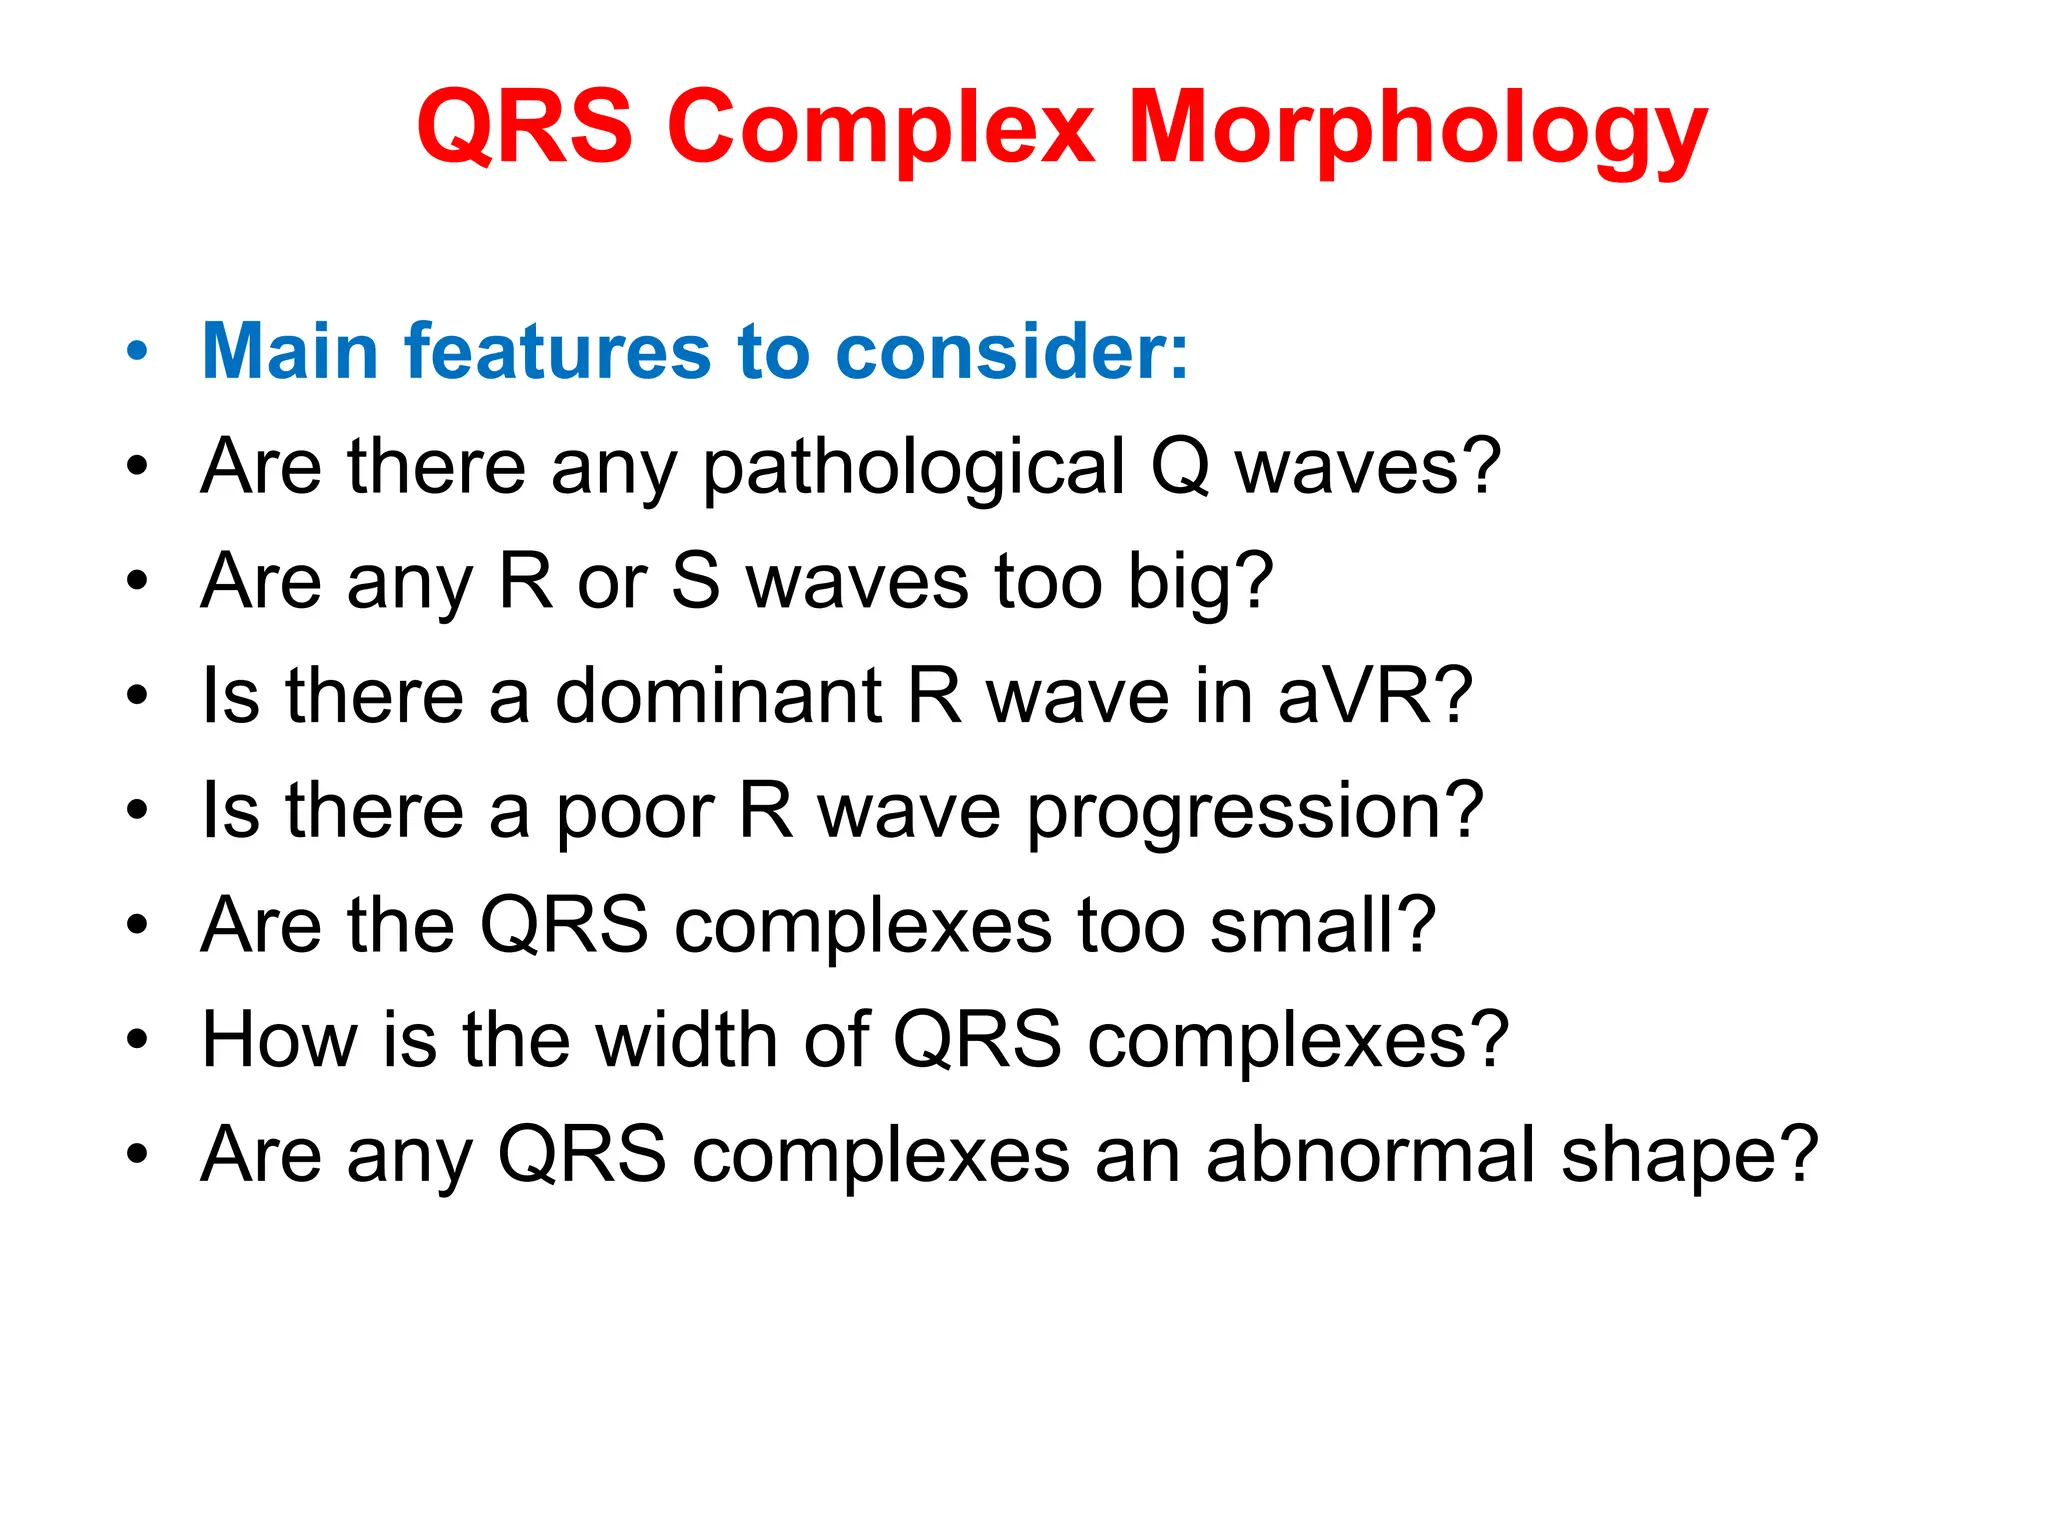
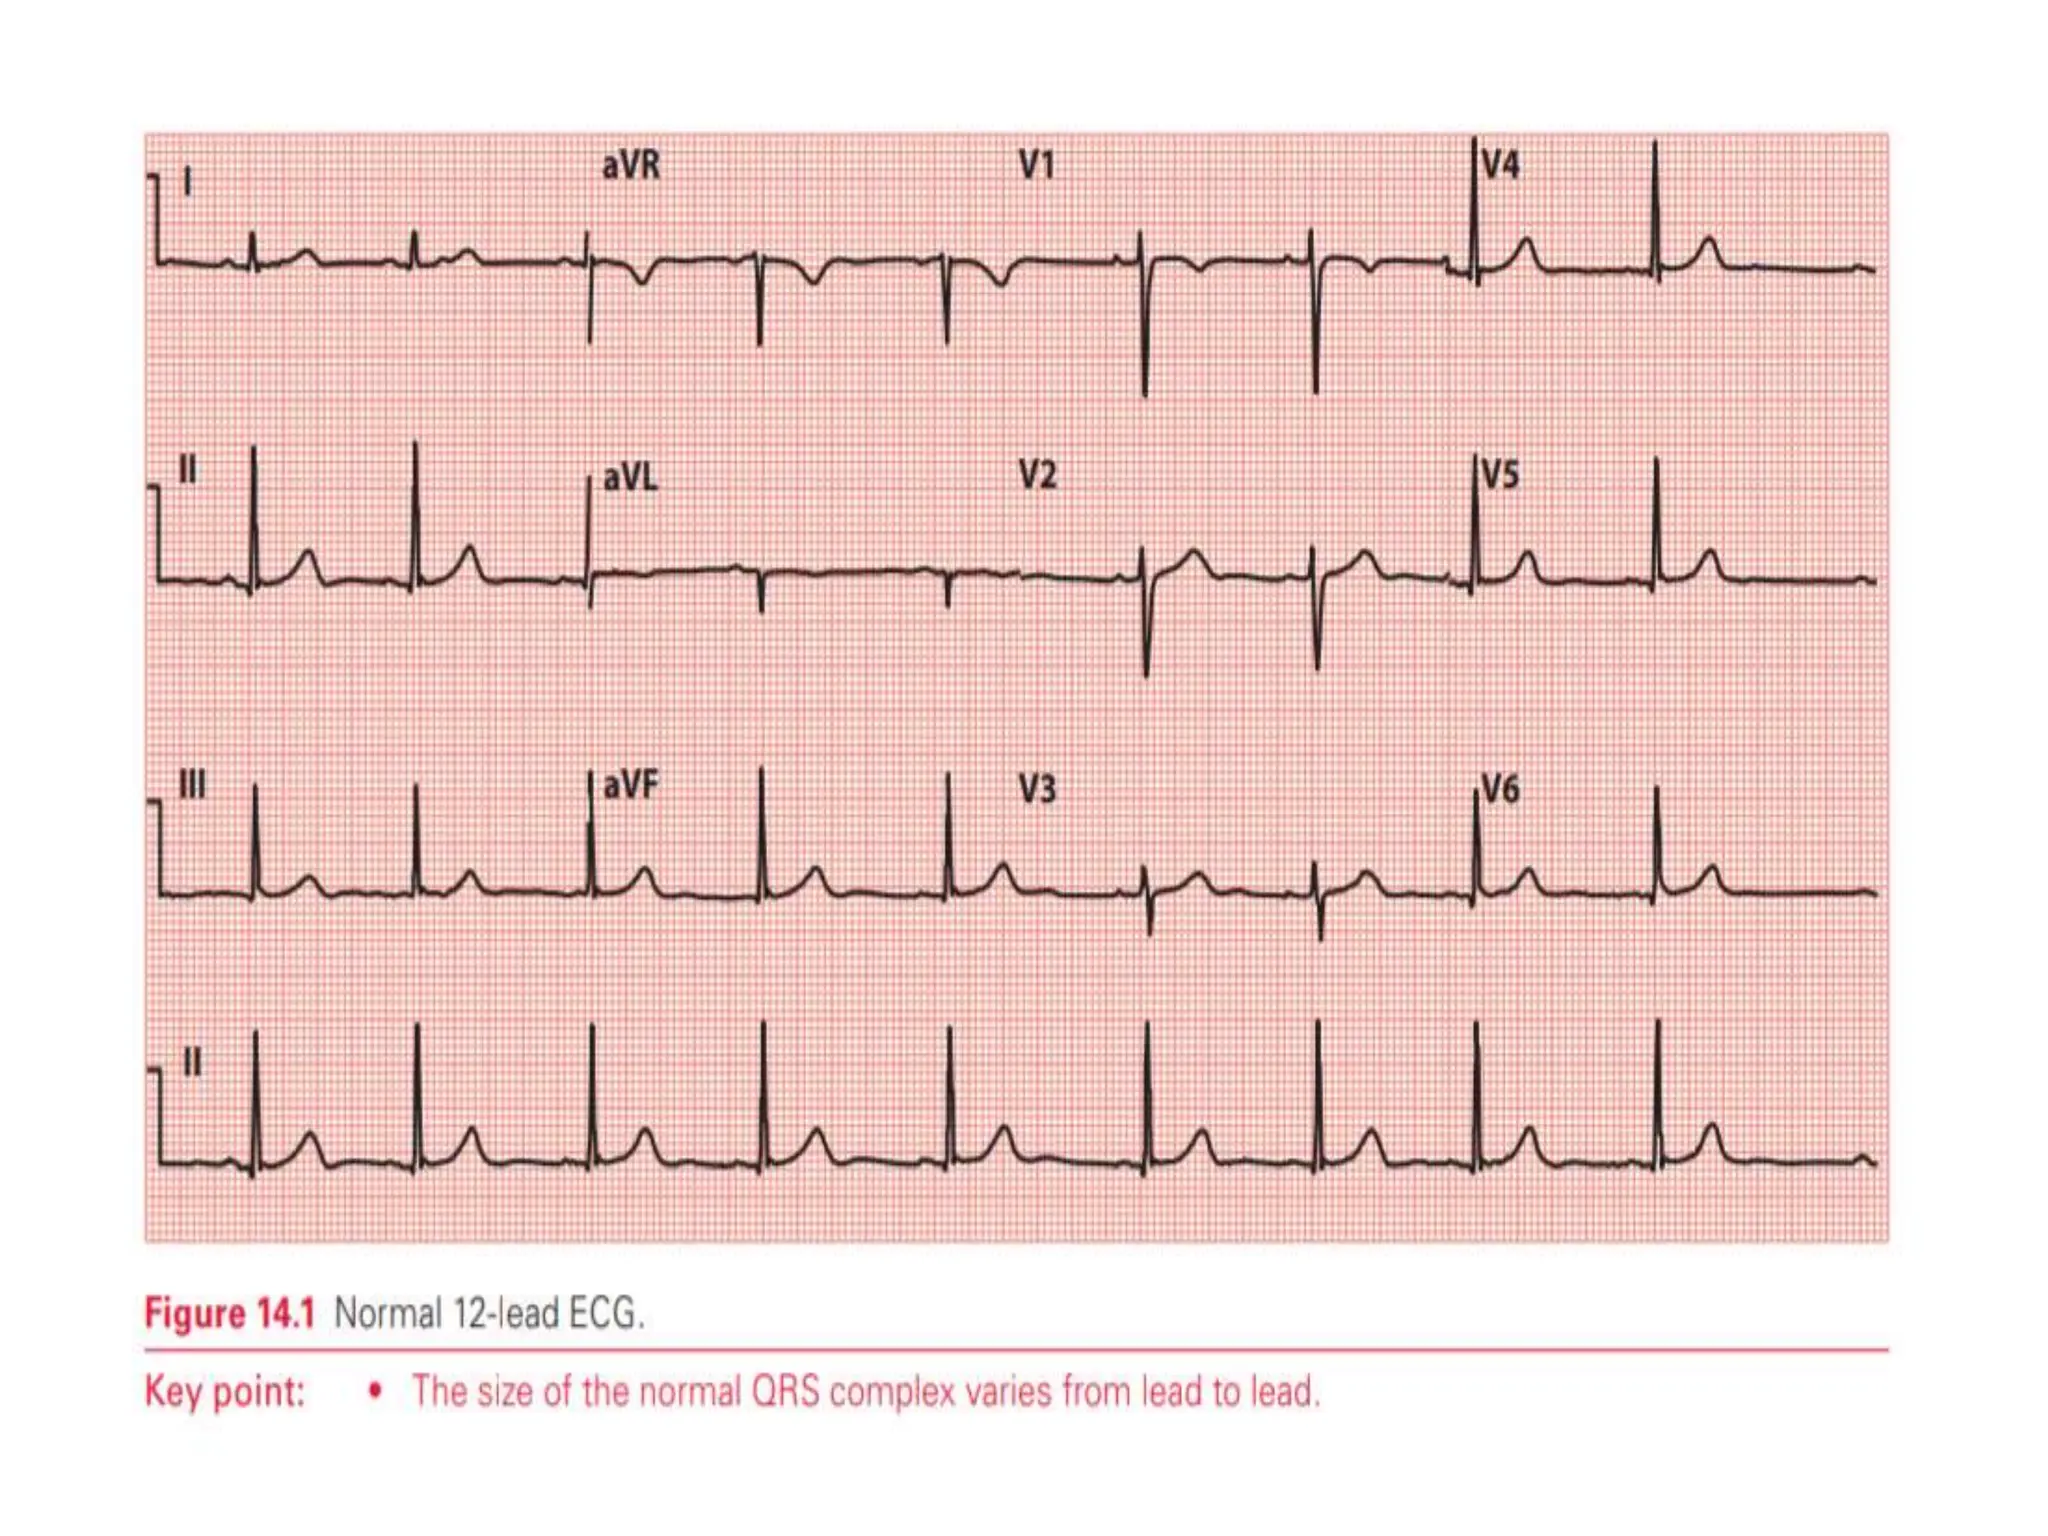
1. The document discusses features of the QRS complex that should be considered when analyzing an ECG, including pathological Q waves, large R or S waves, dominant R waves in certain leads, poor R wave progression, and QRS width and morphology.
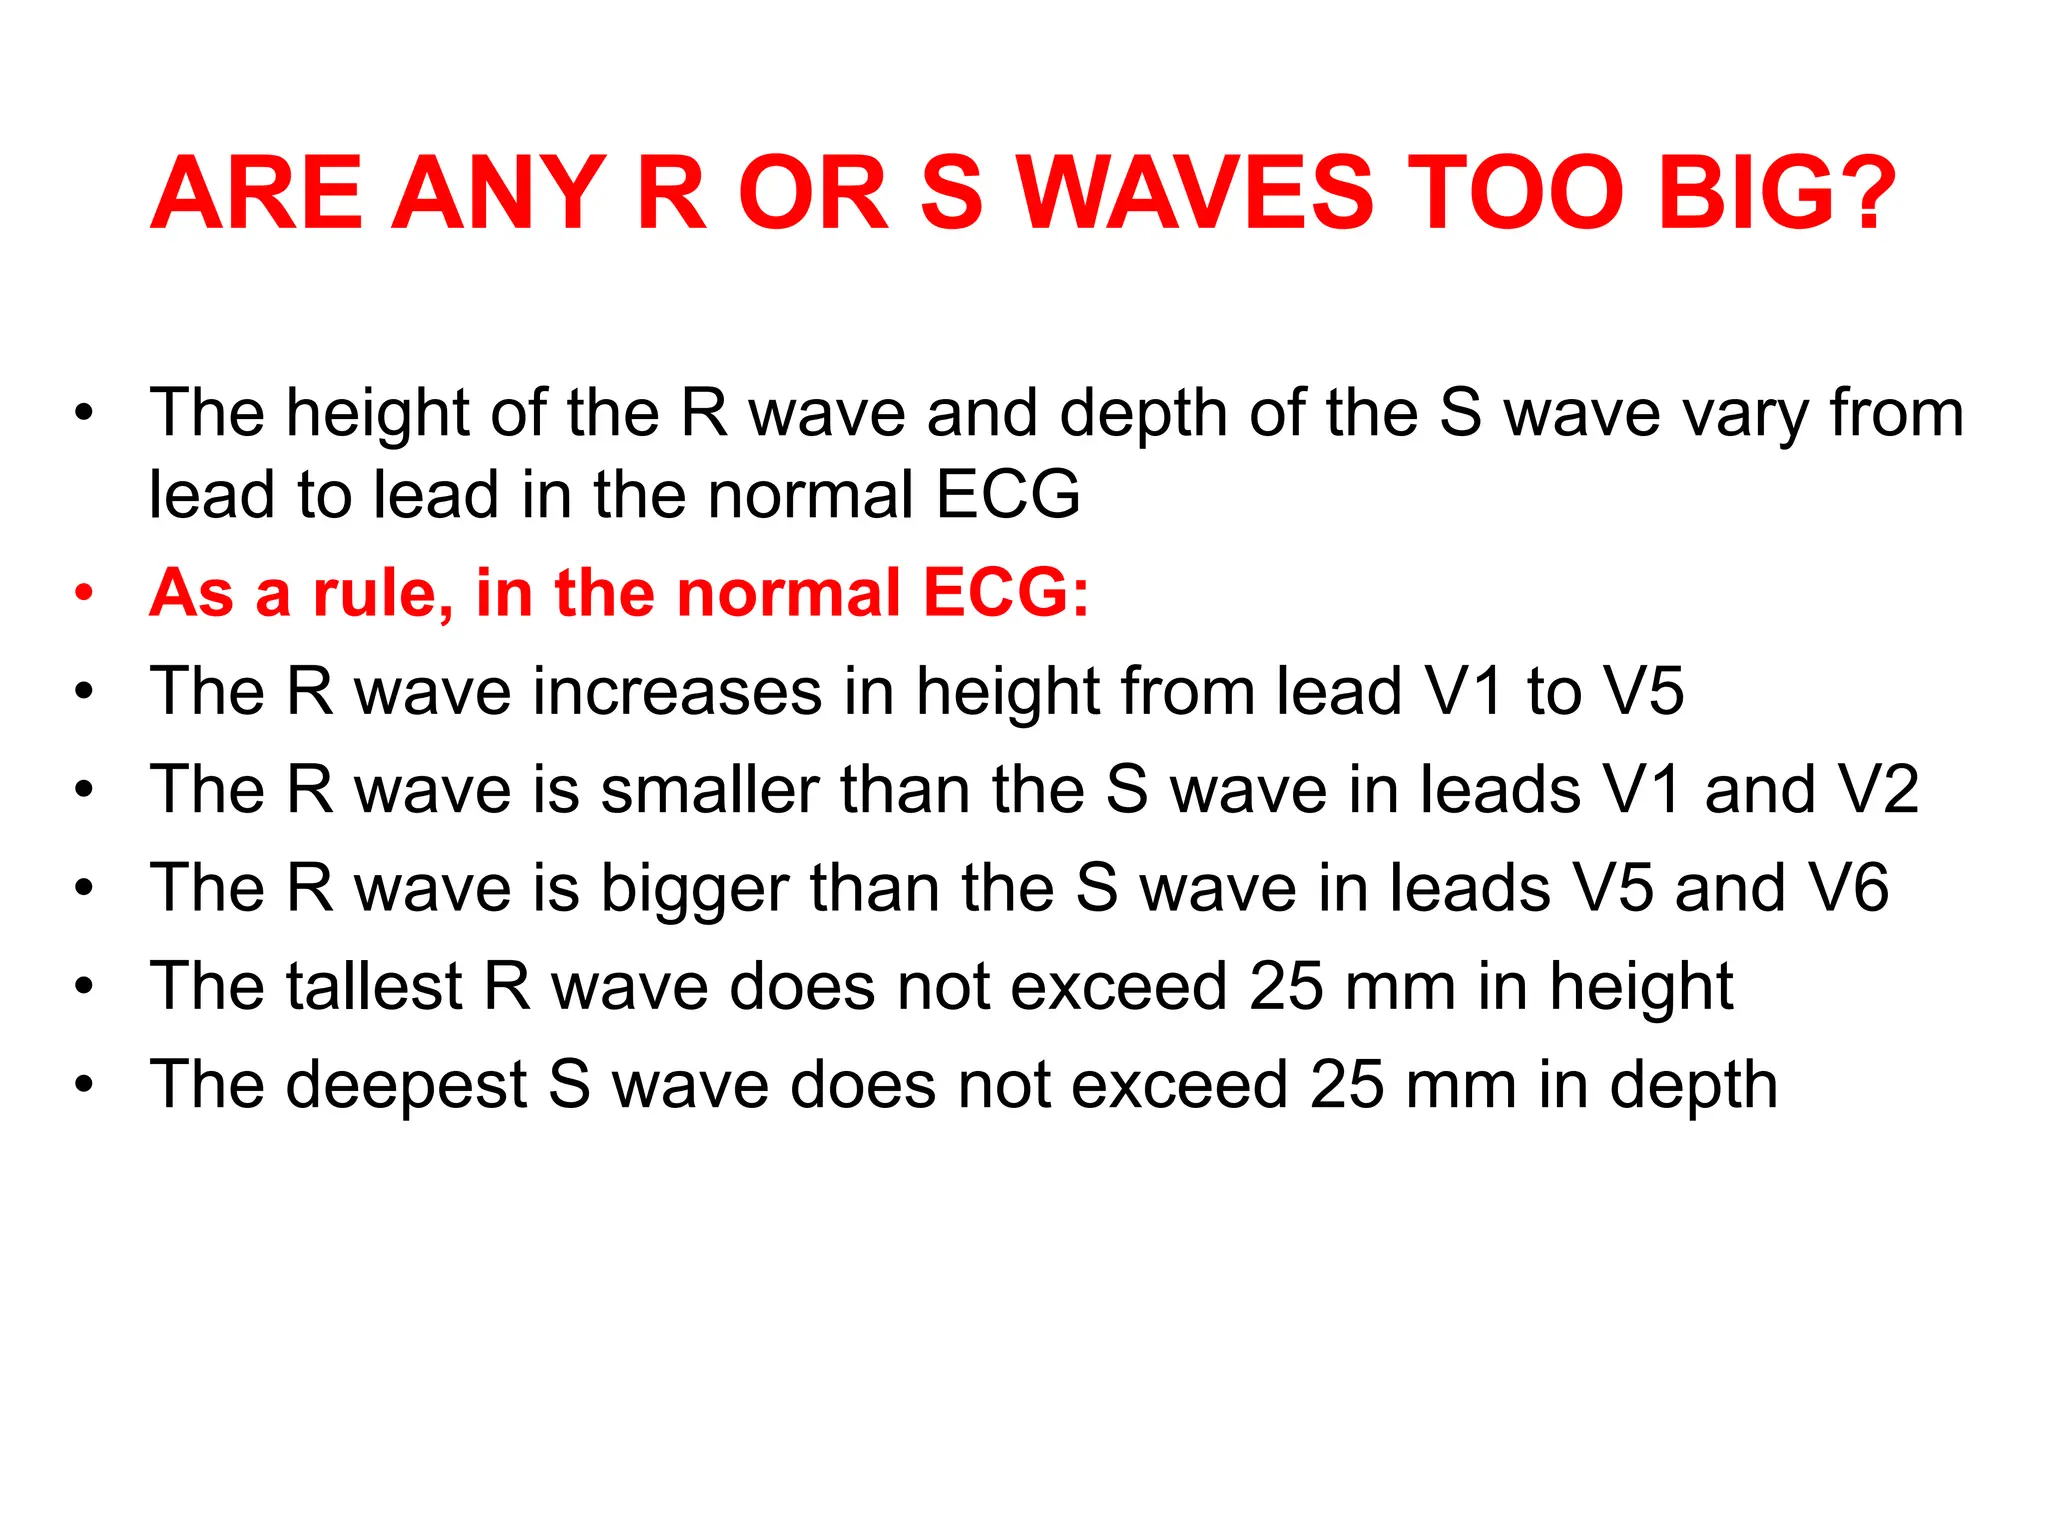
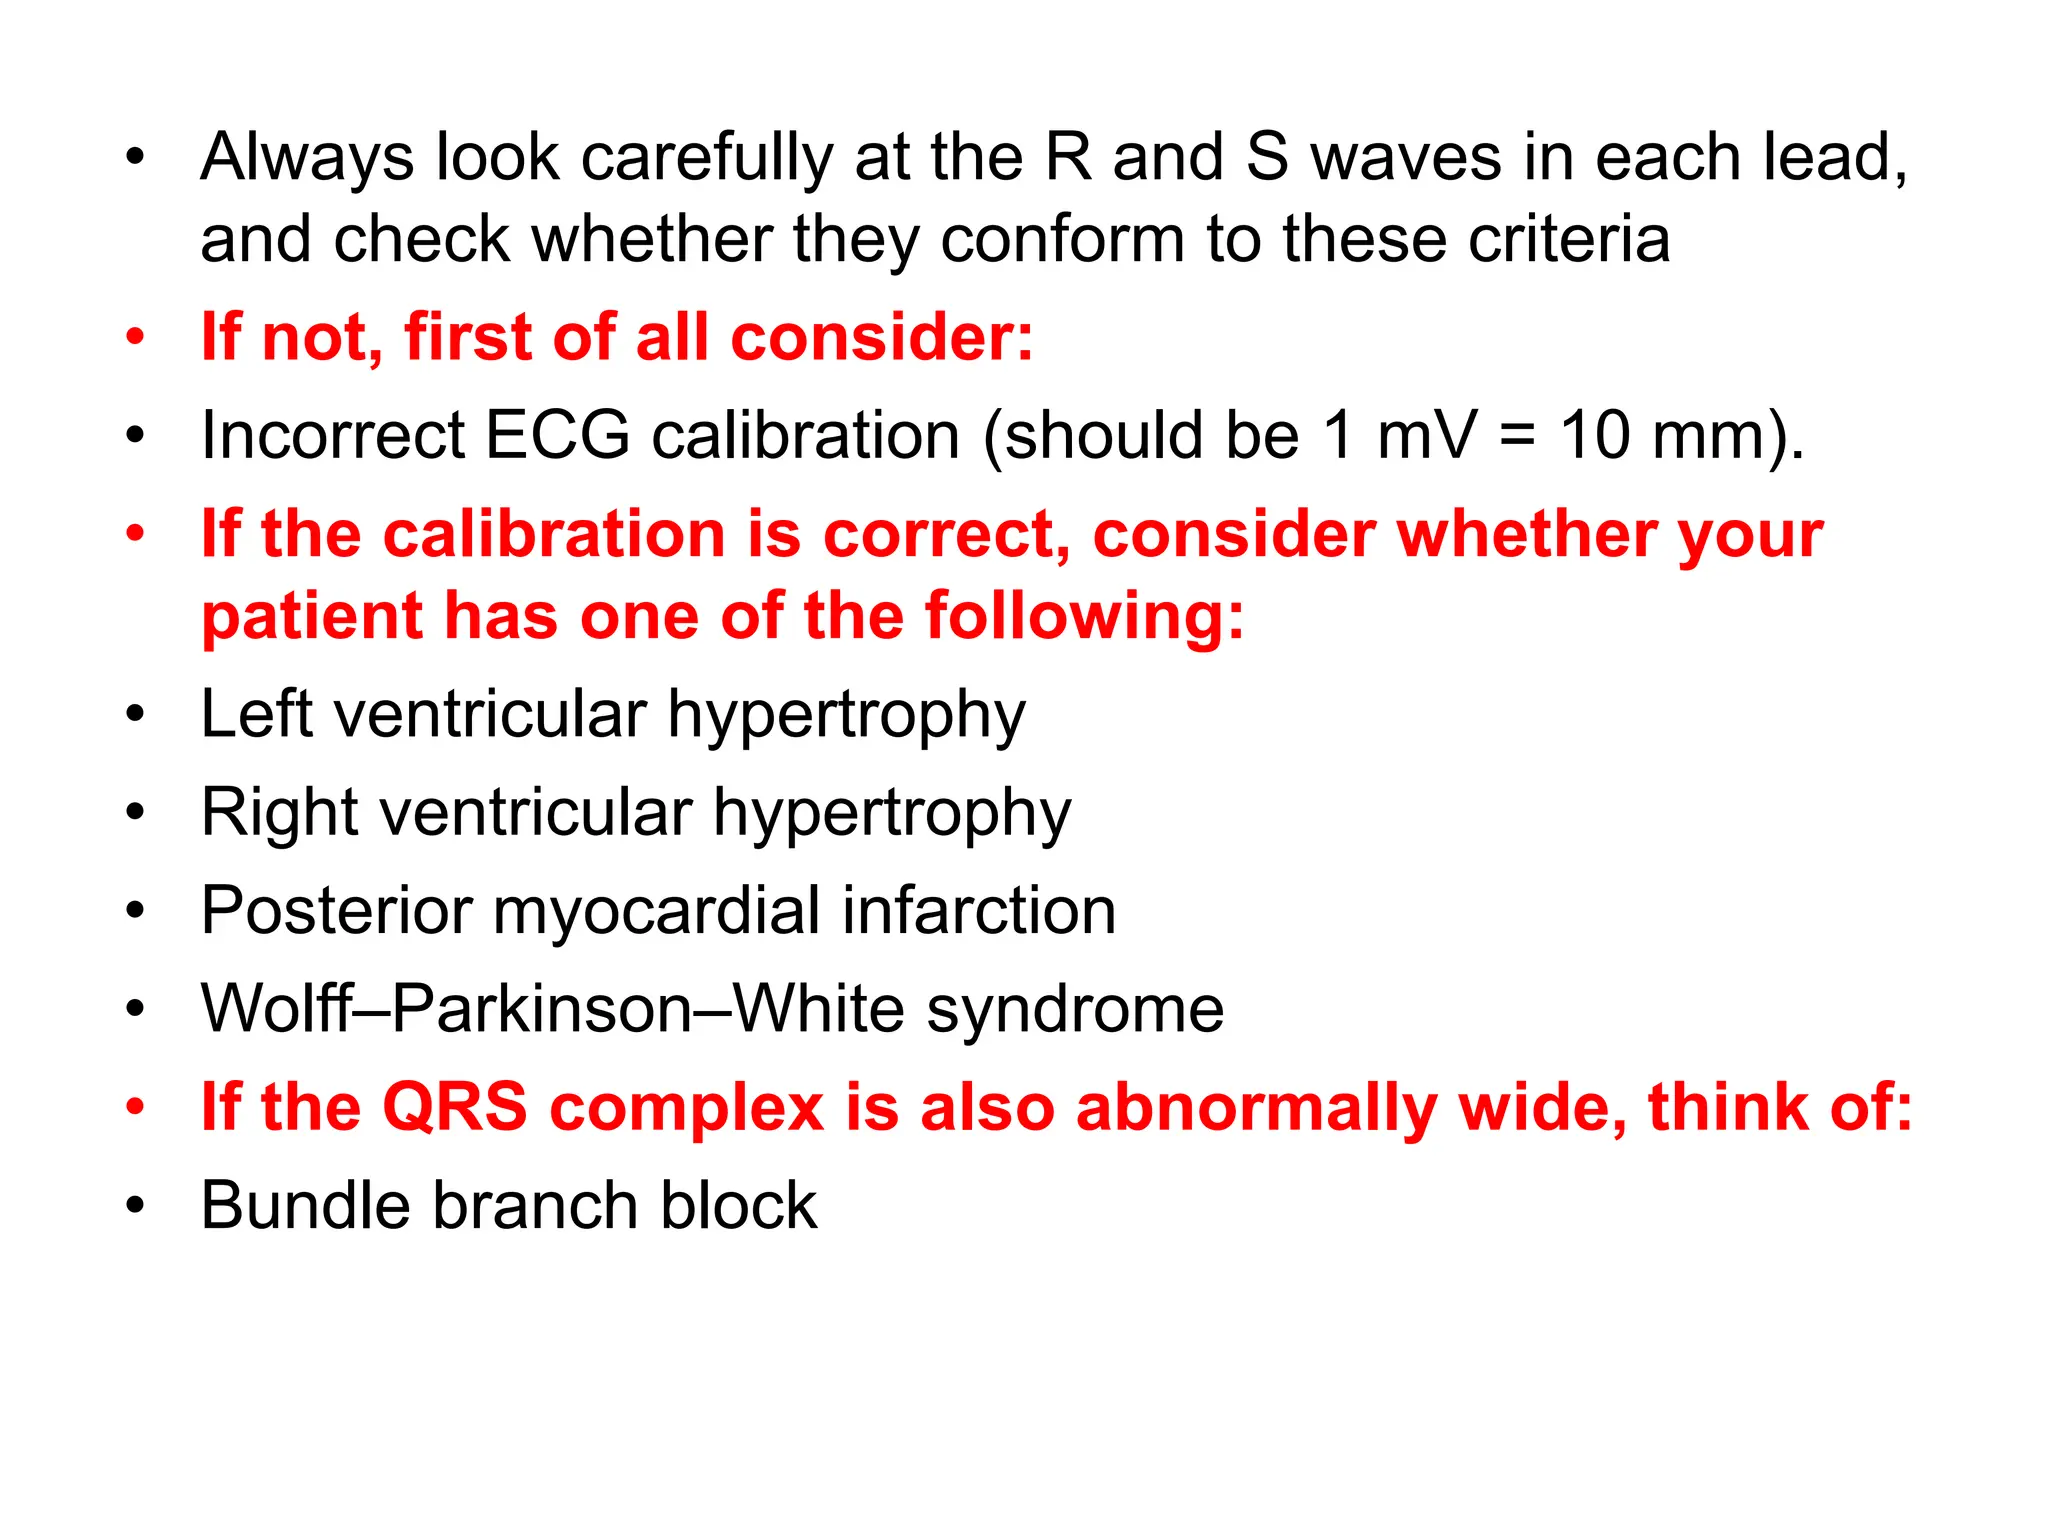
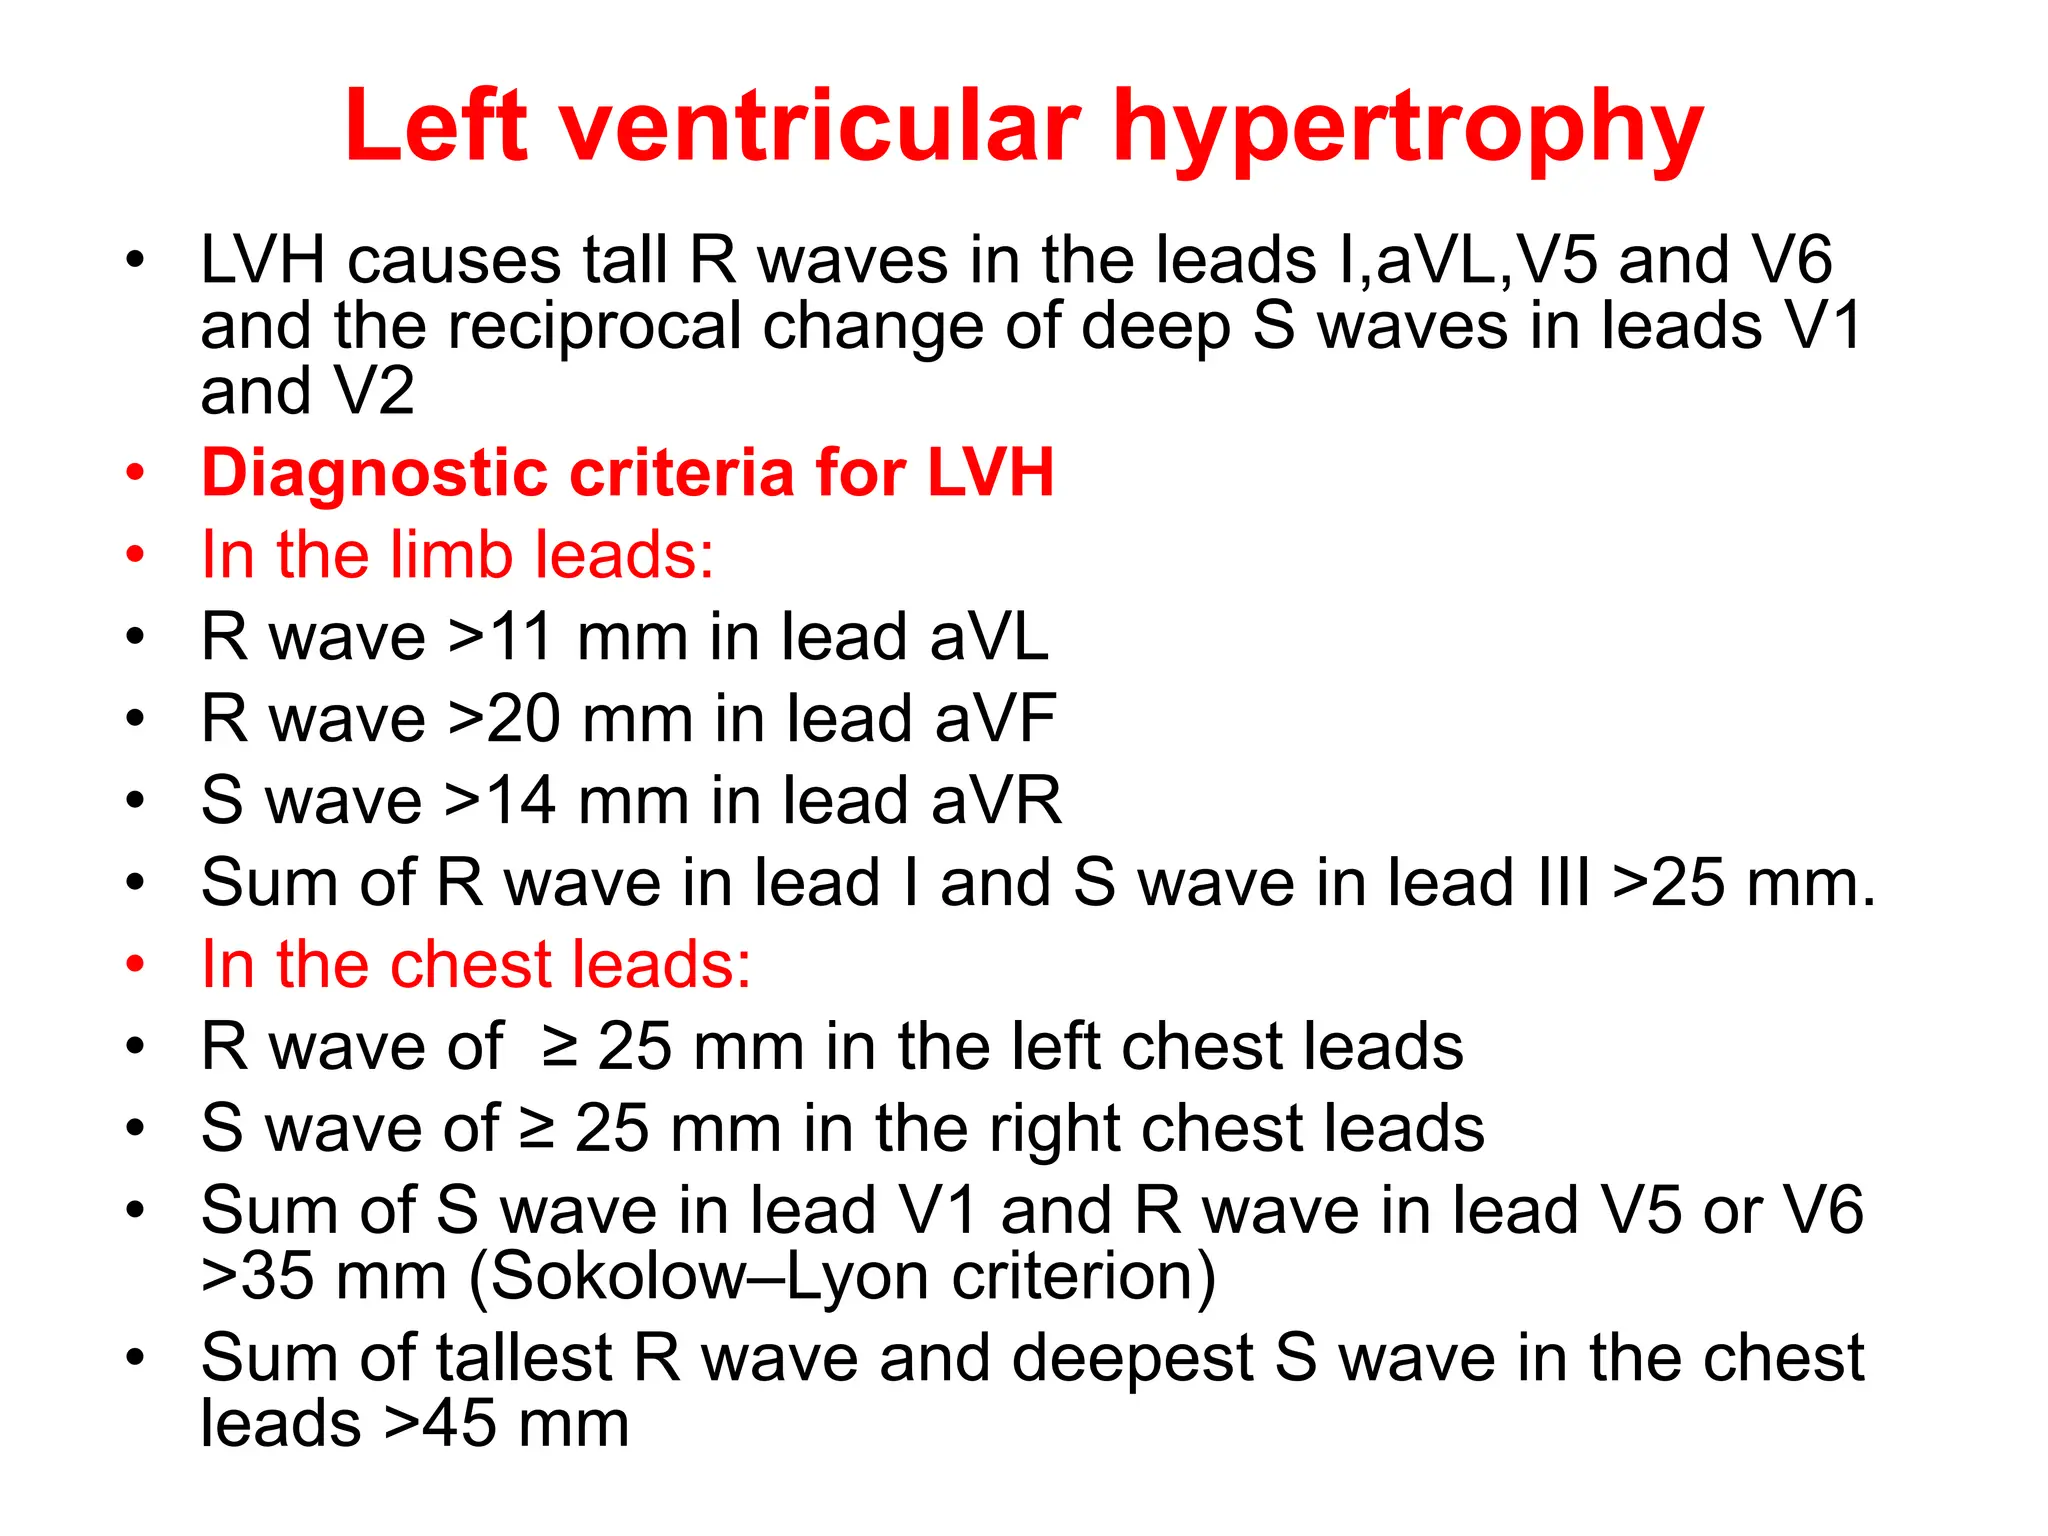
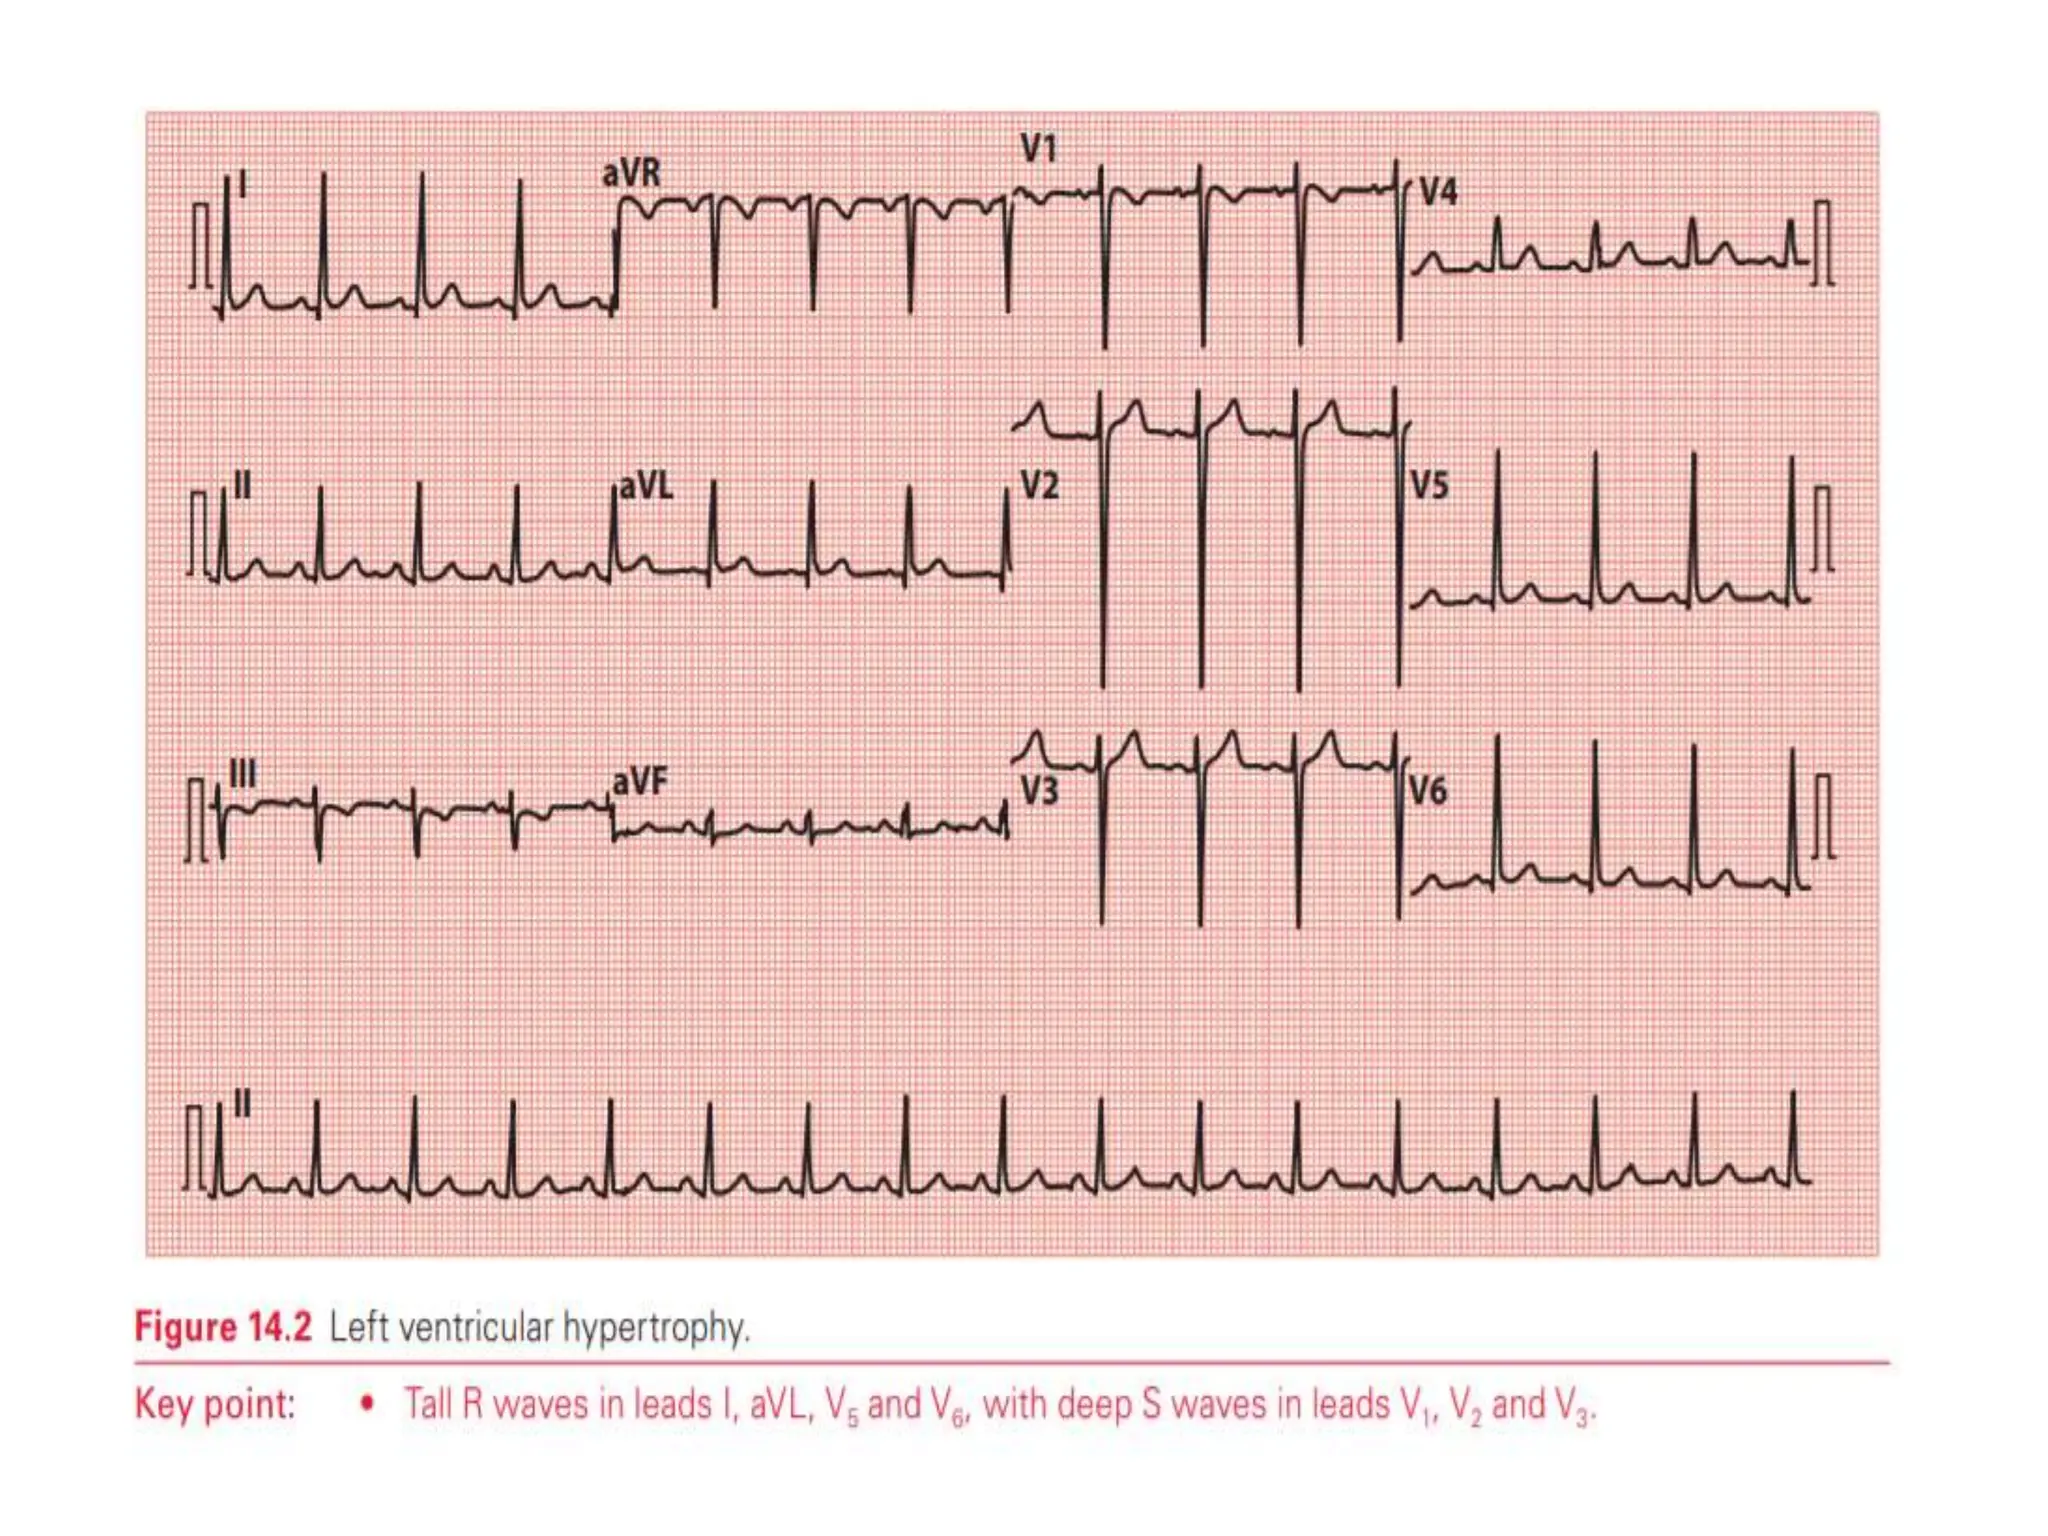
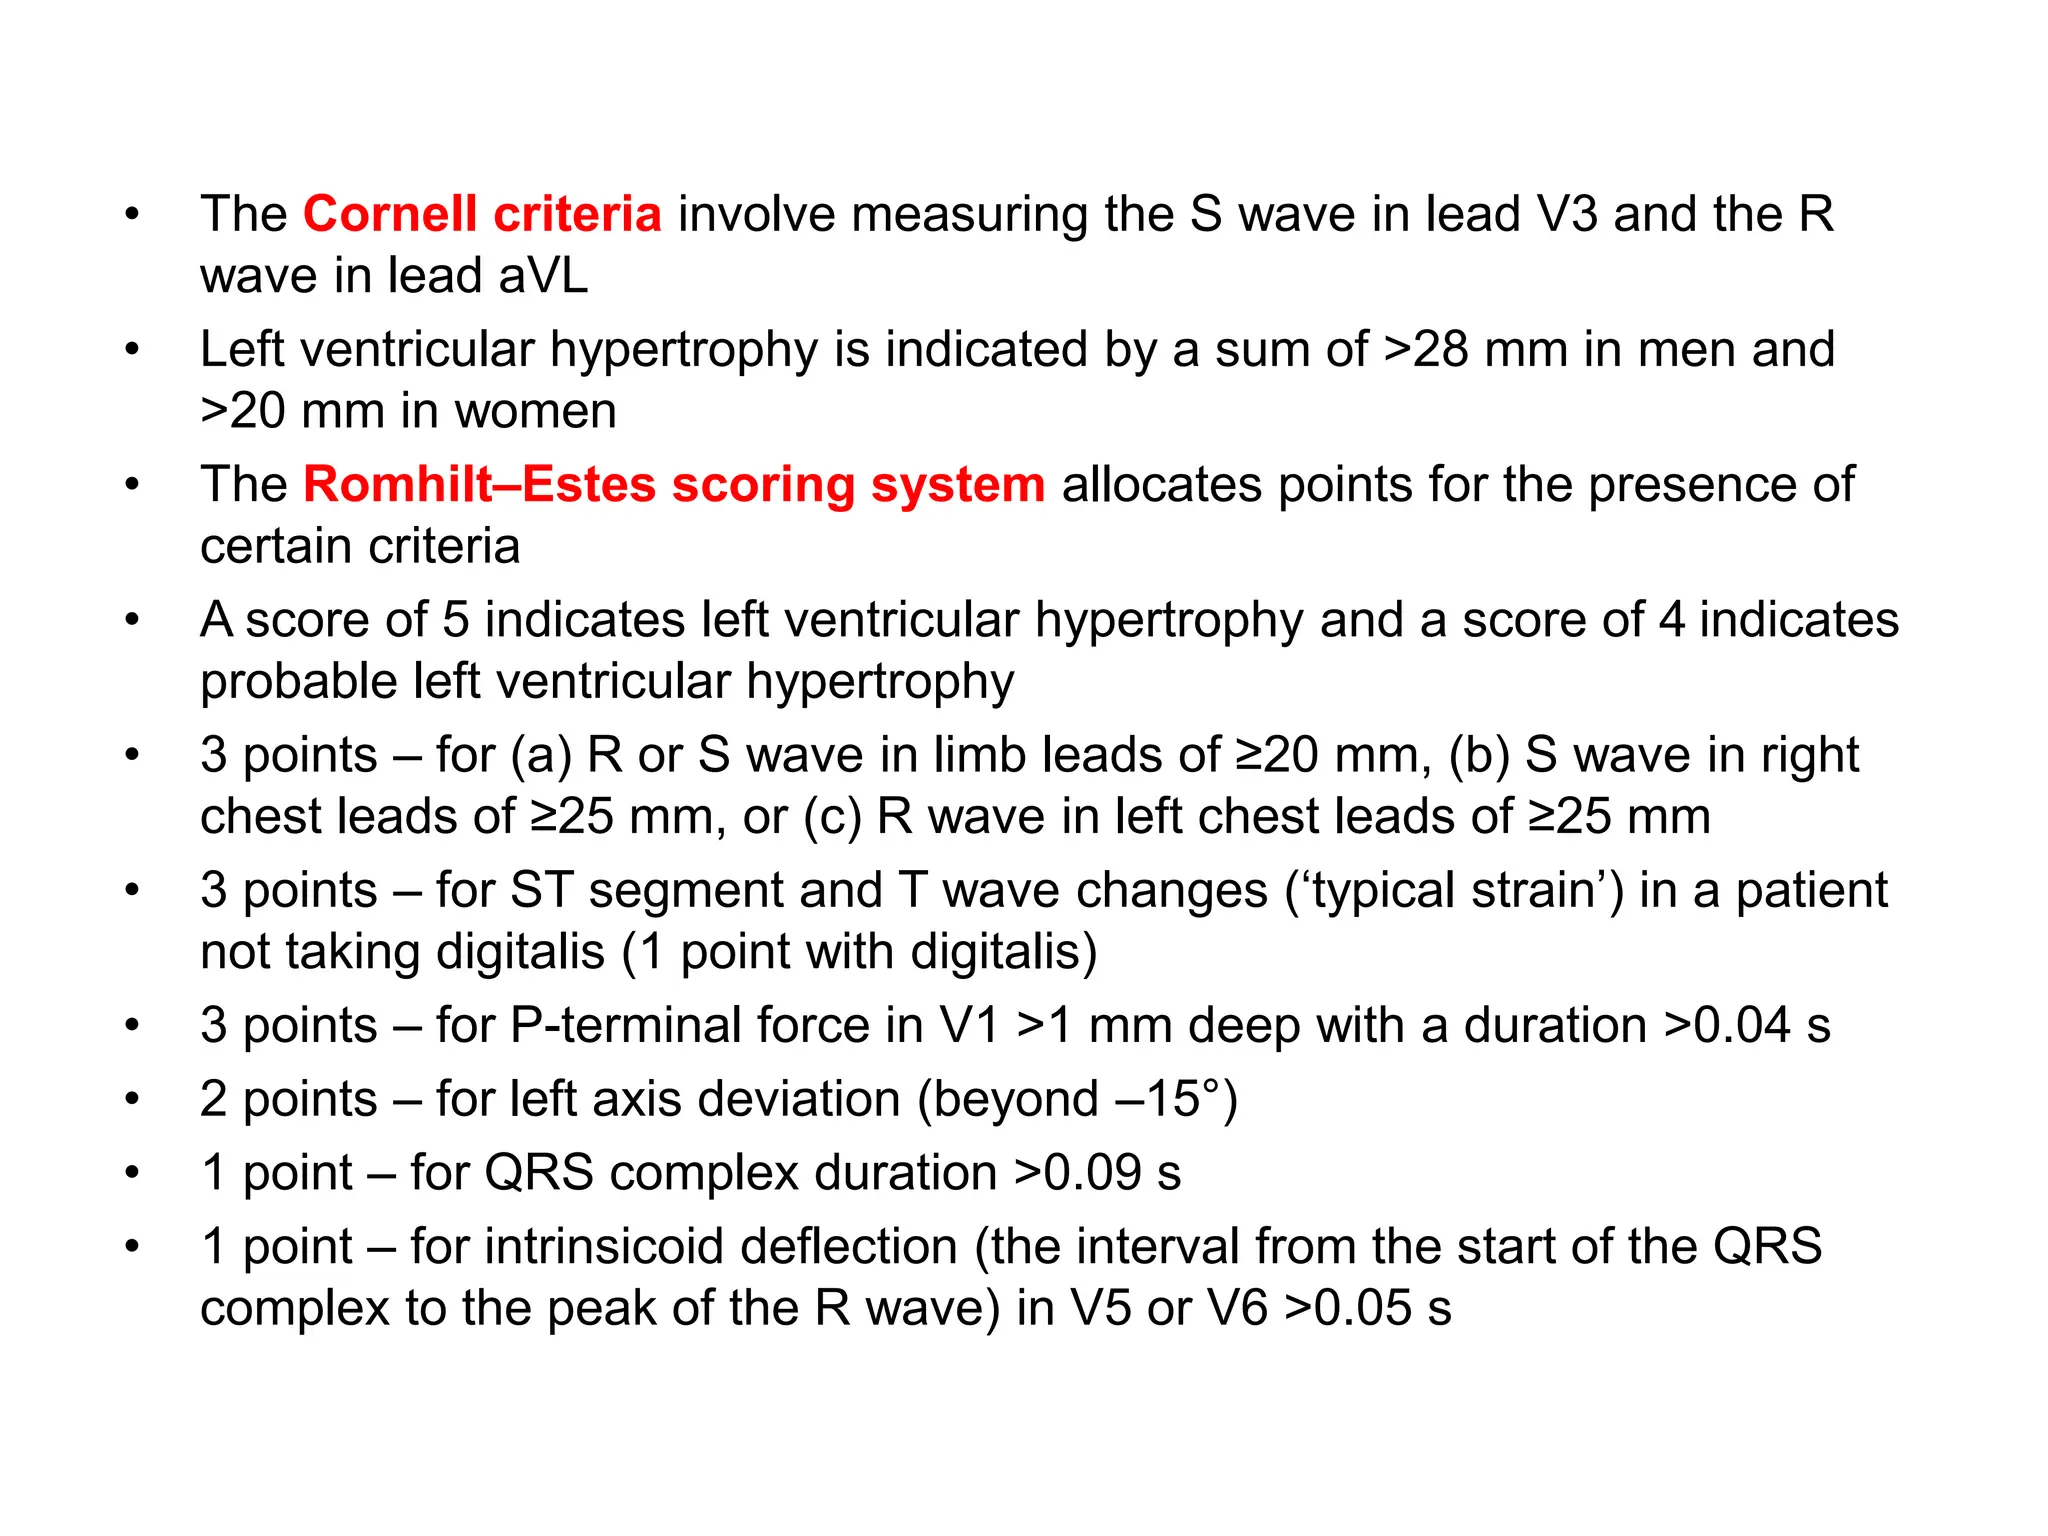
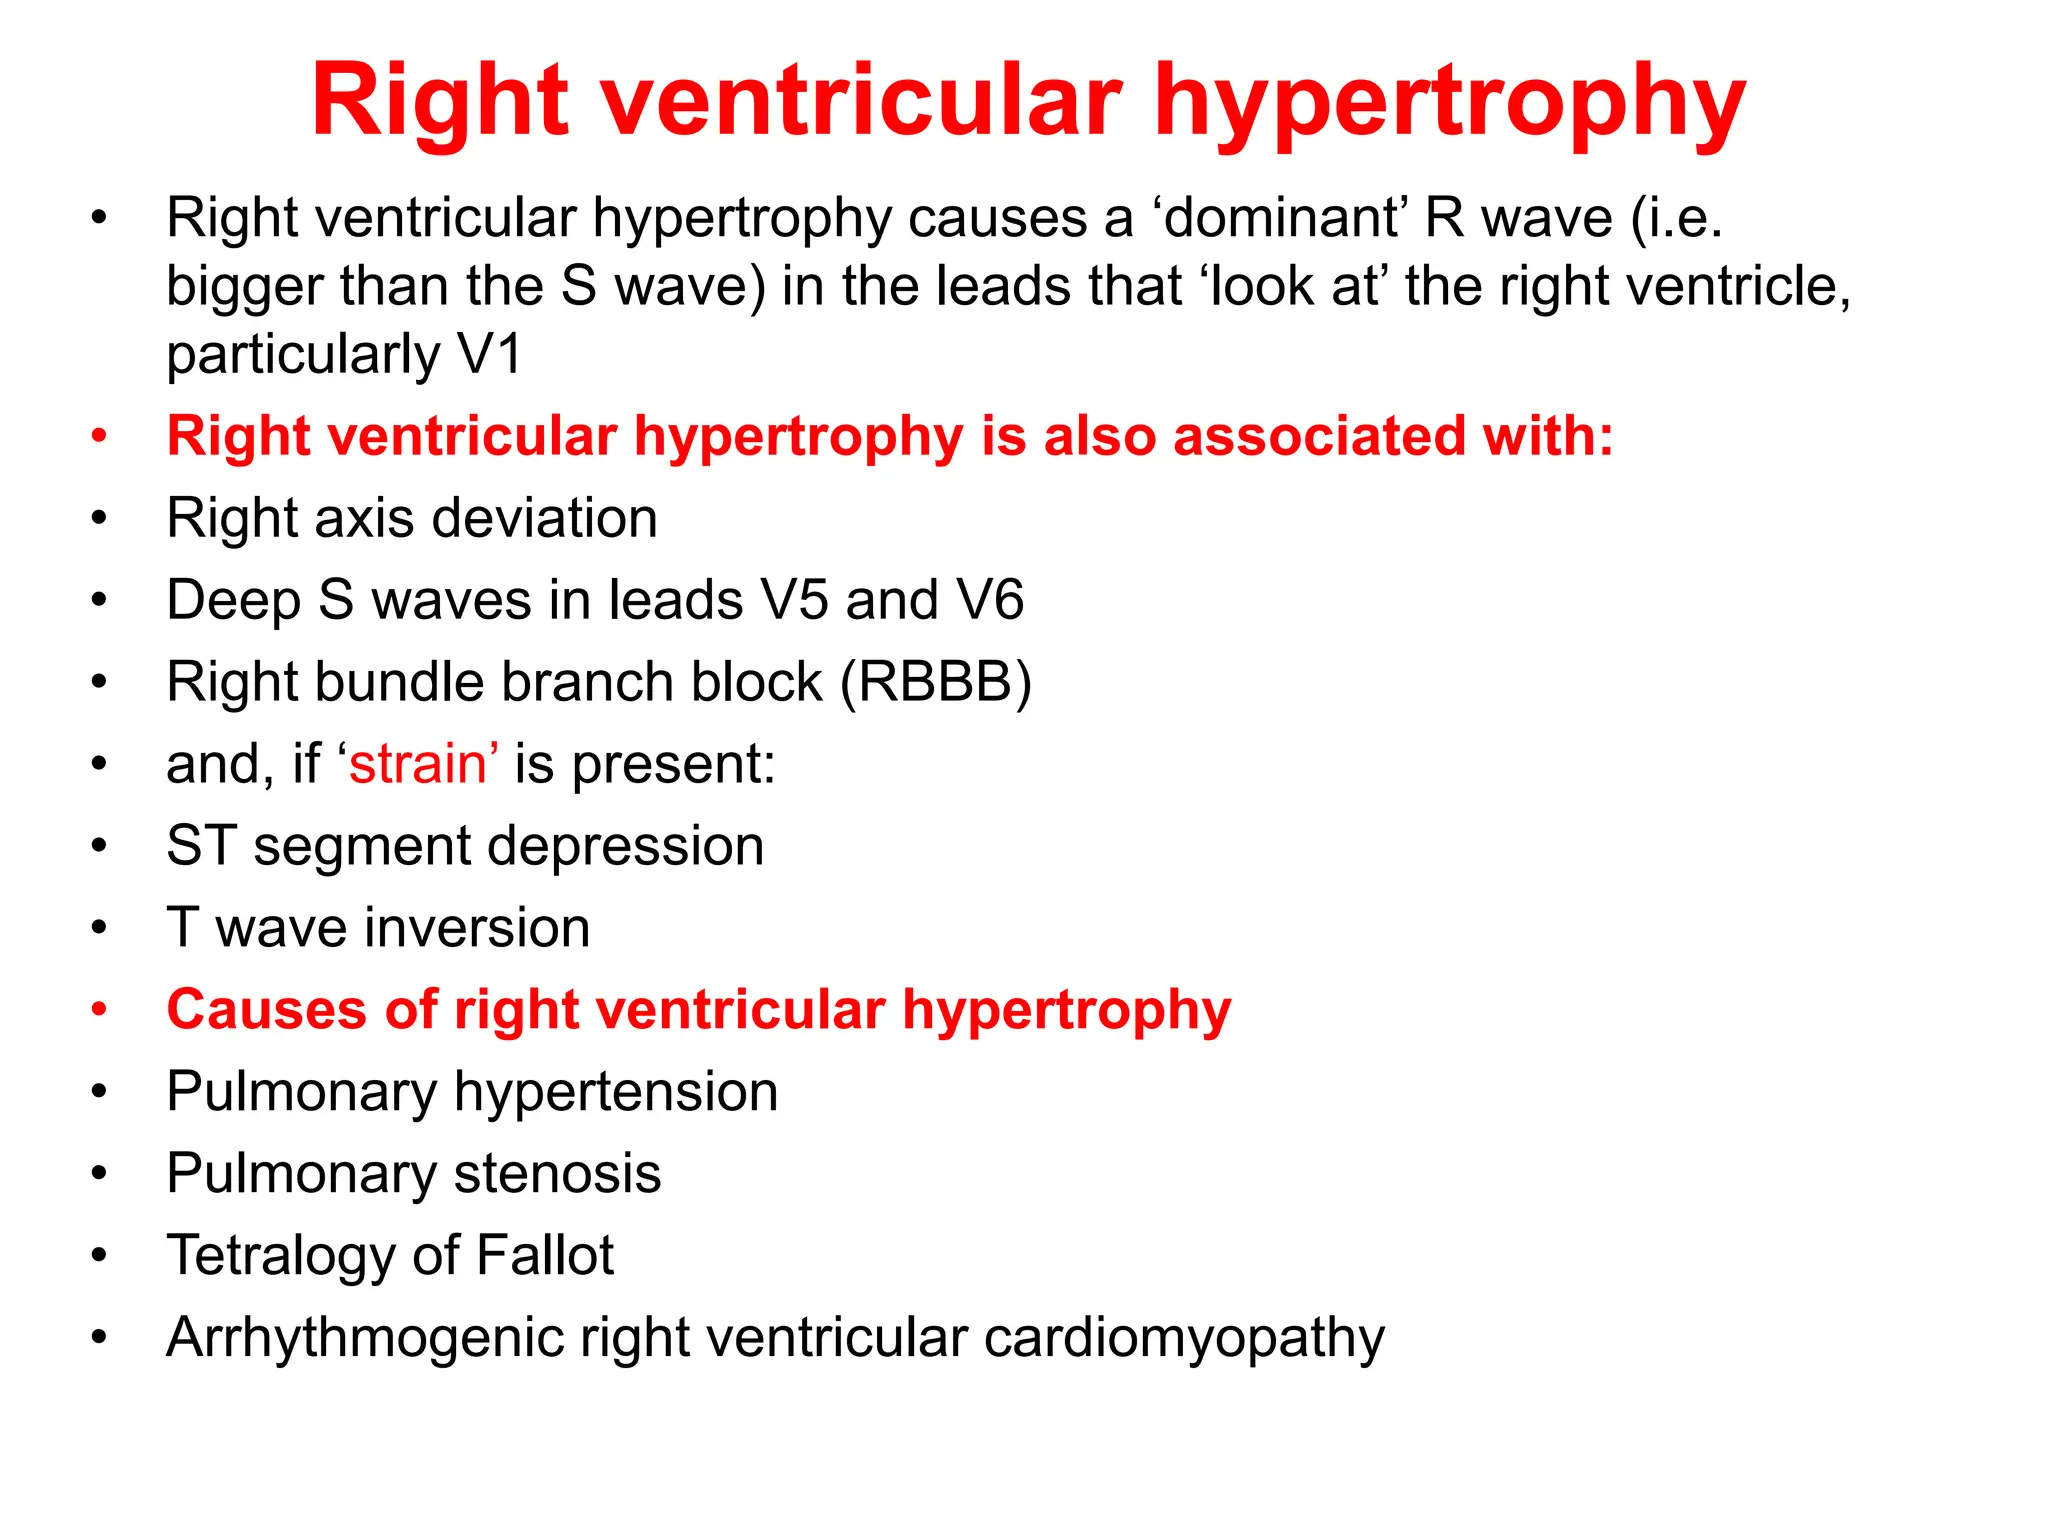
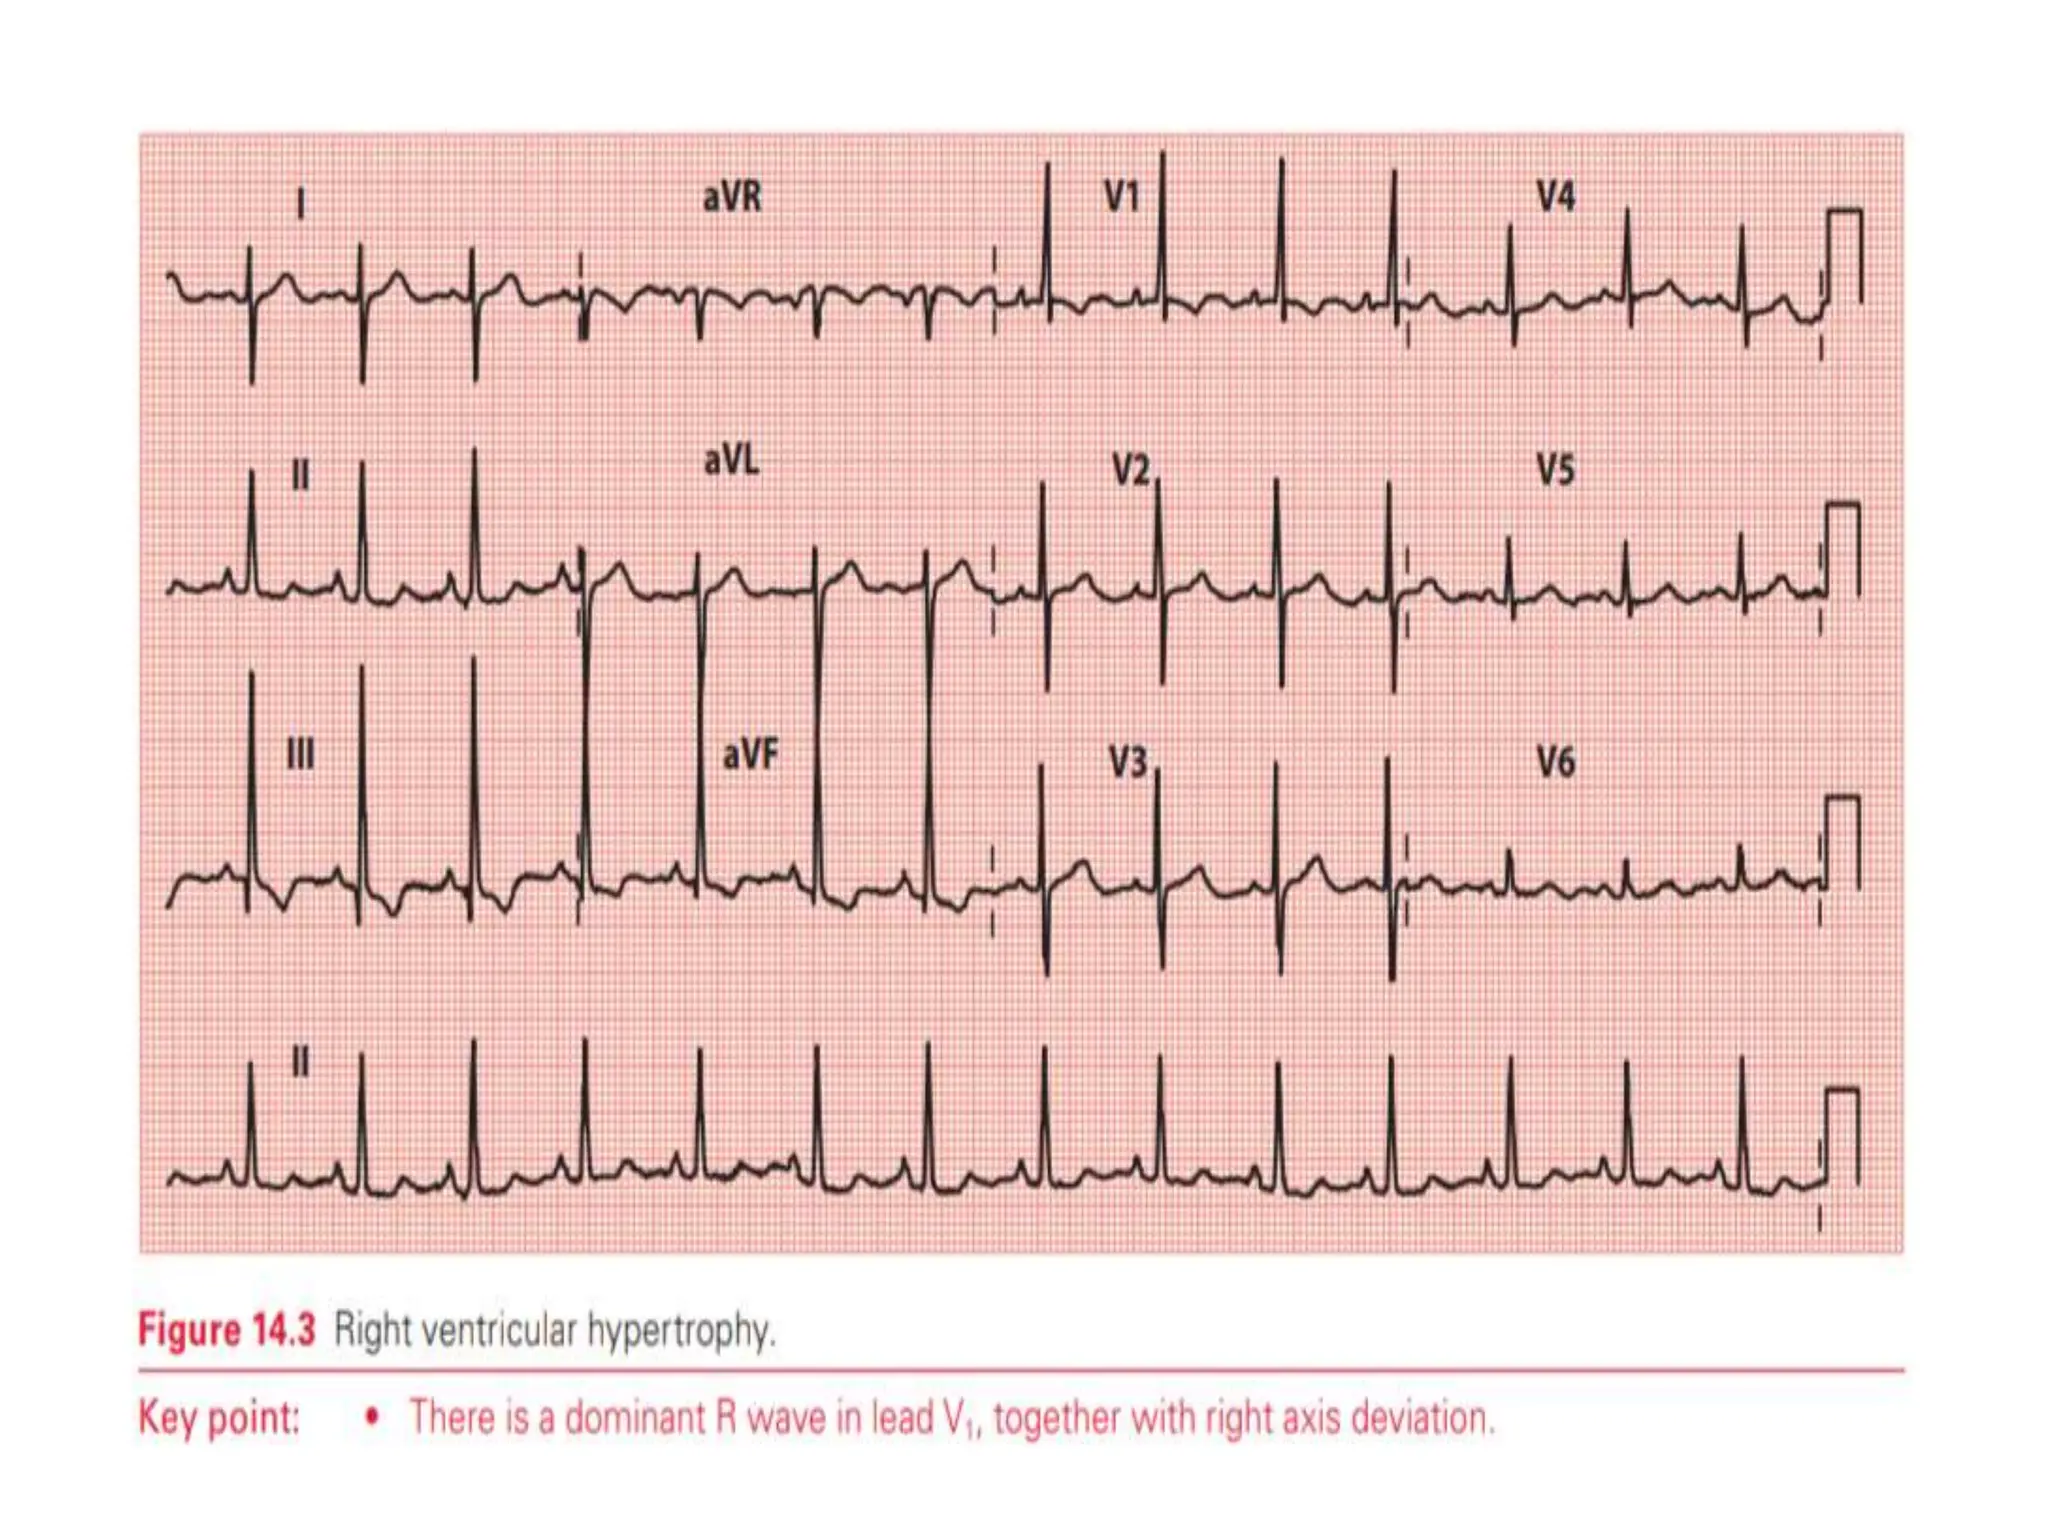
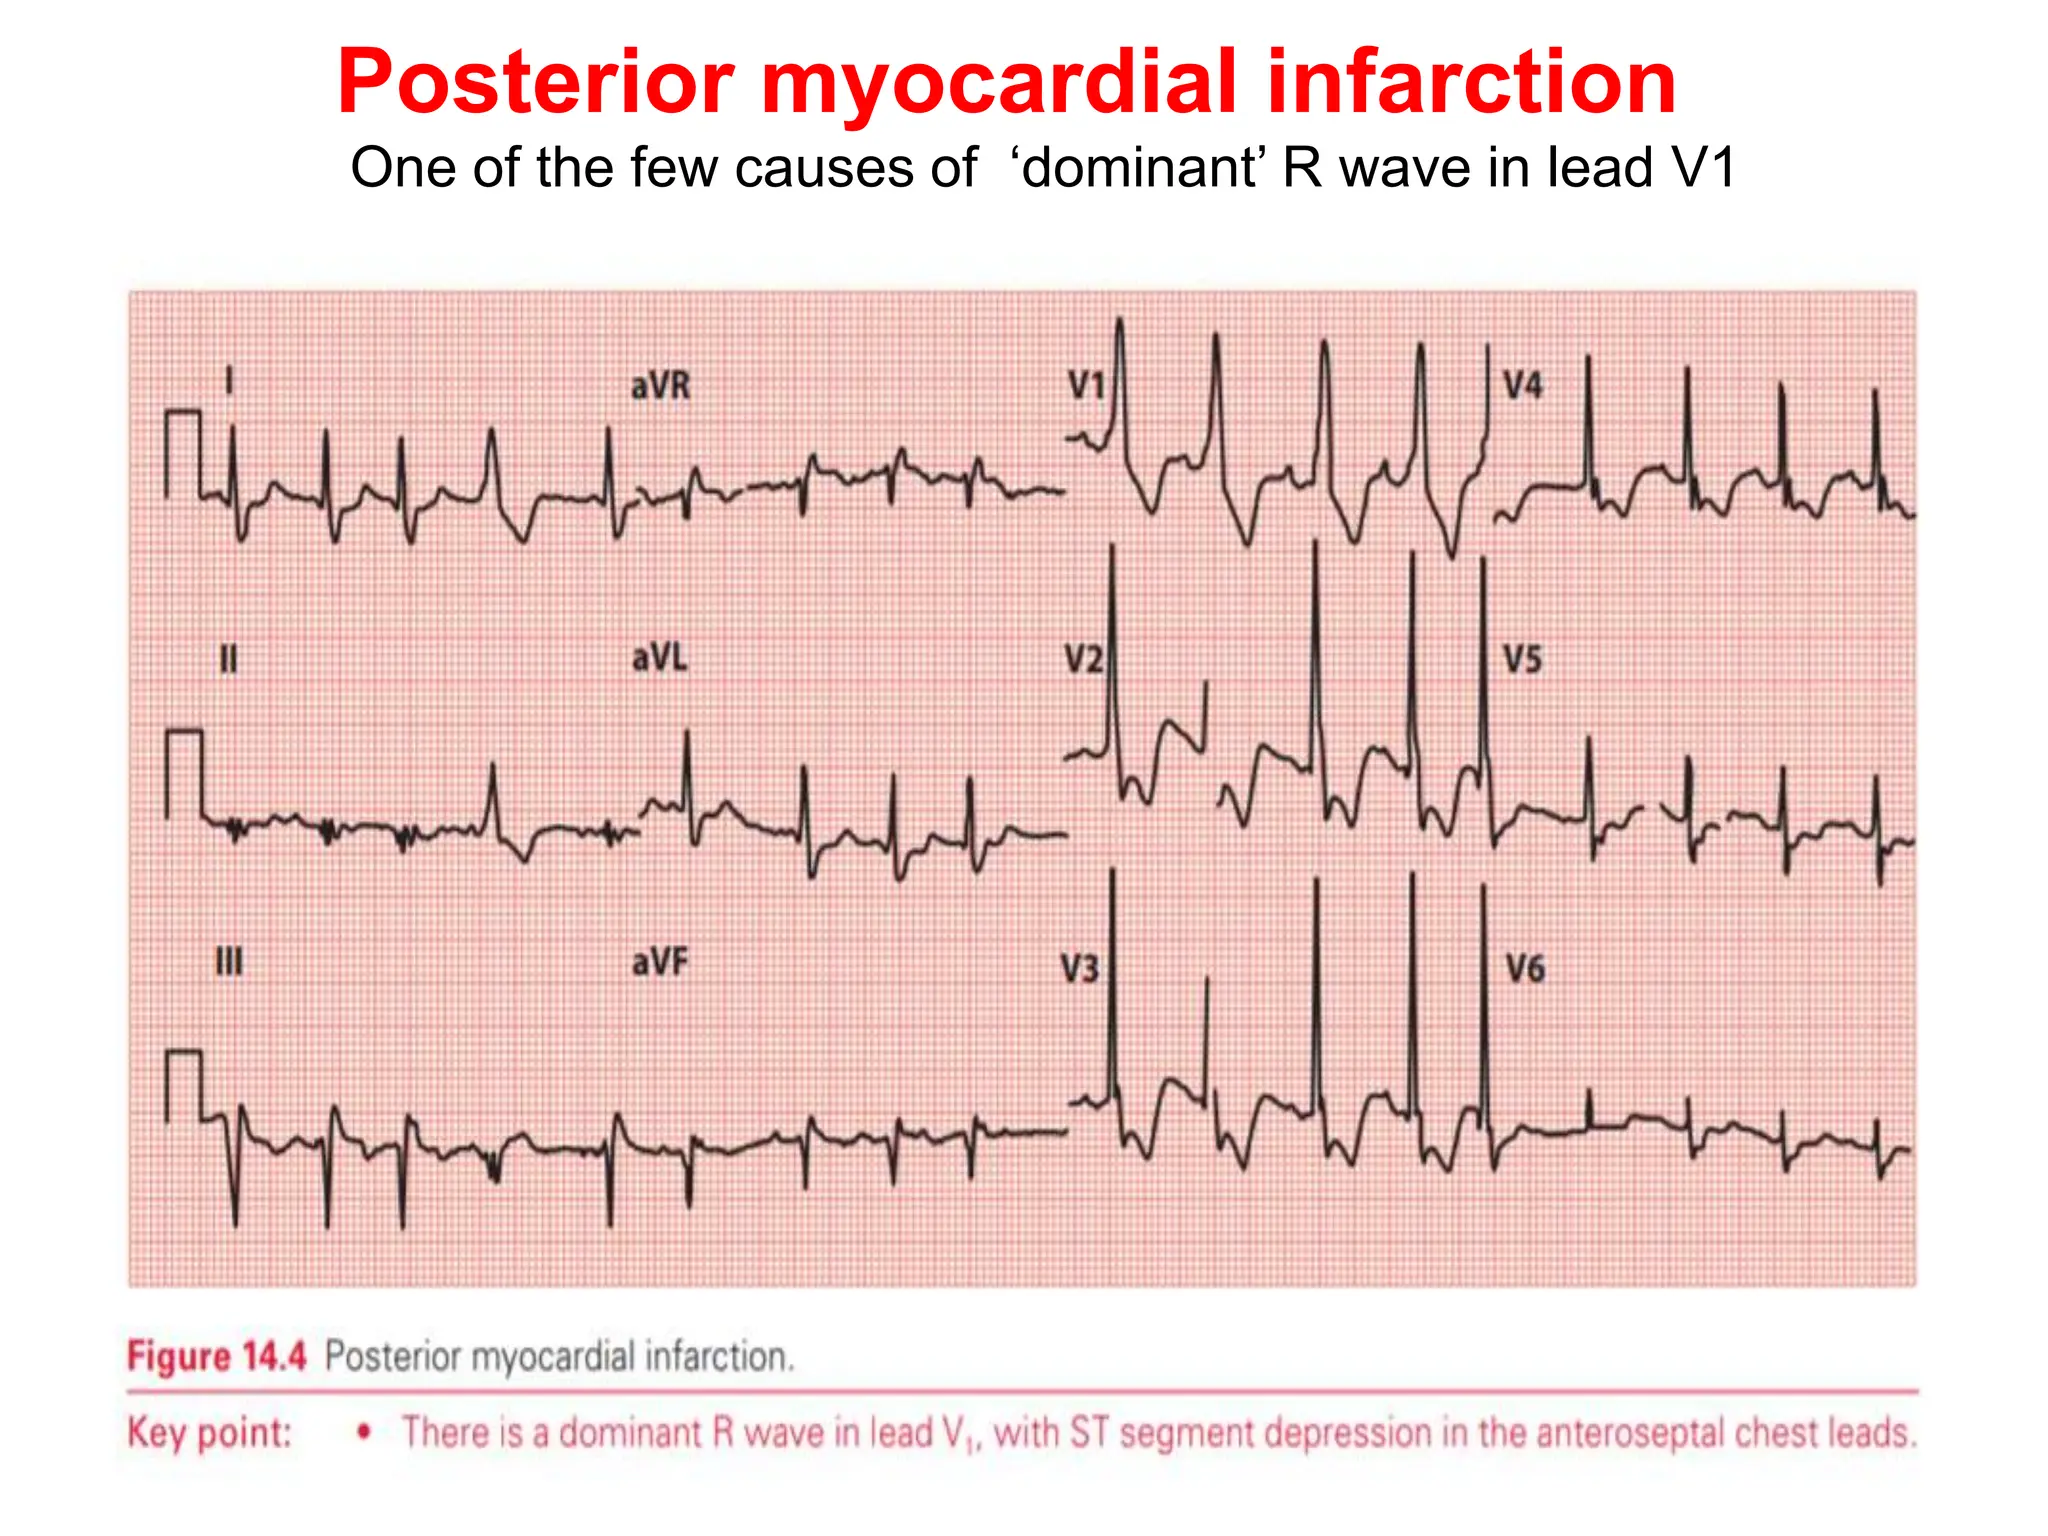
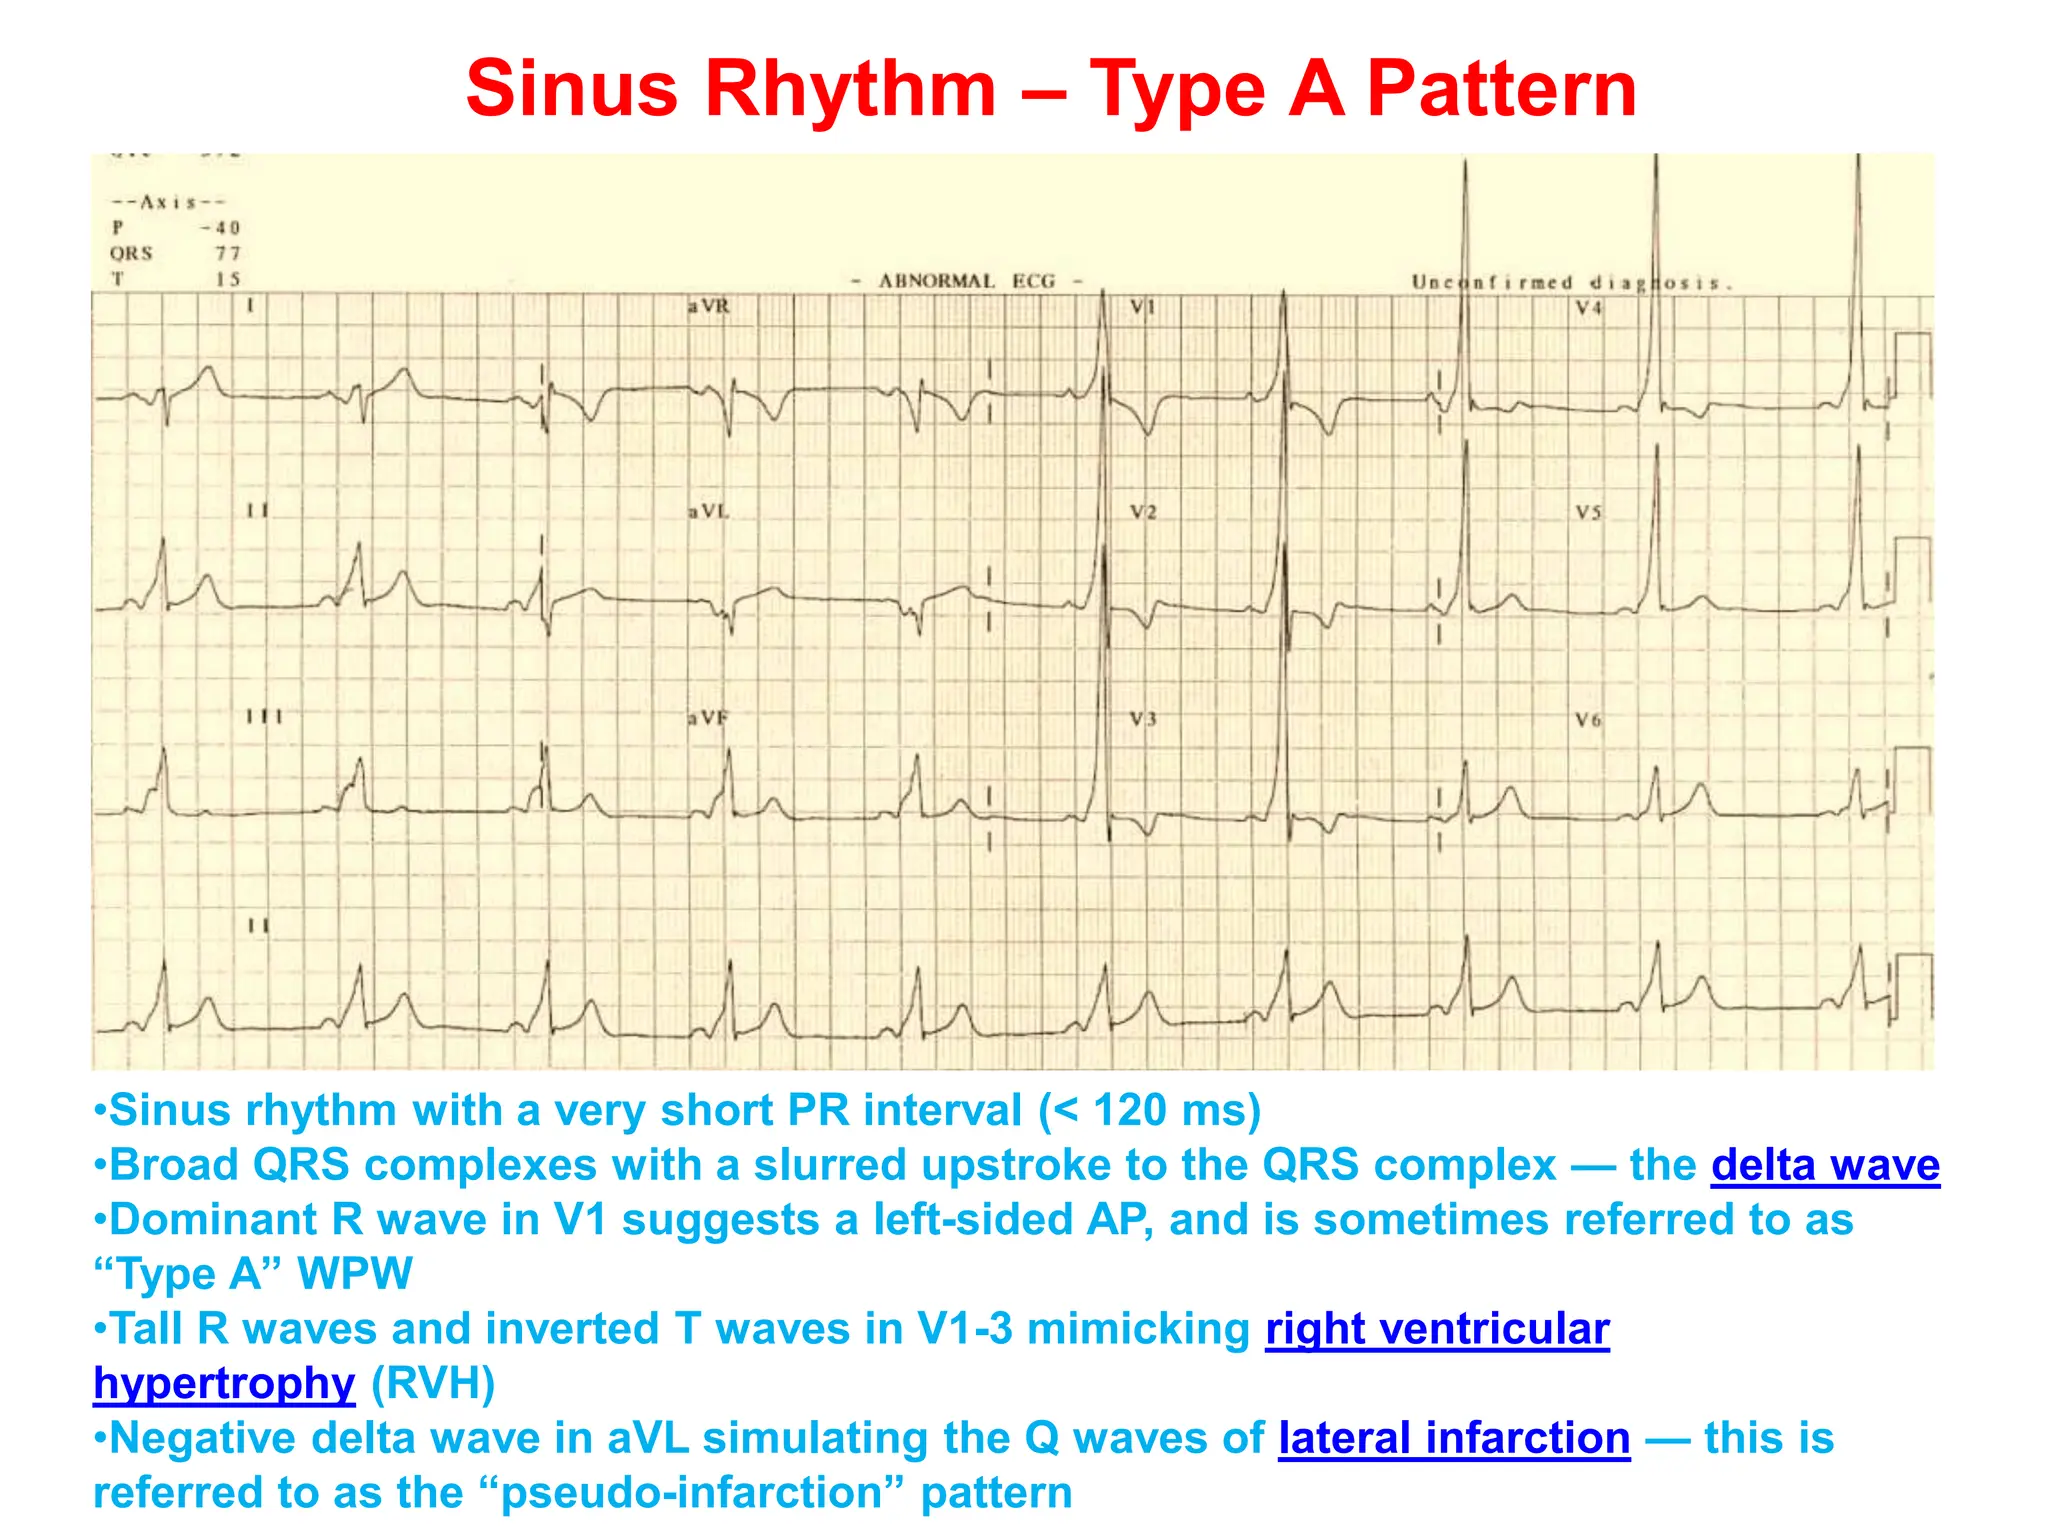
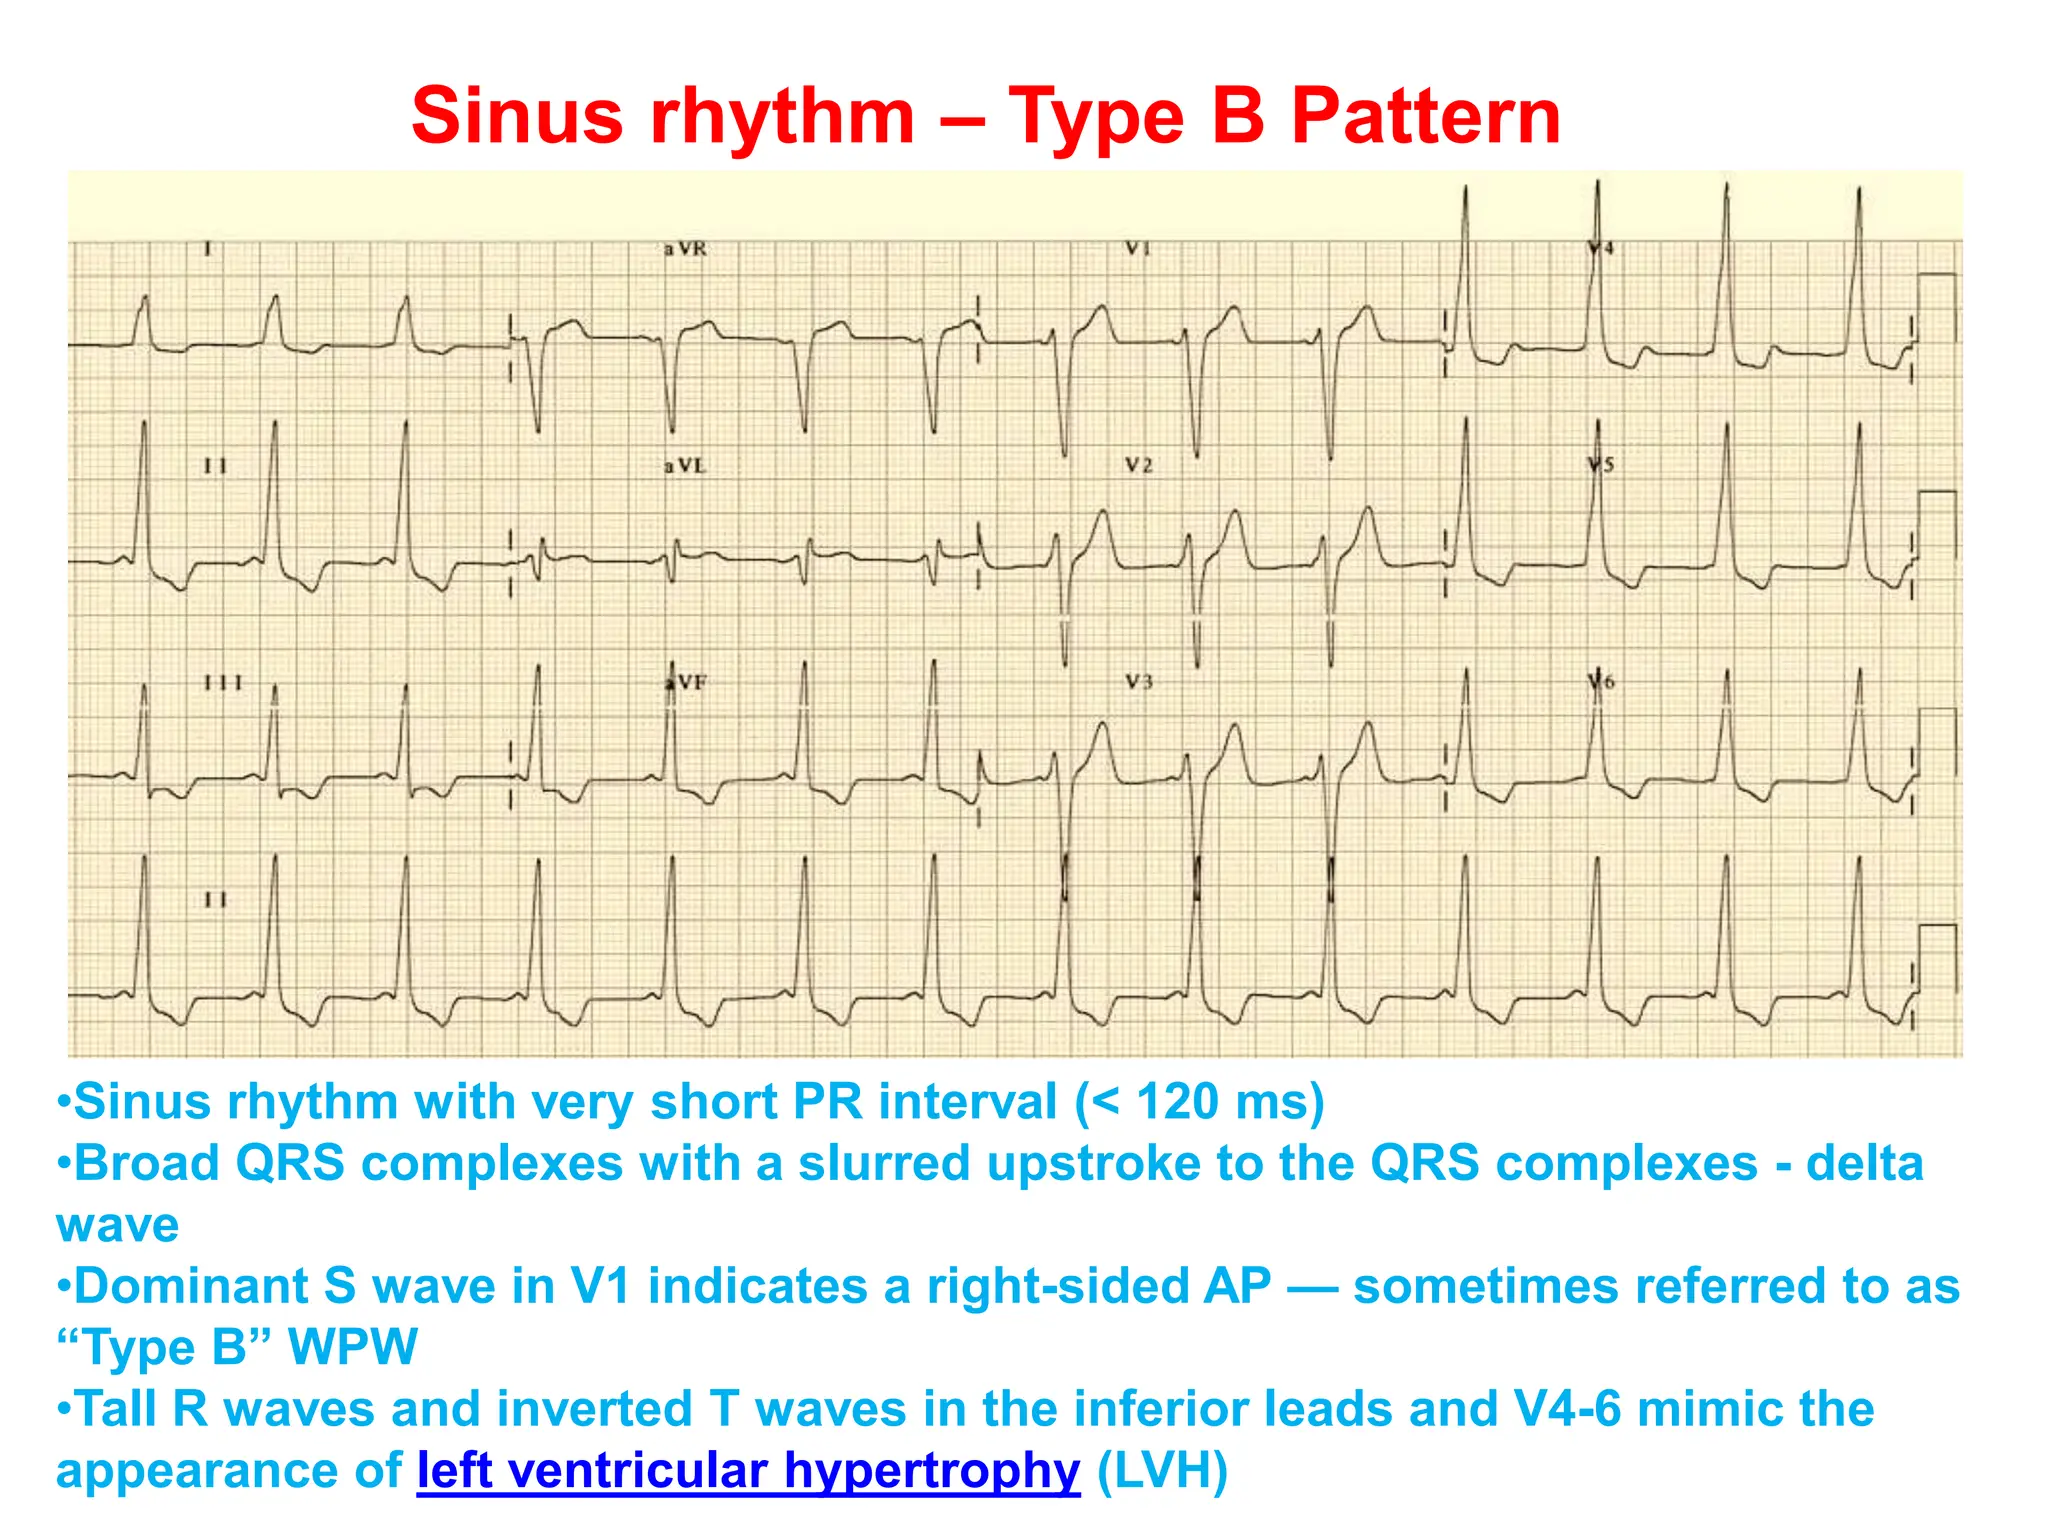
2. Abnormally large R or S waves can indicate conditions like left ventricular hypertrophy, right ventricular hypertrophy, or myocardial infarction.
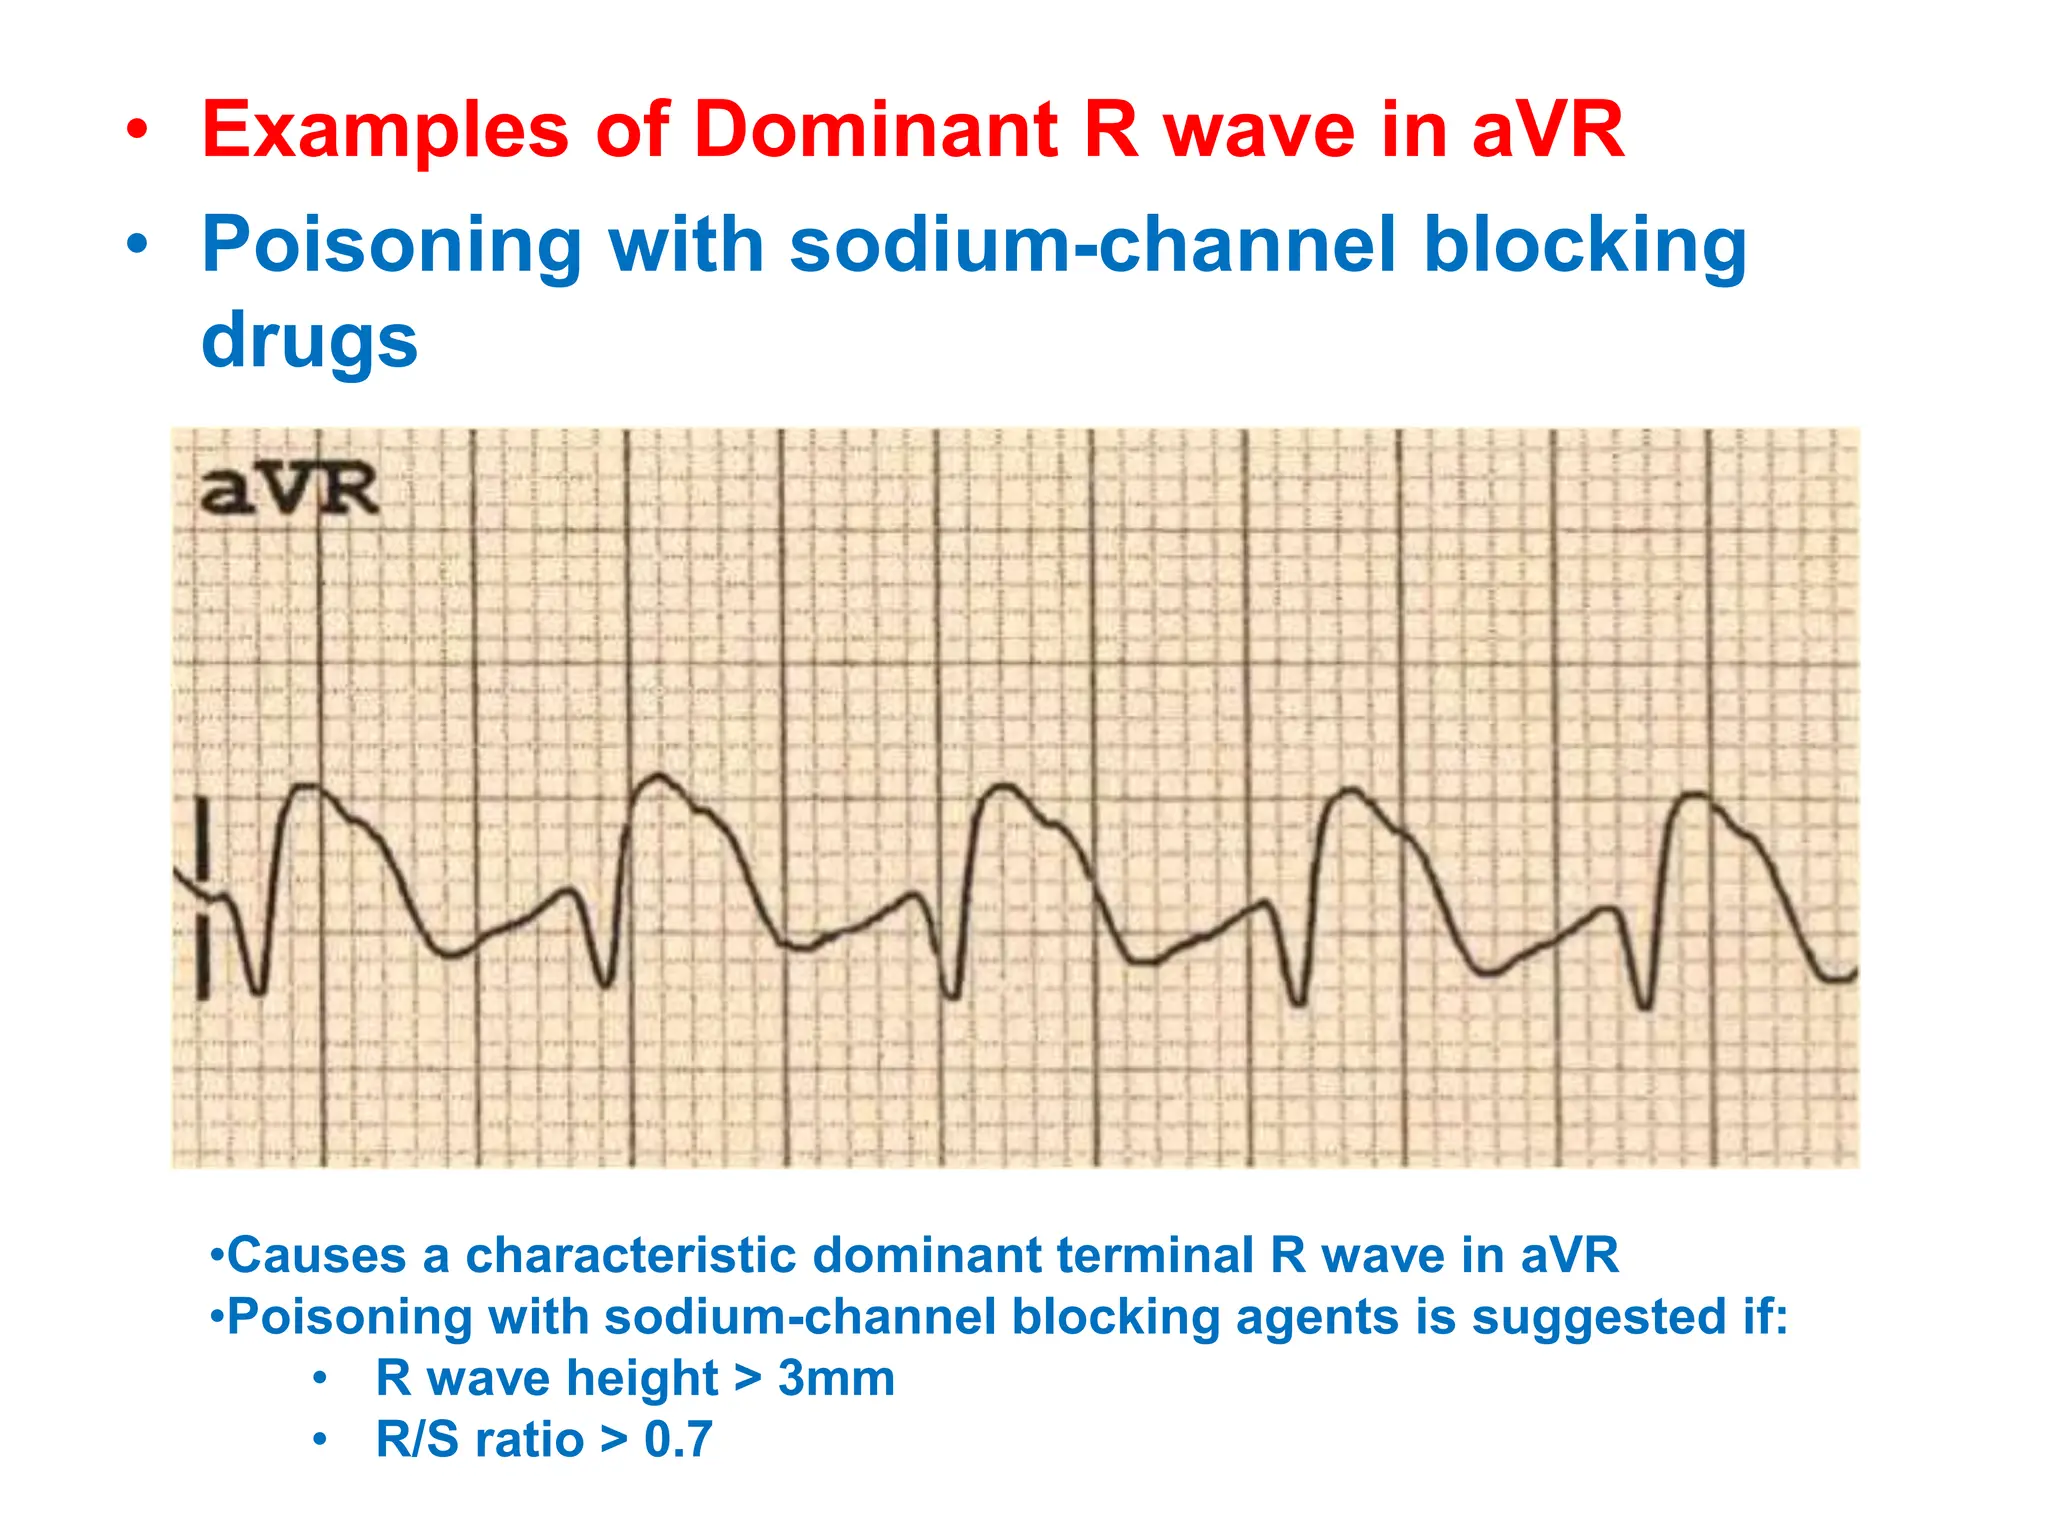
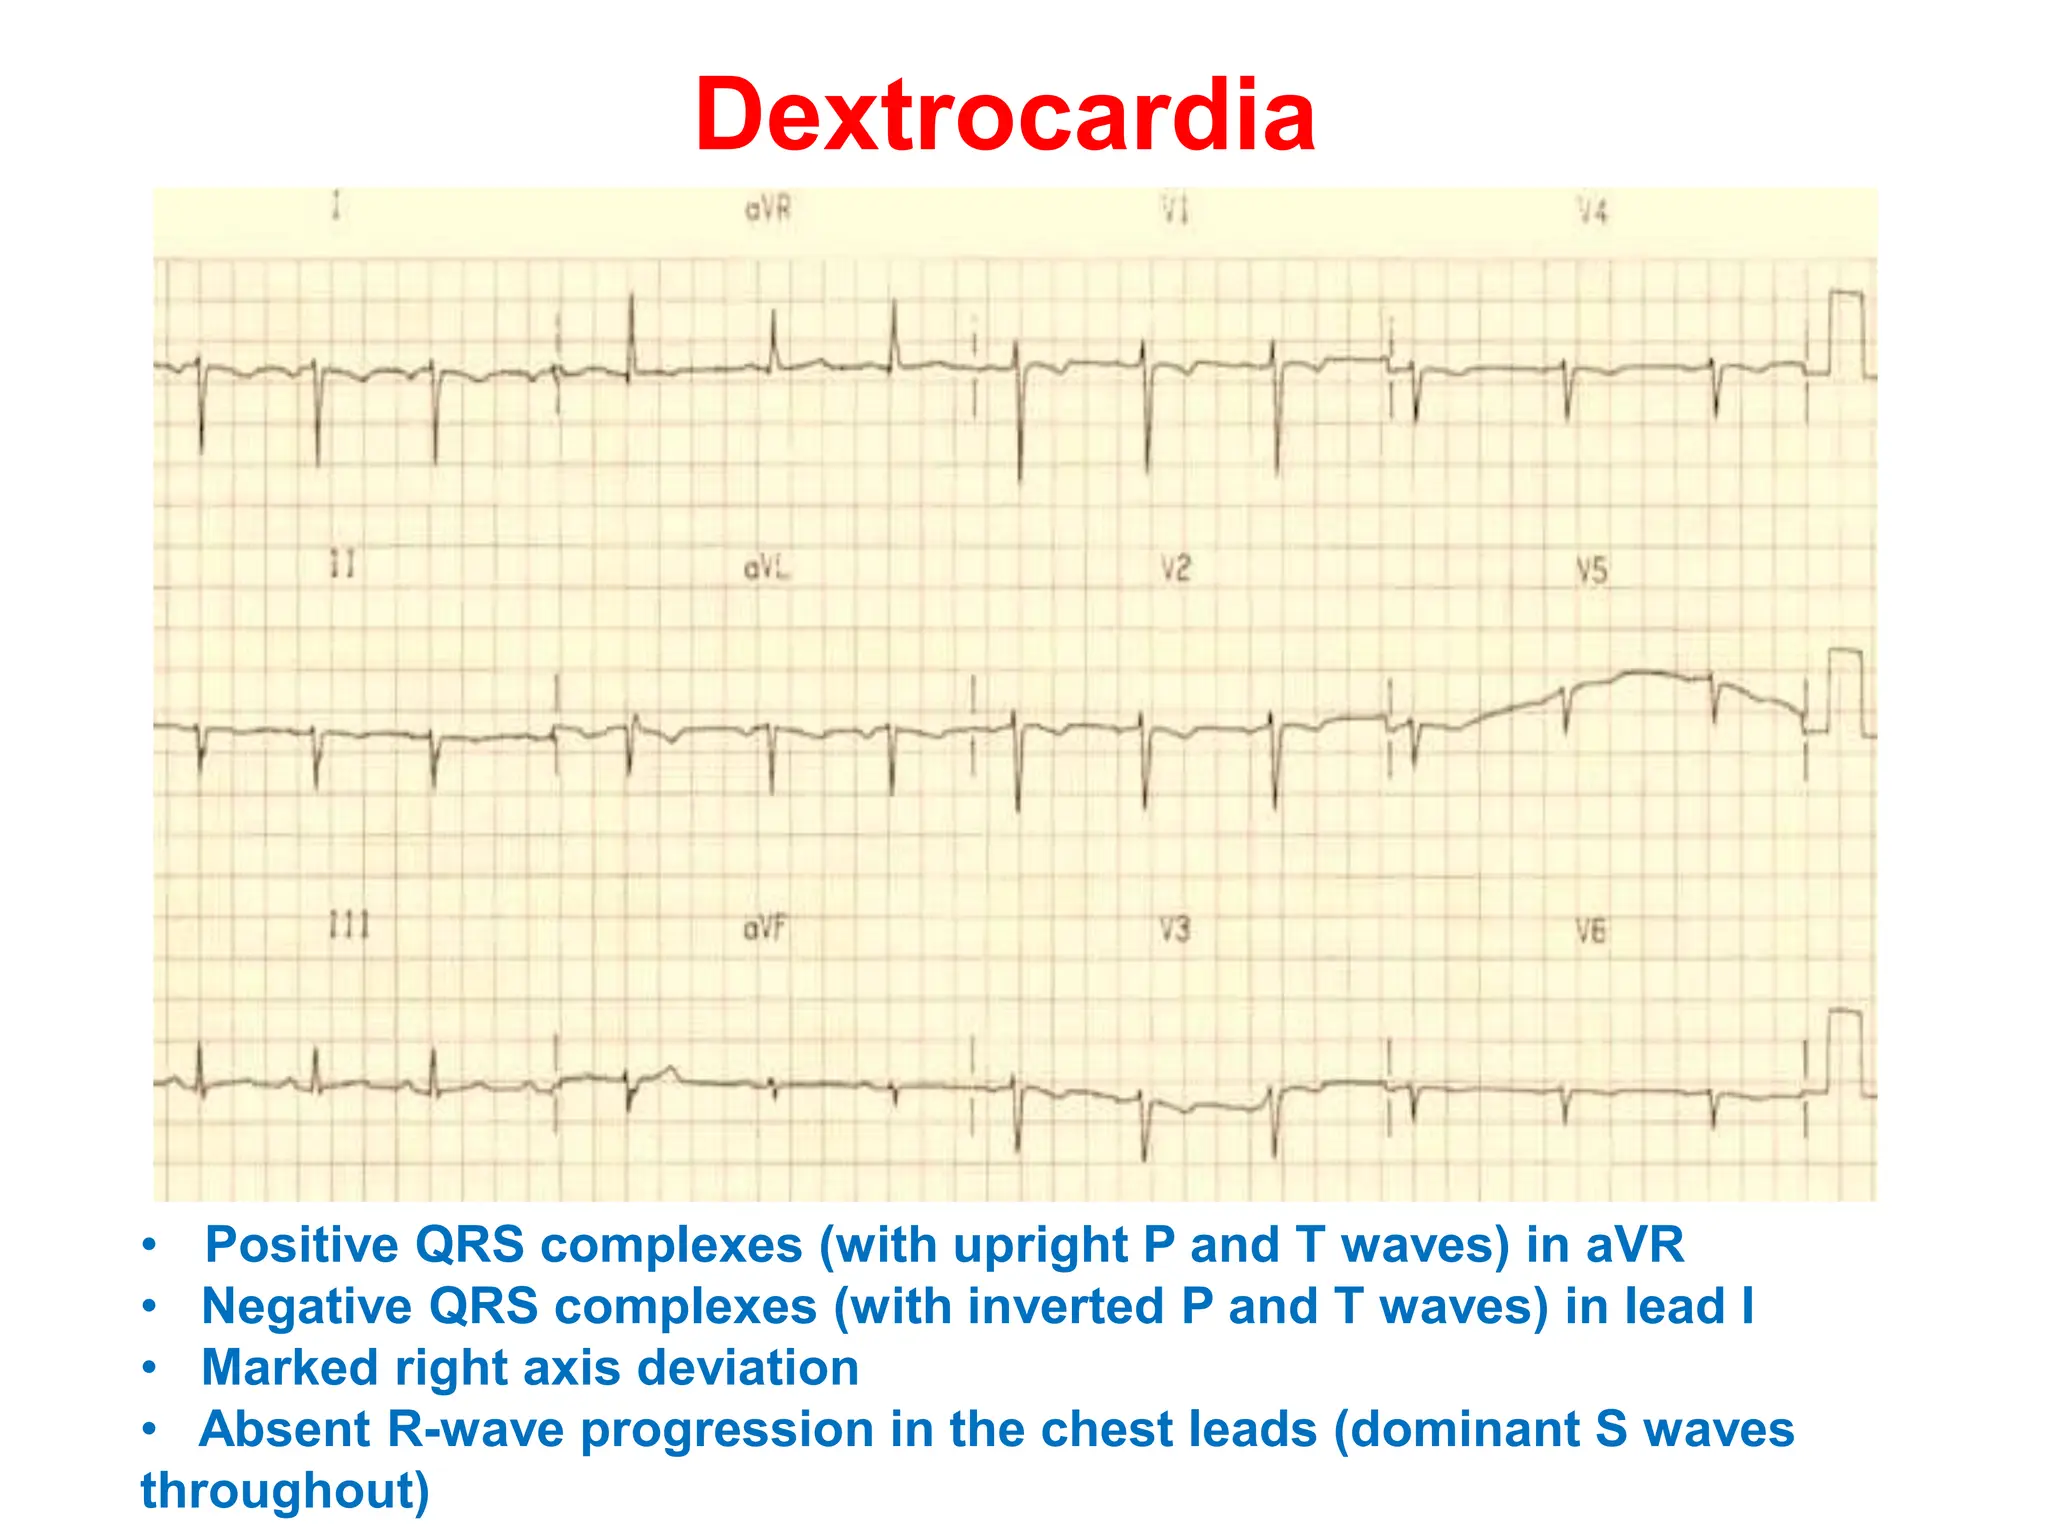
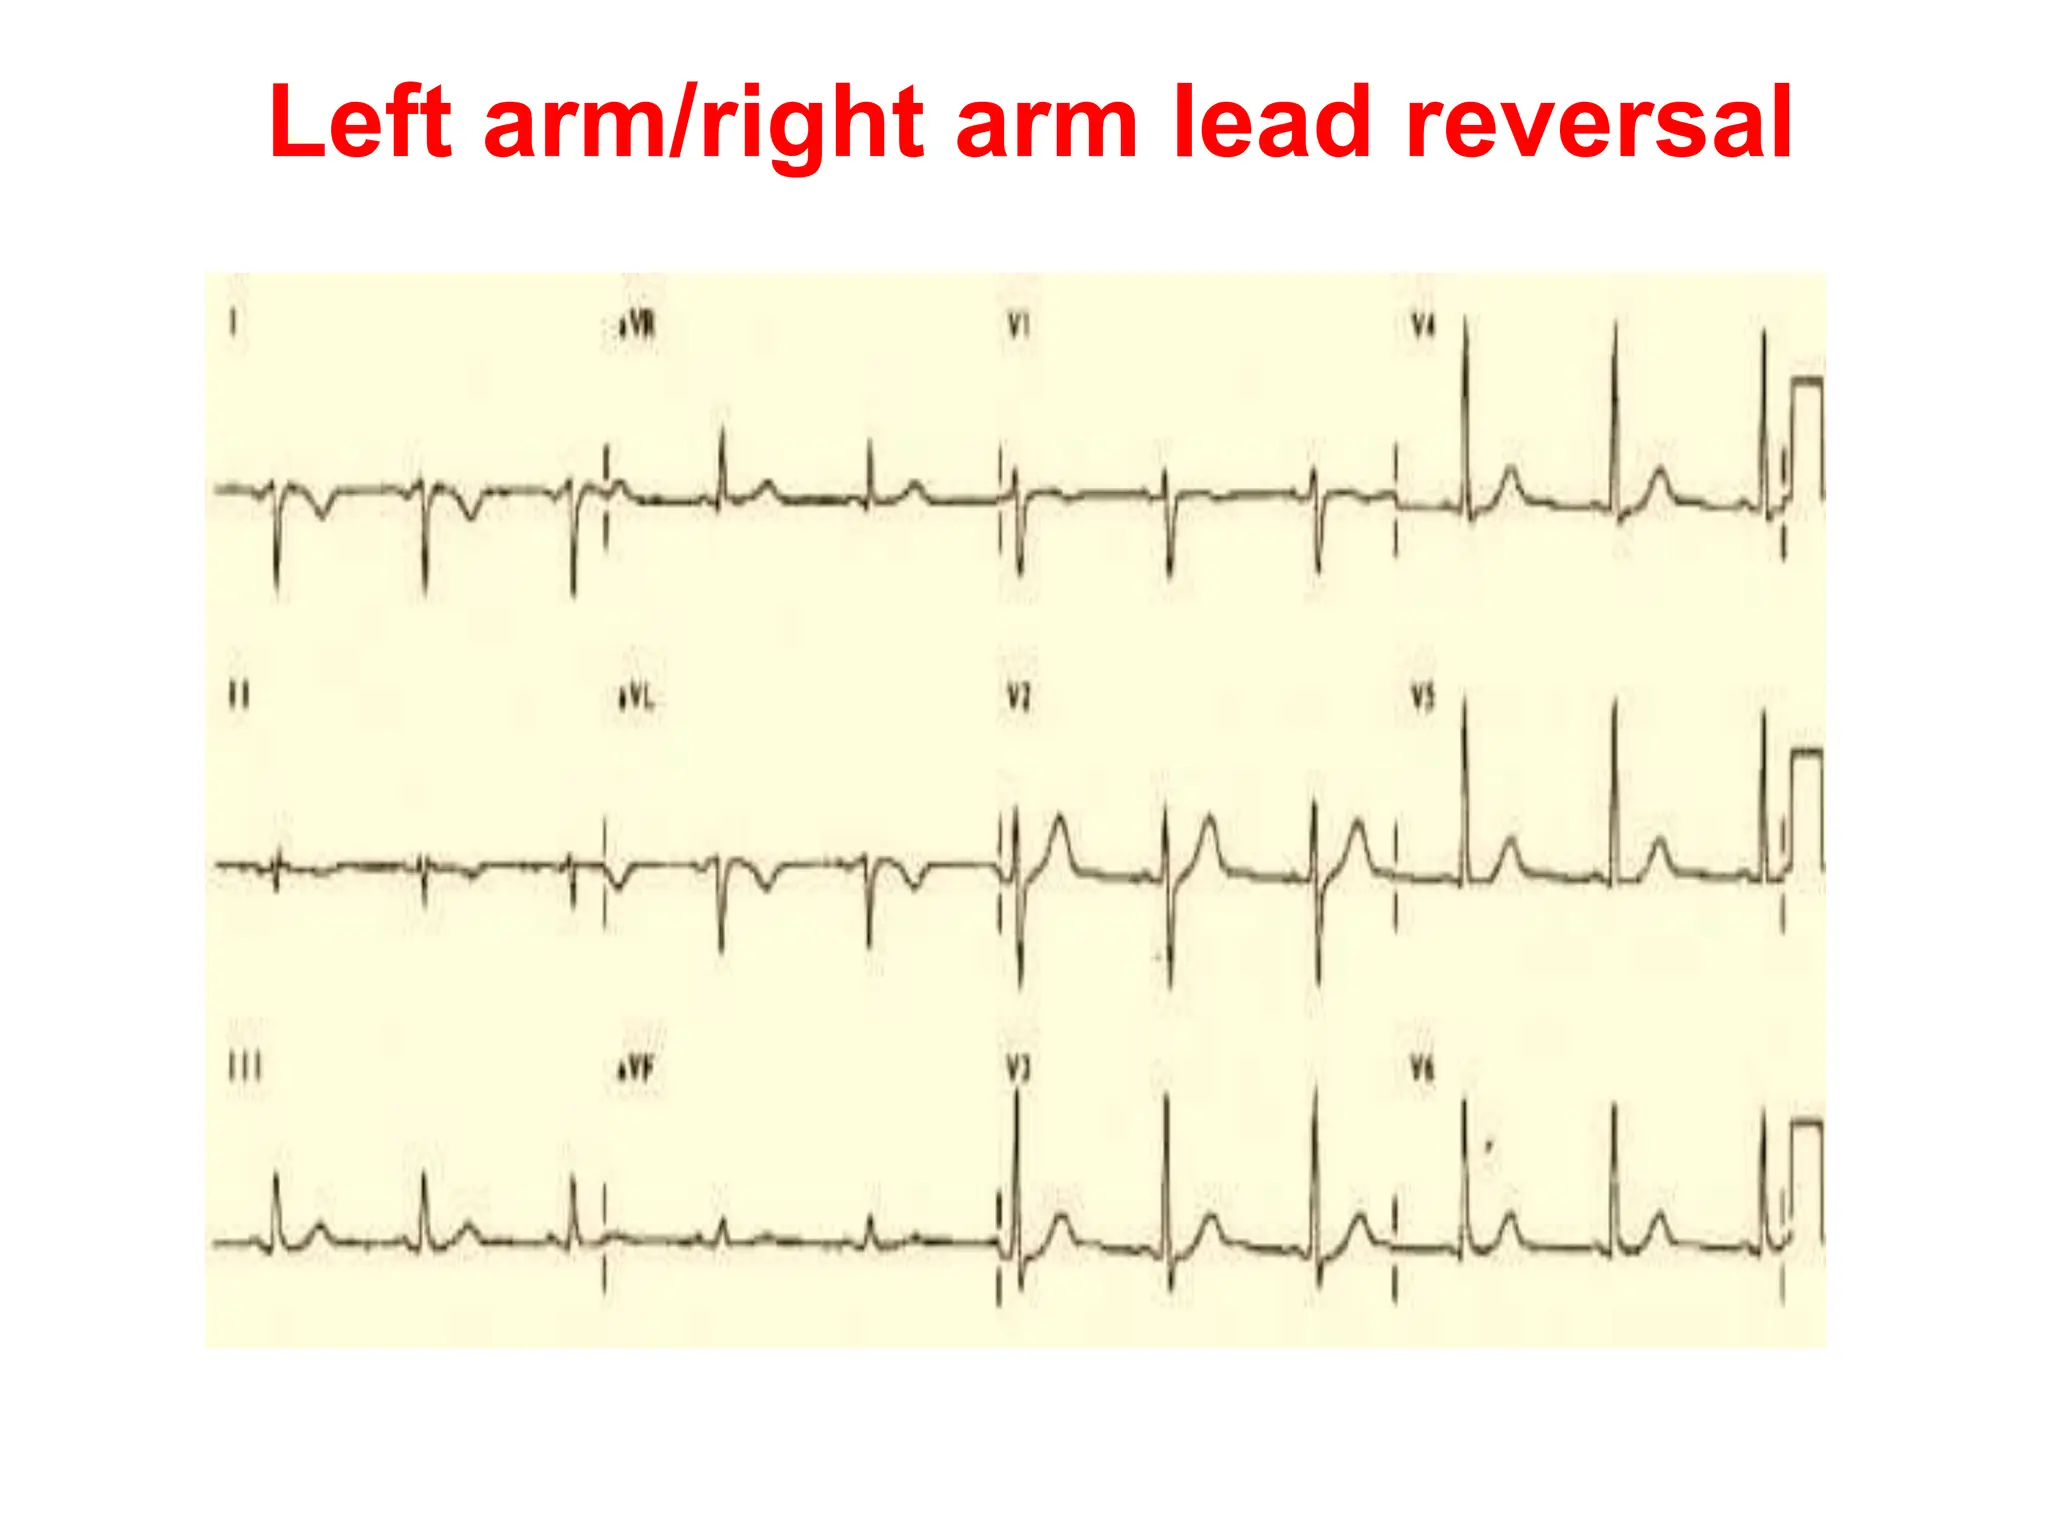
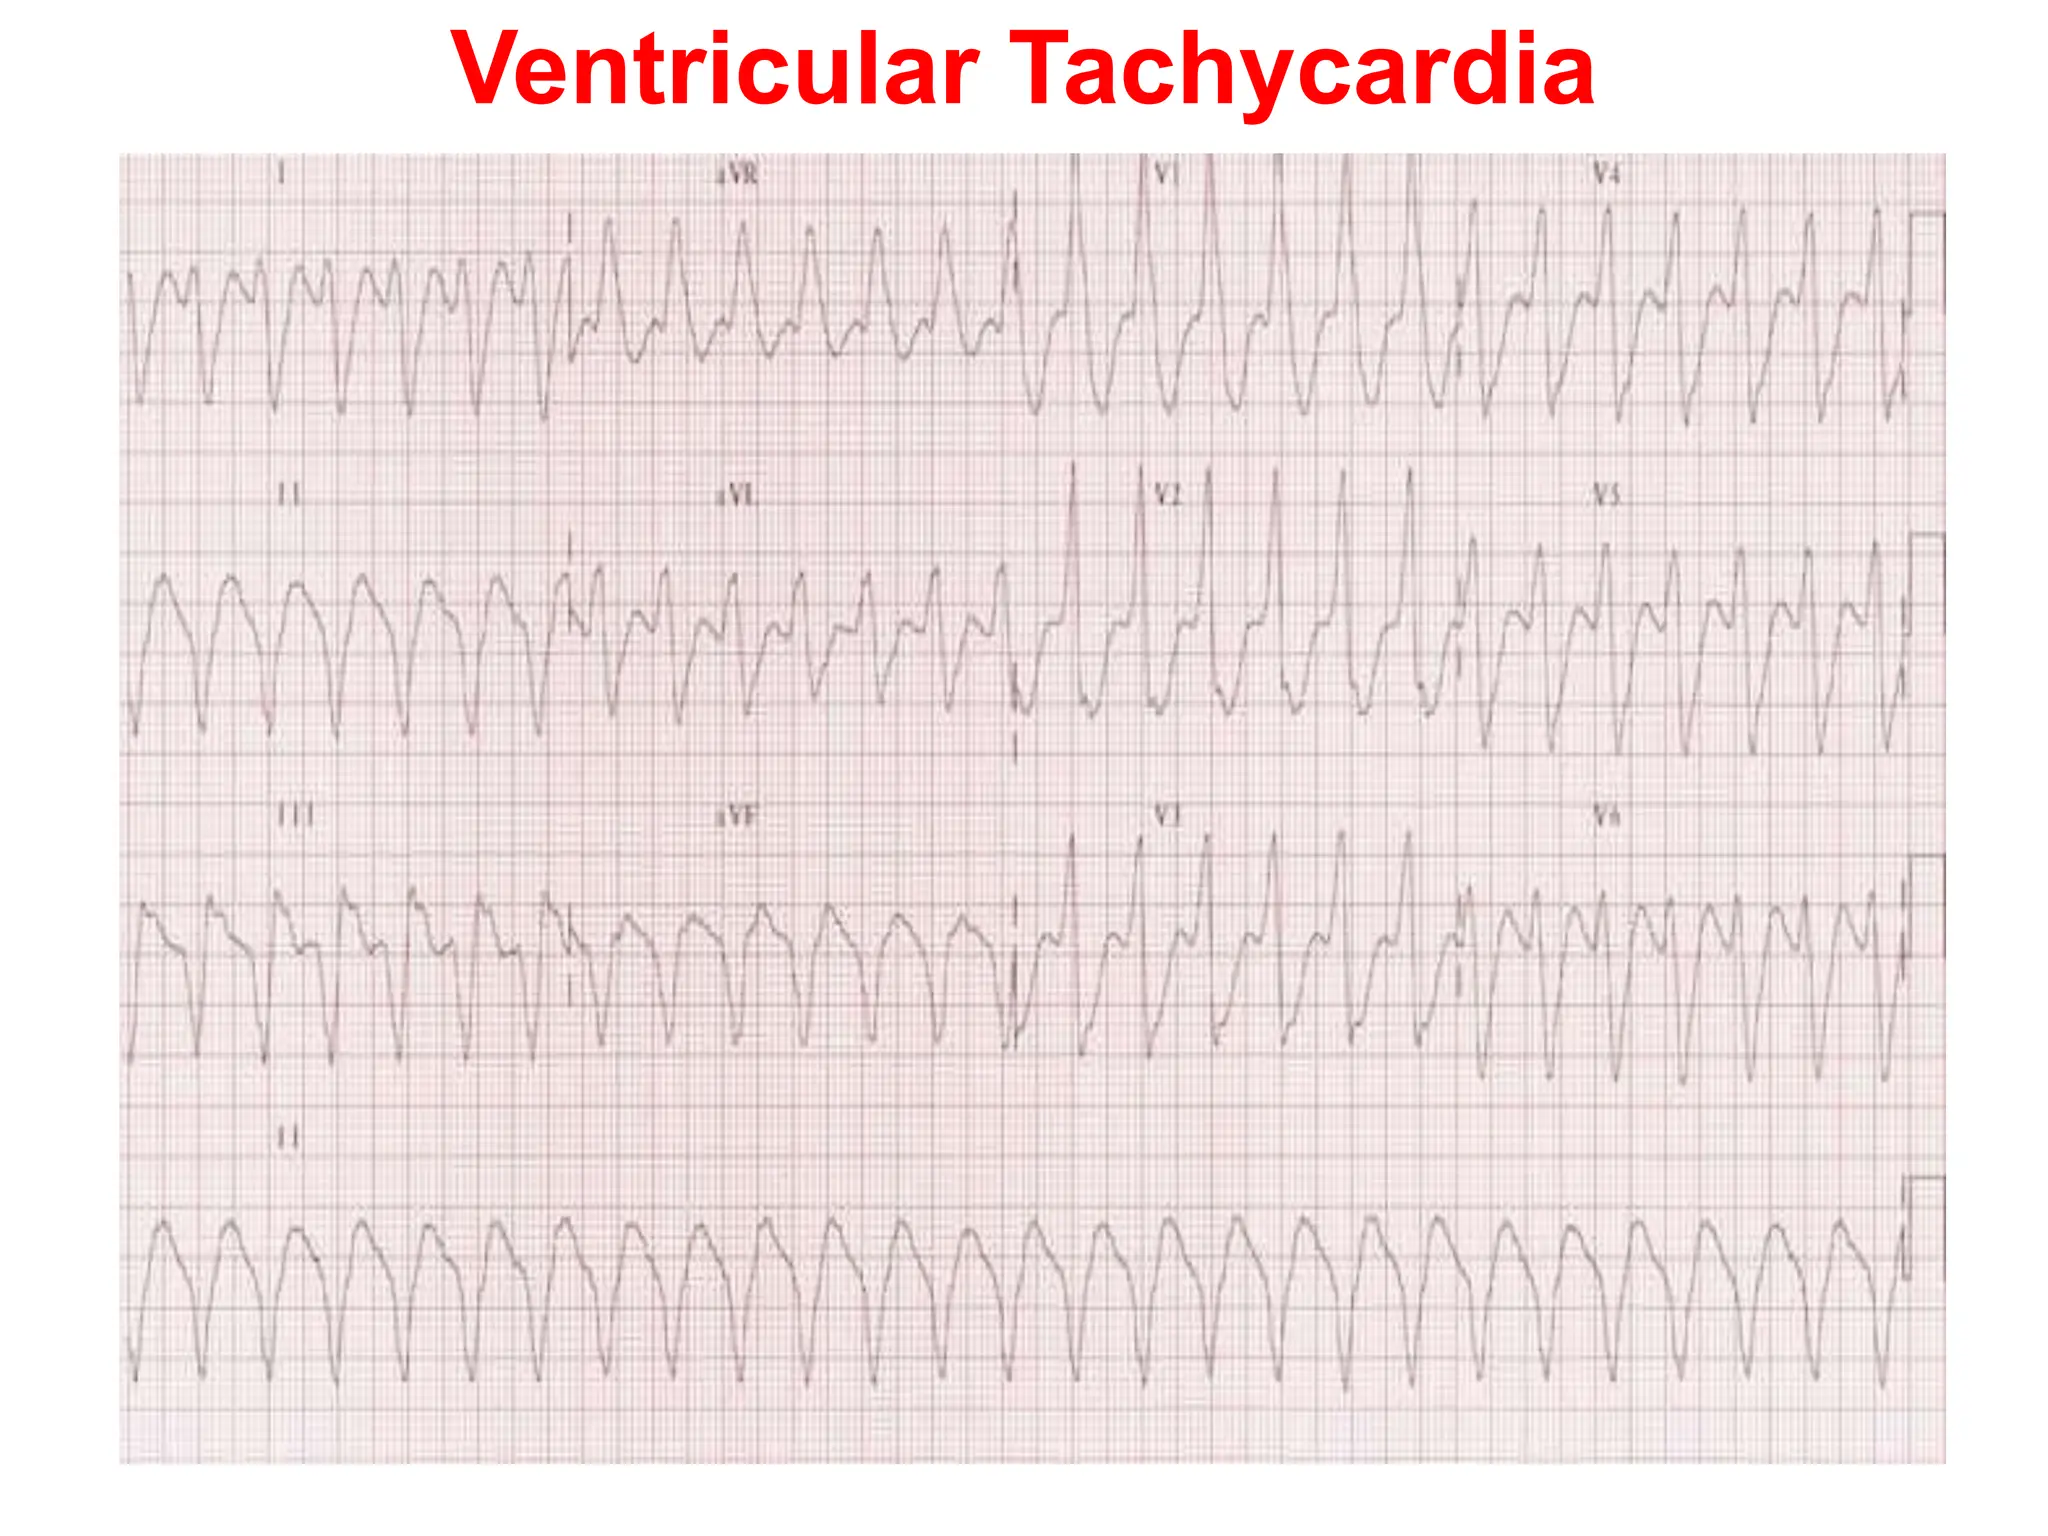
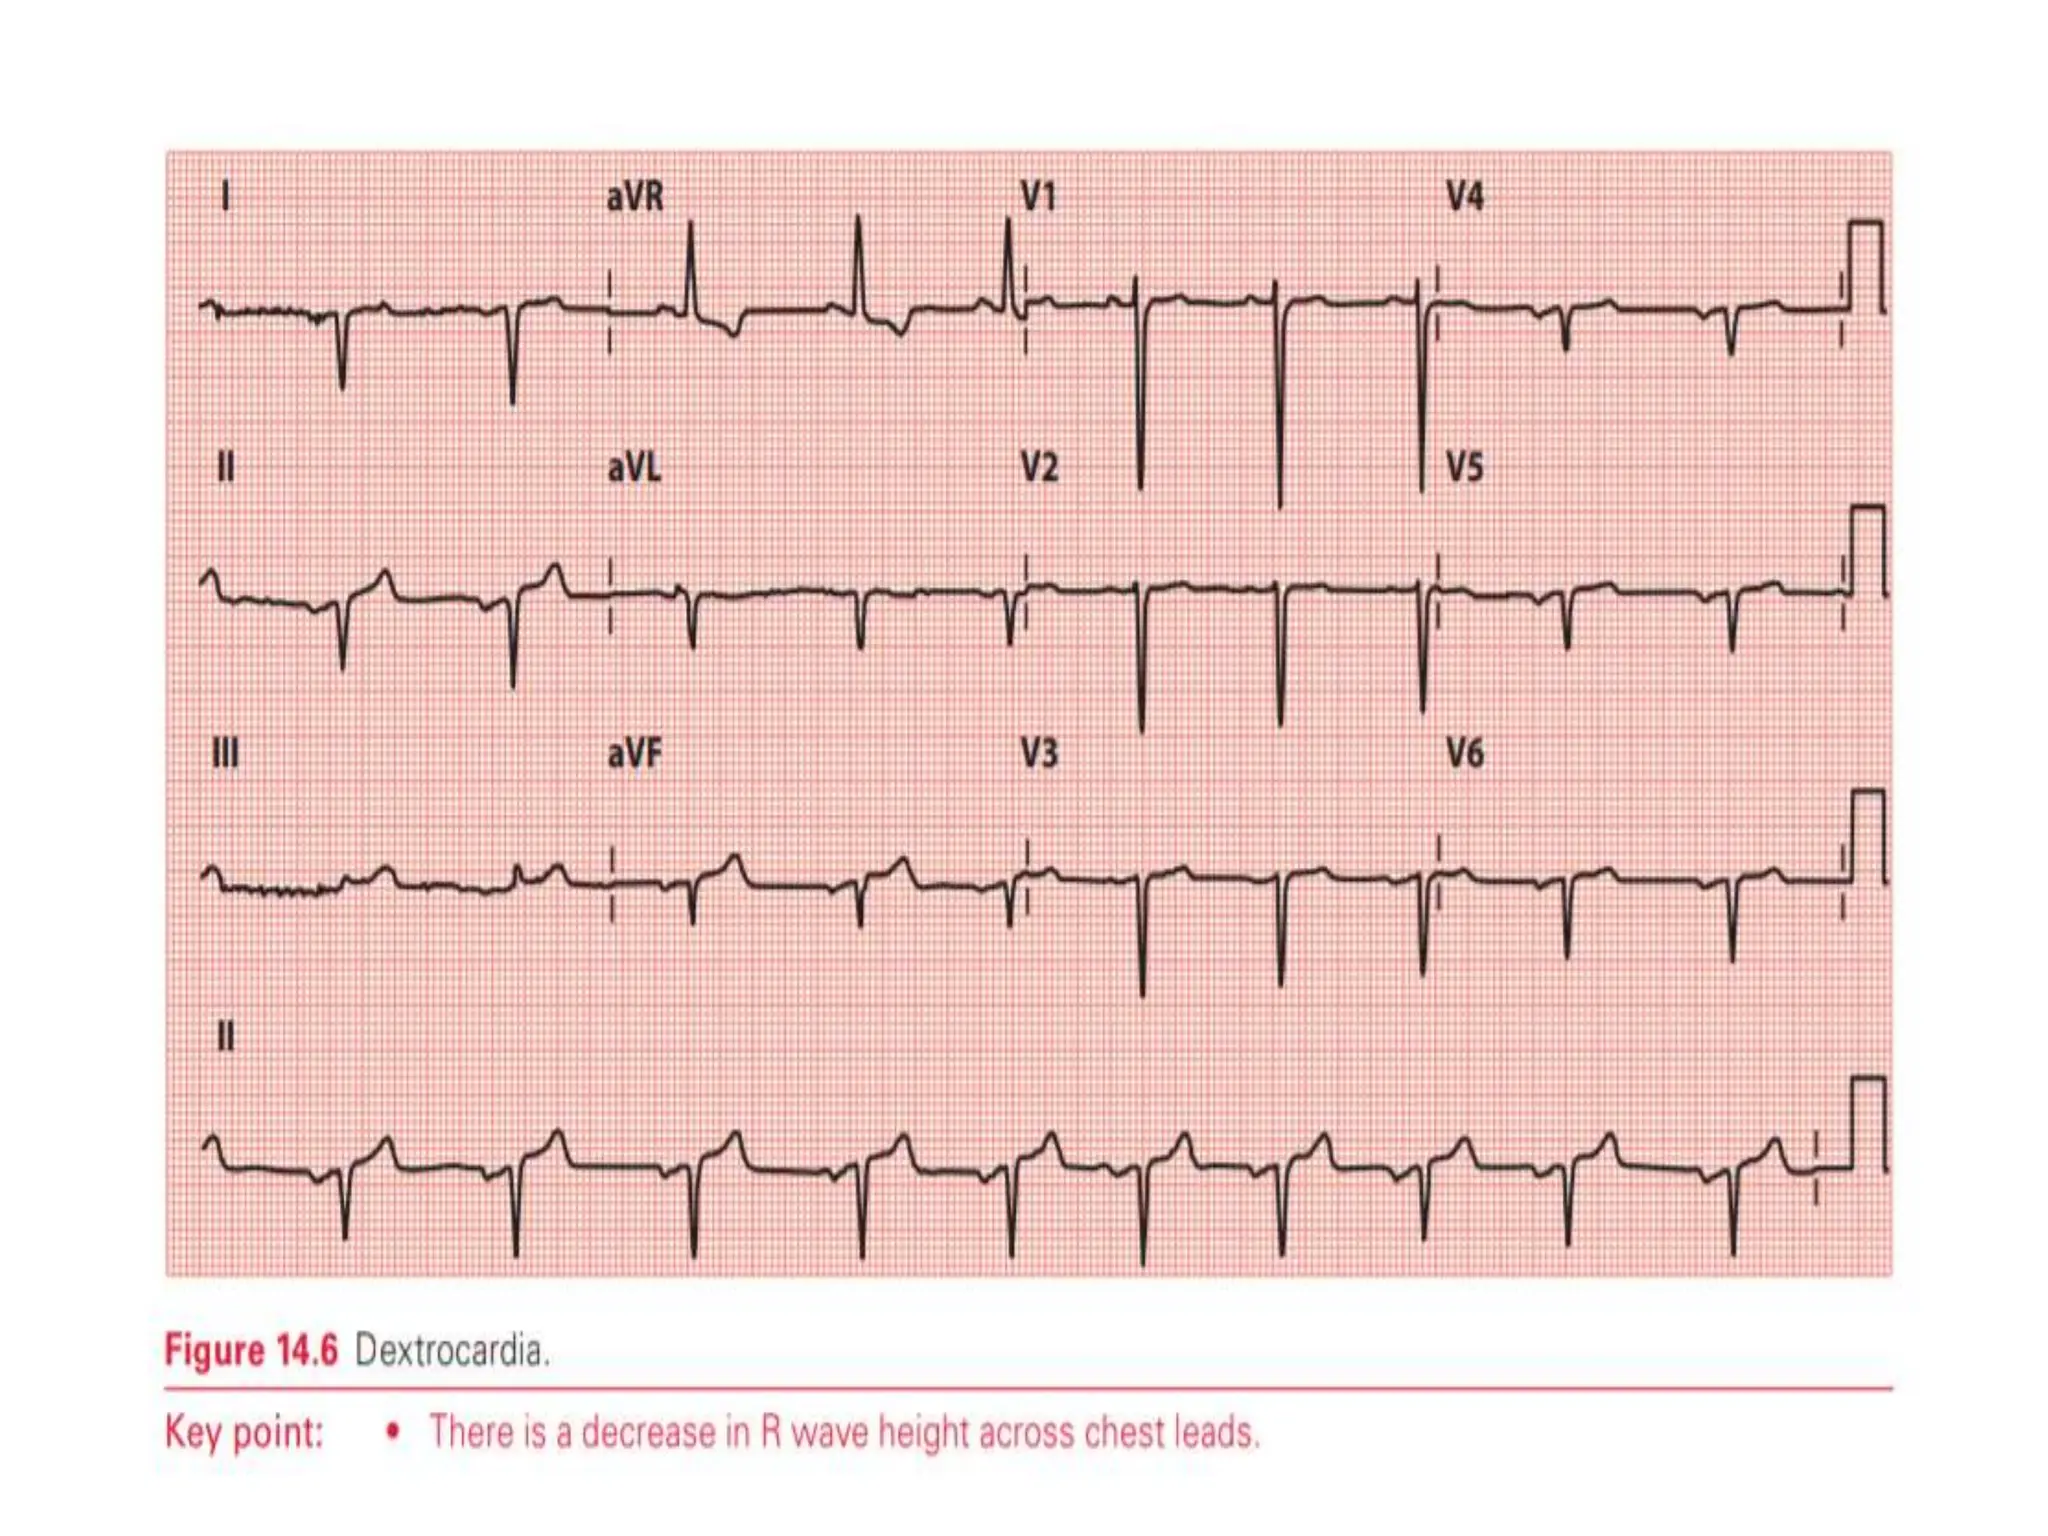
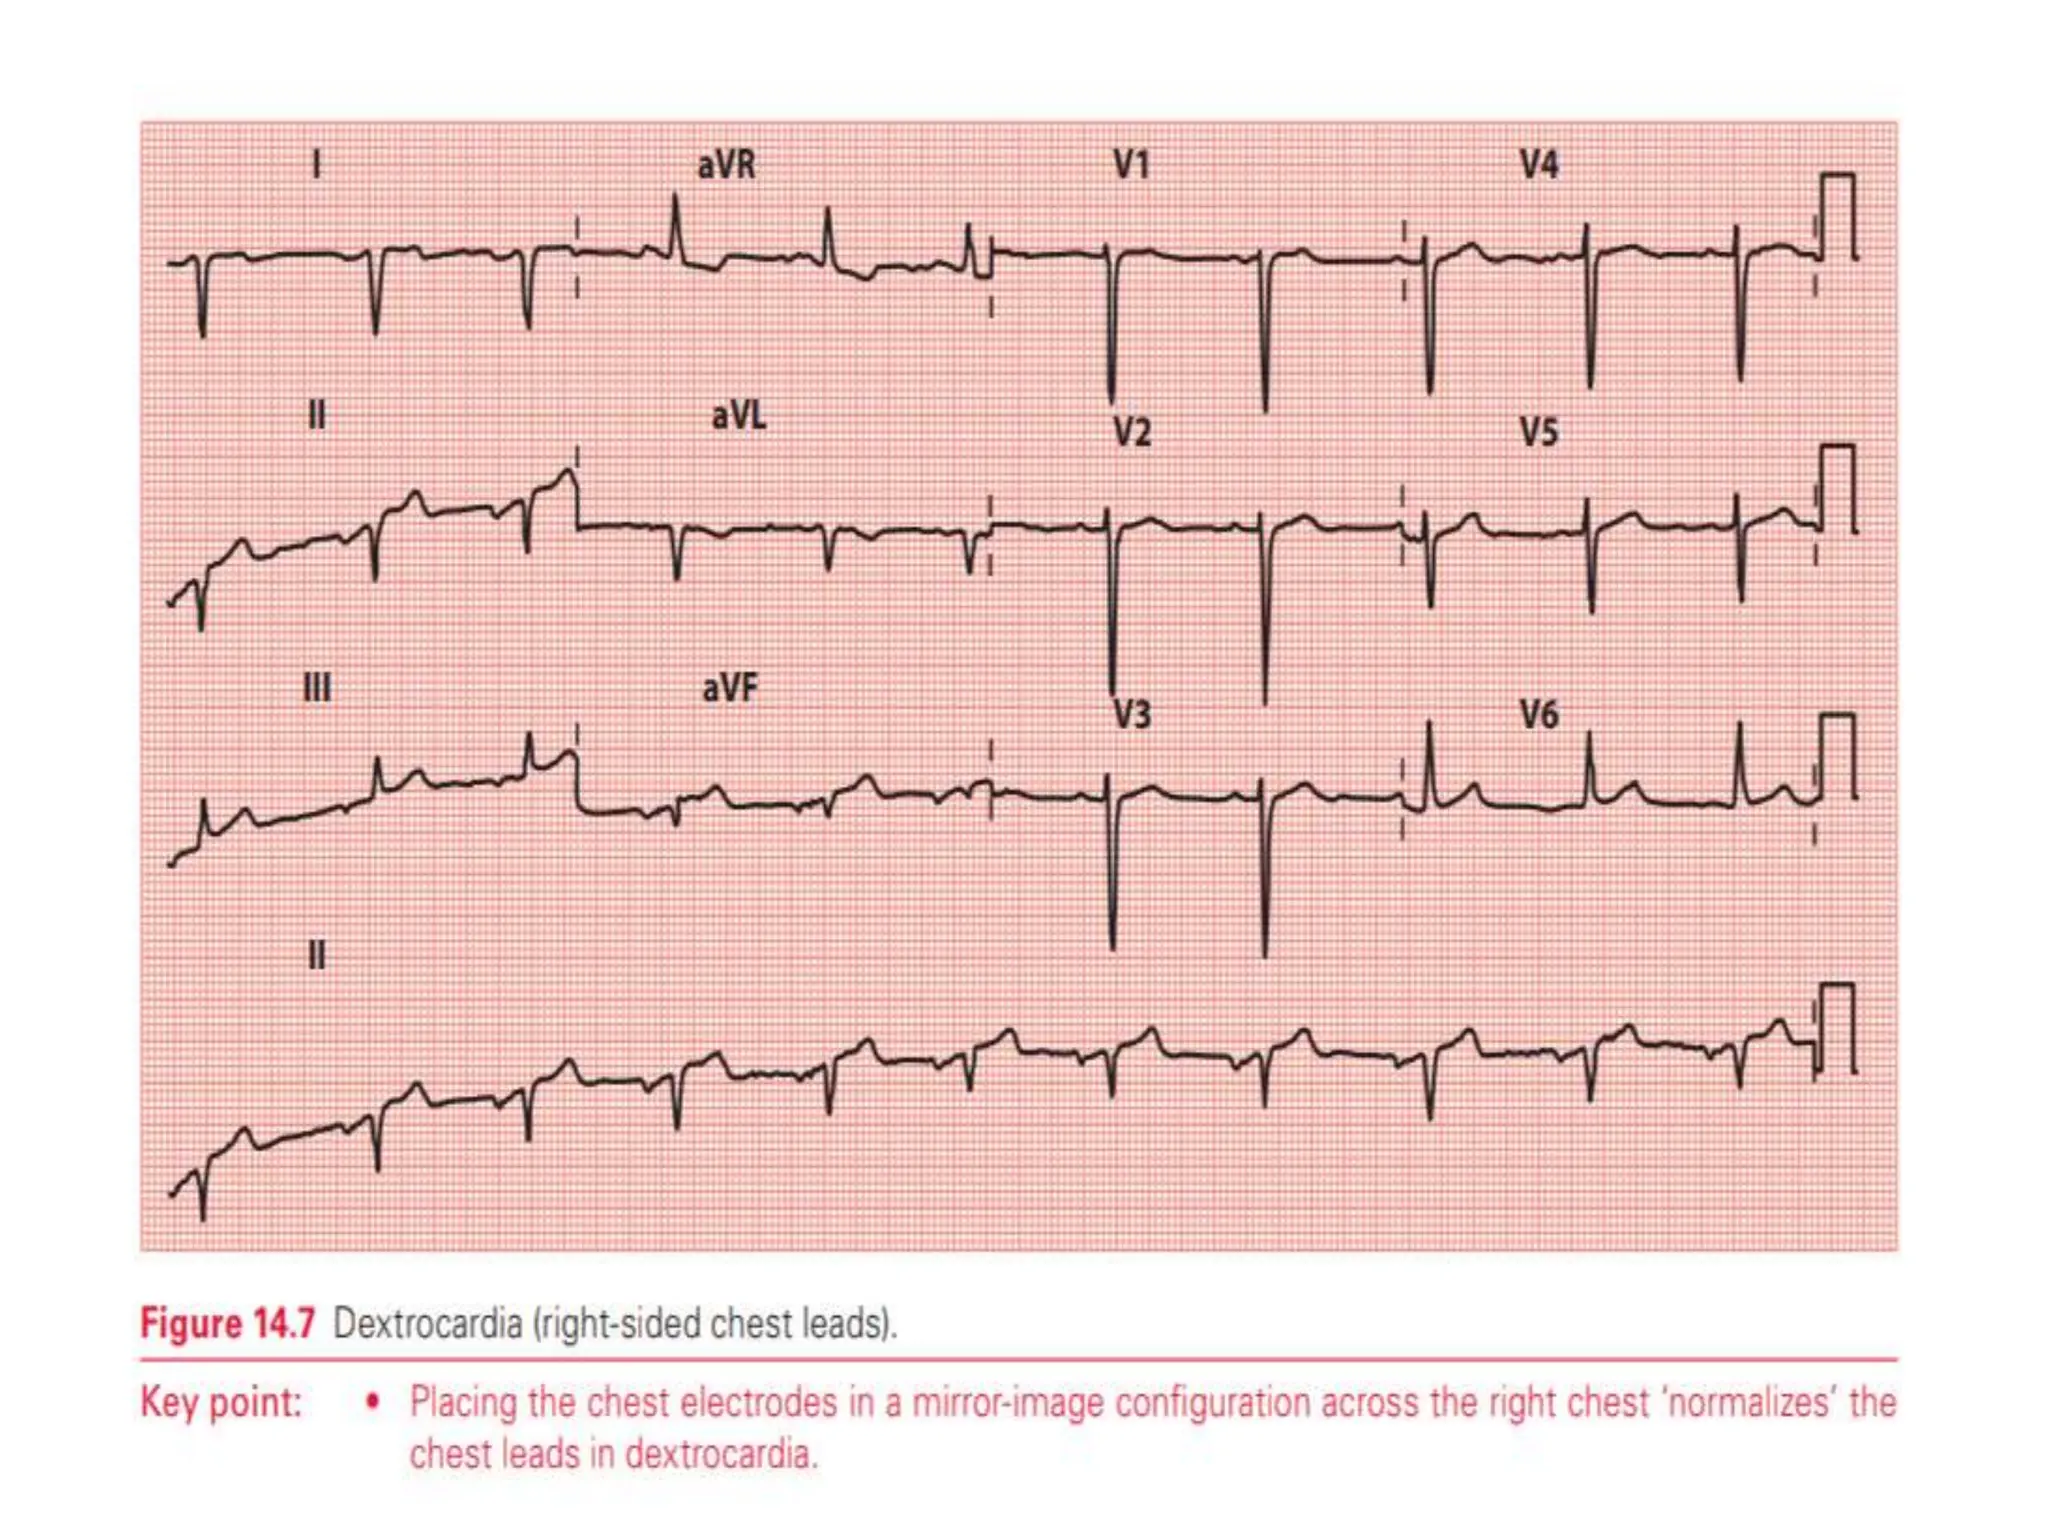
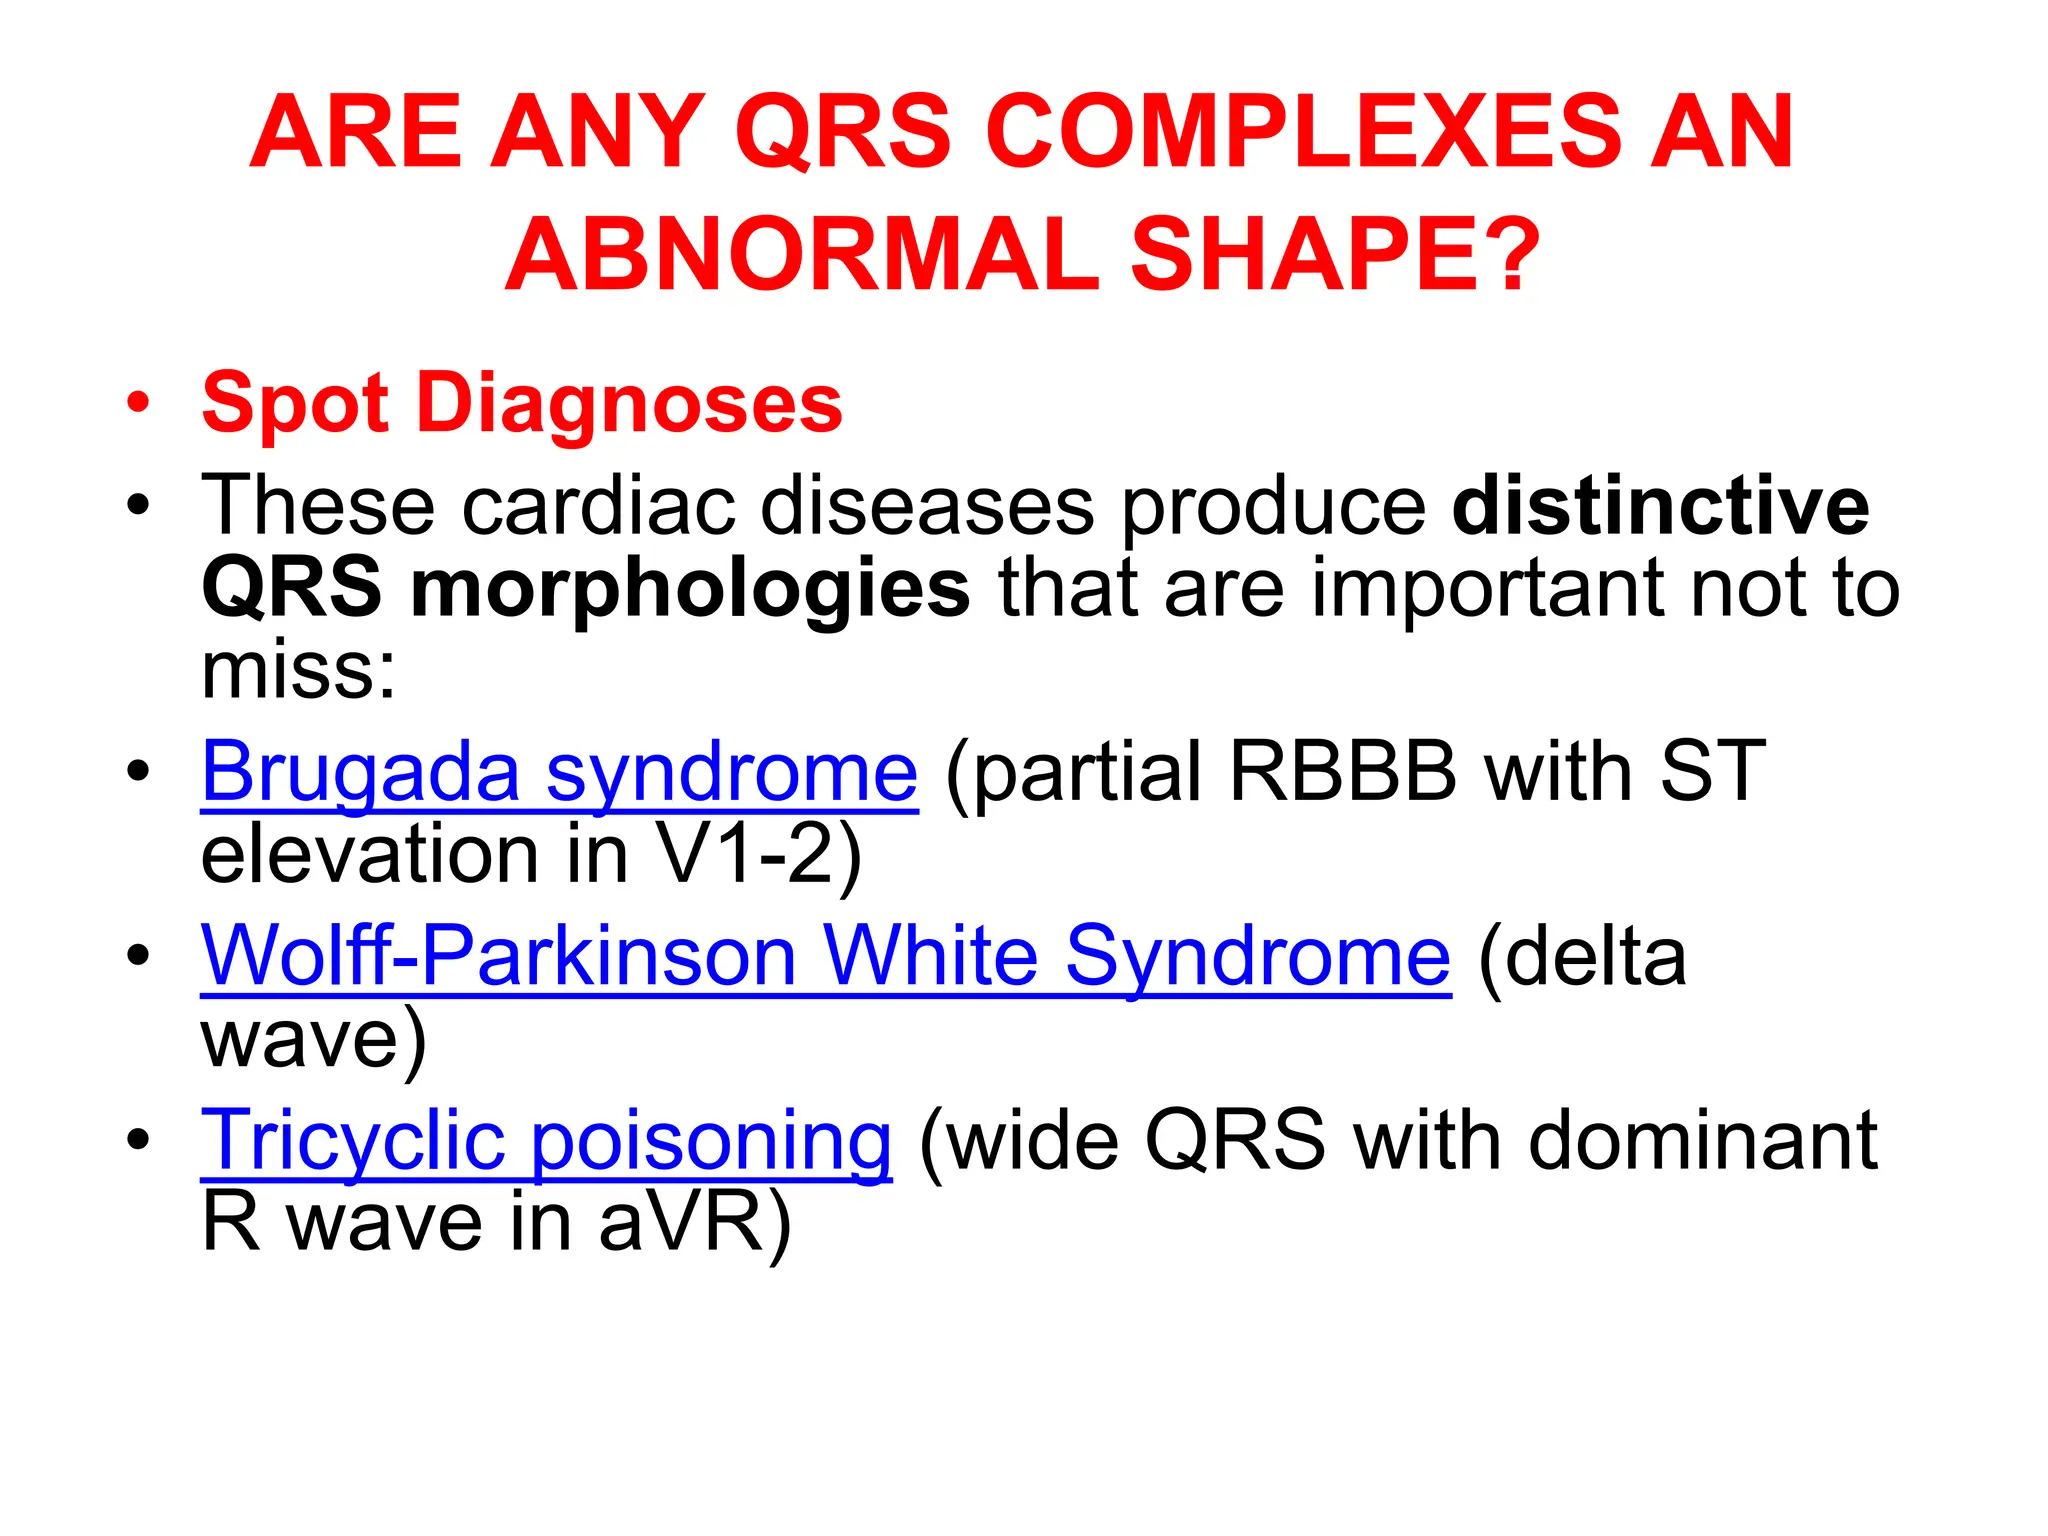
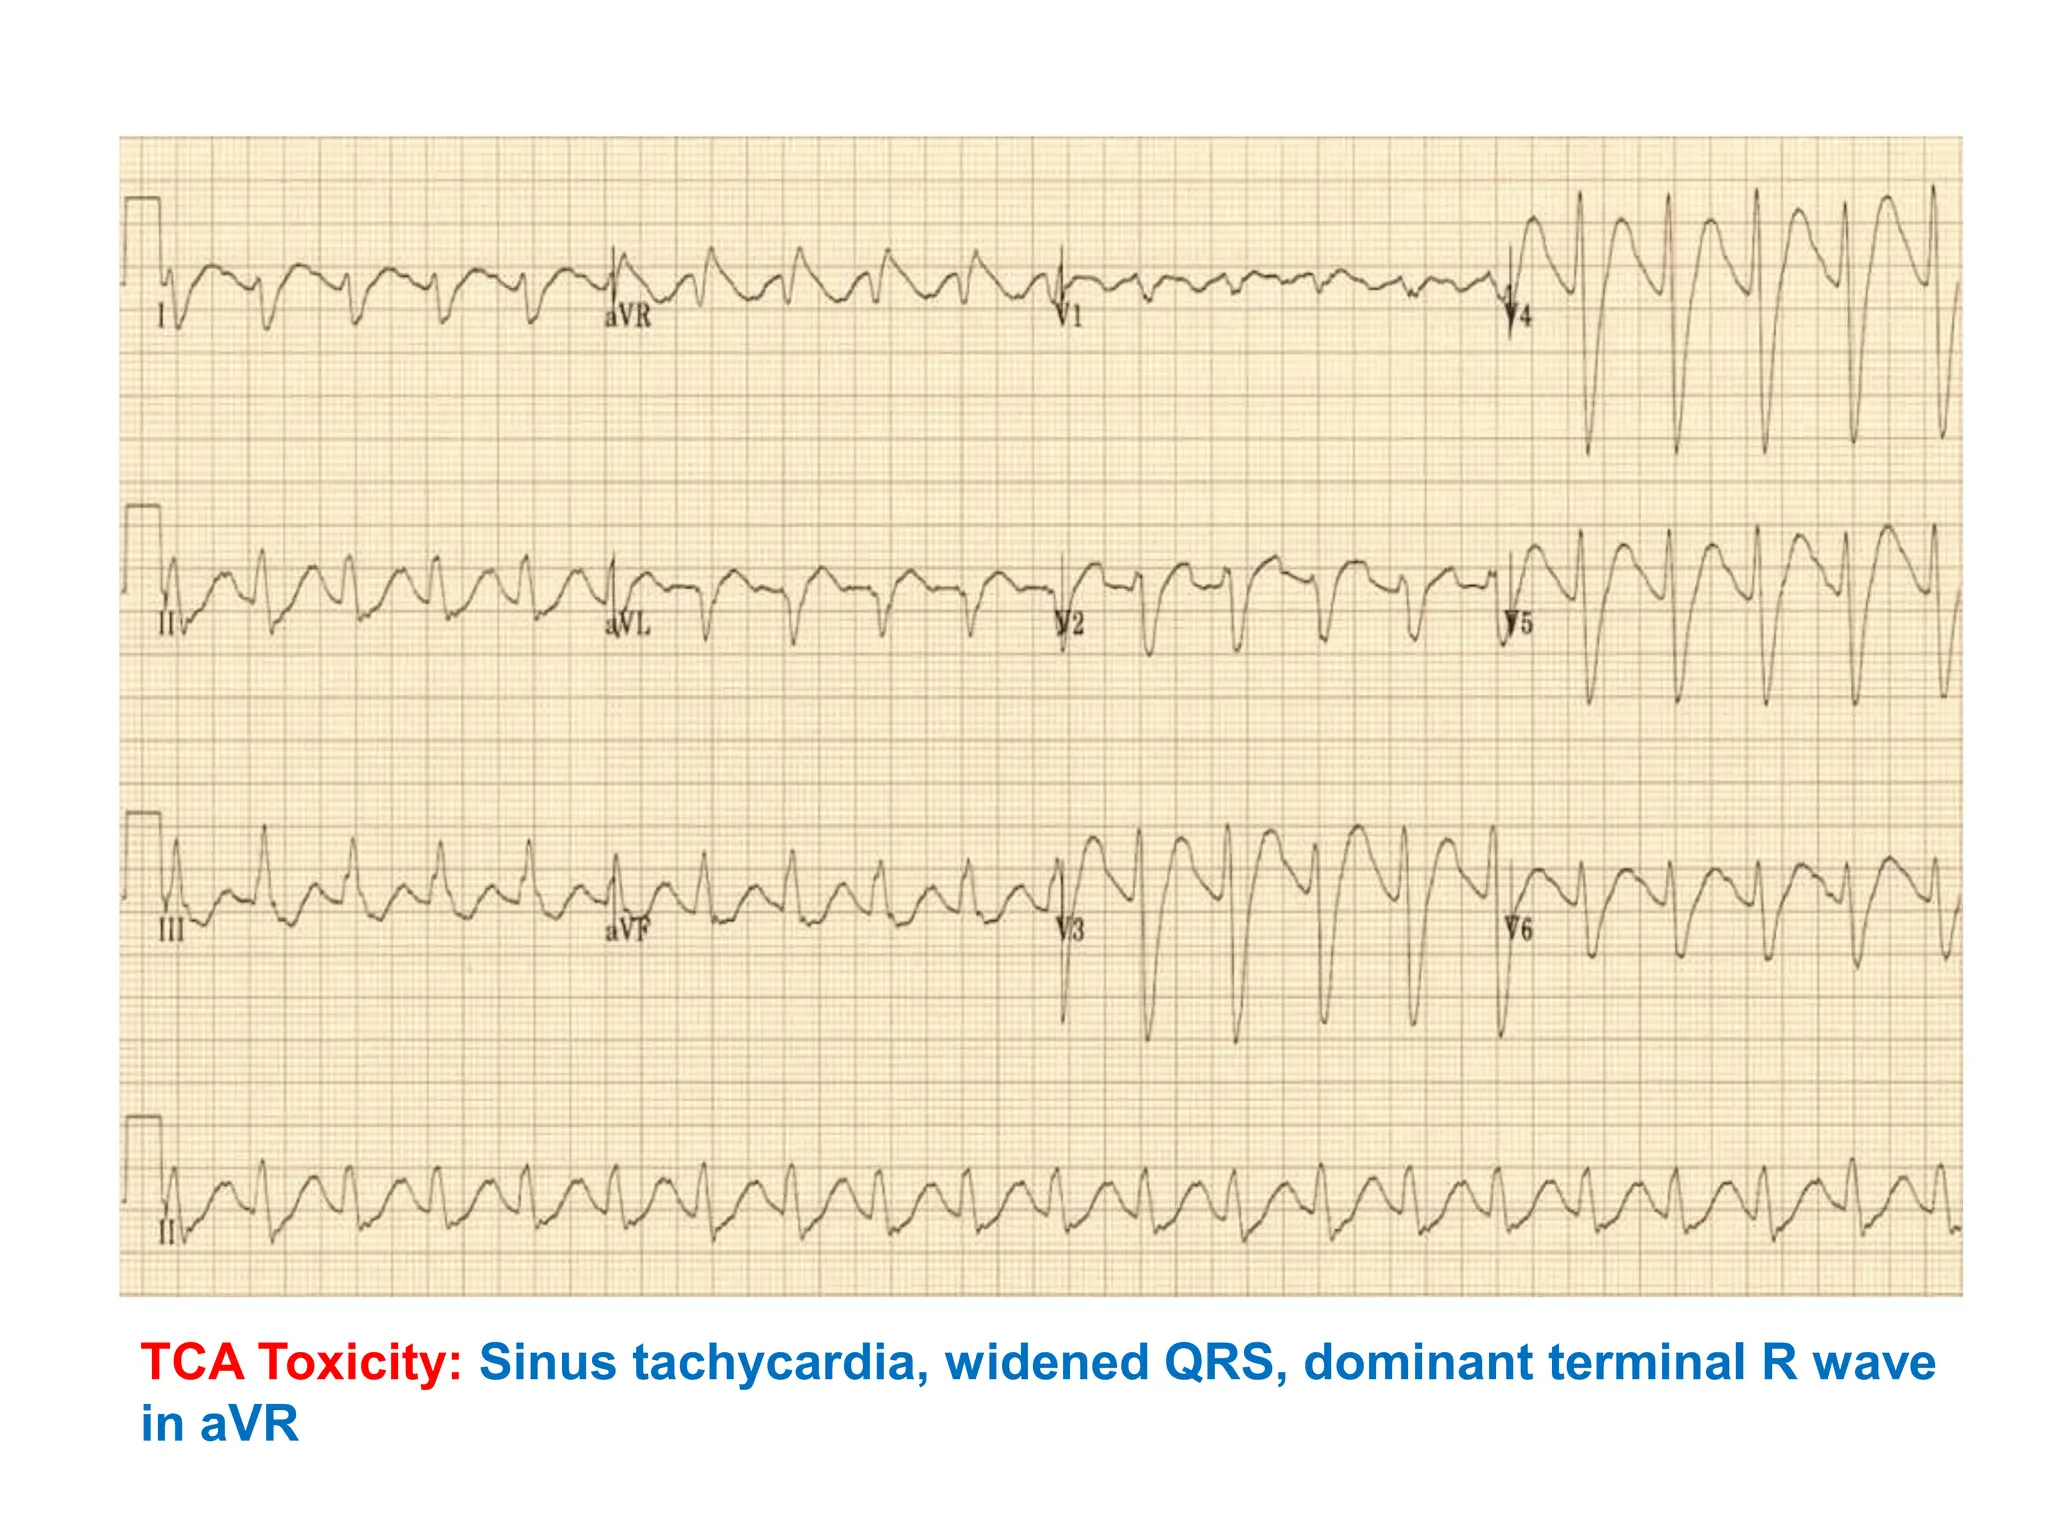
3. A dominant R wave in lead aVR can suggest conditions like sodium channel blocker poisoning, dextrocardia, or ventricular tachycardia.
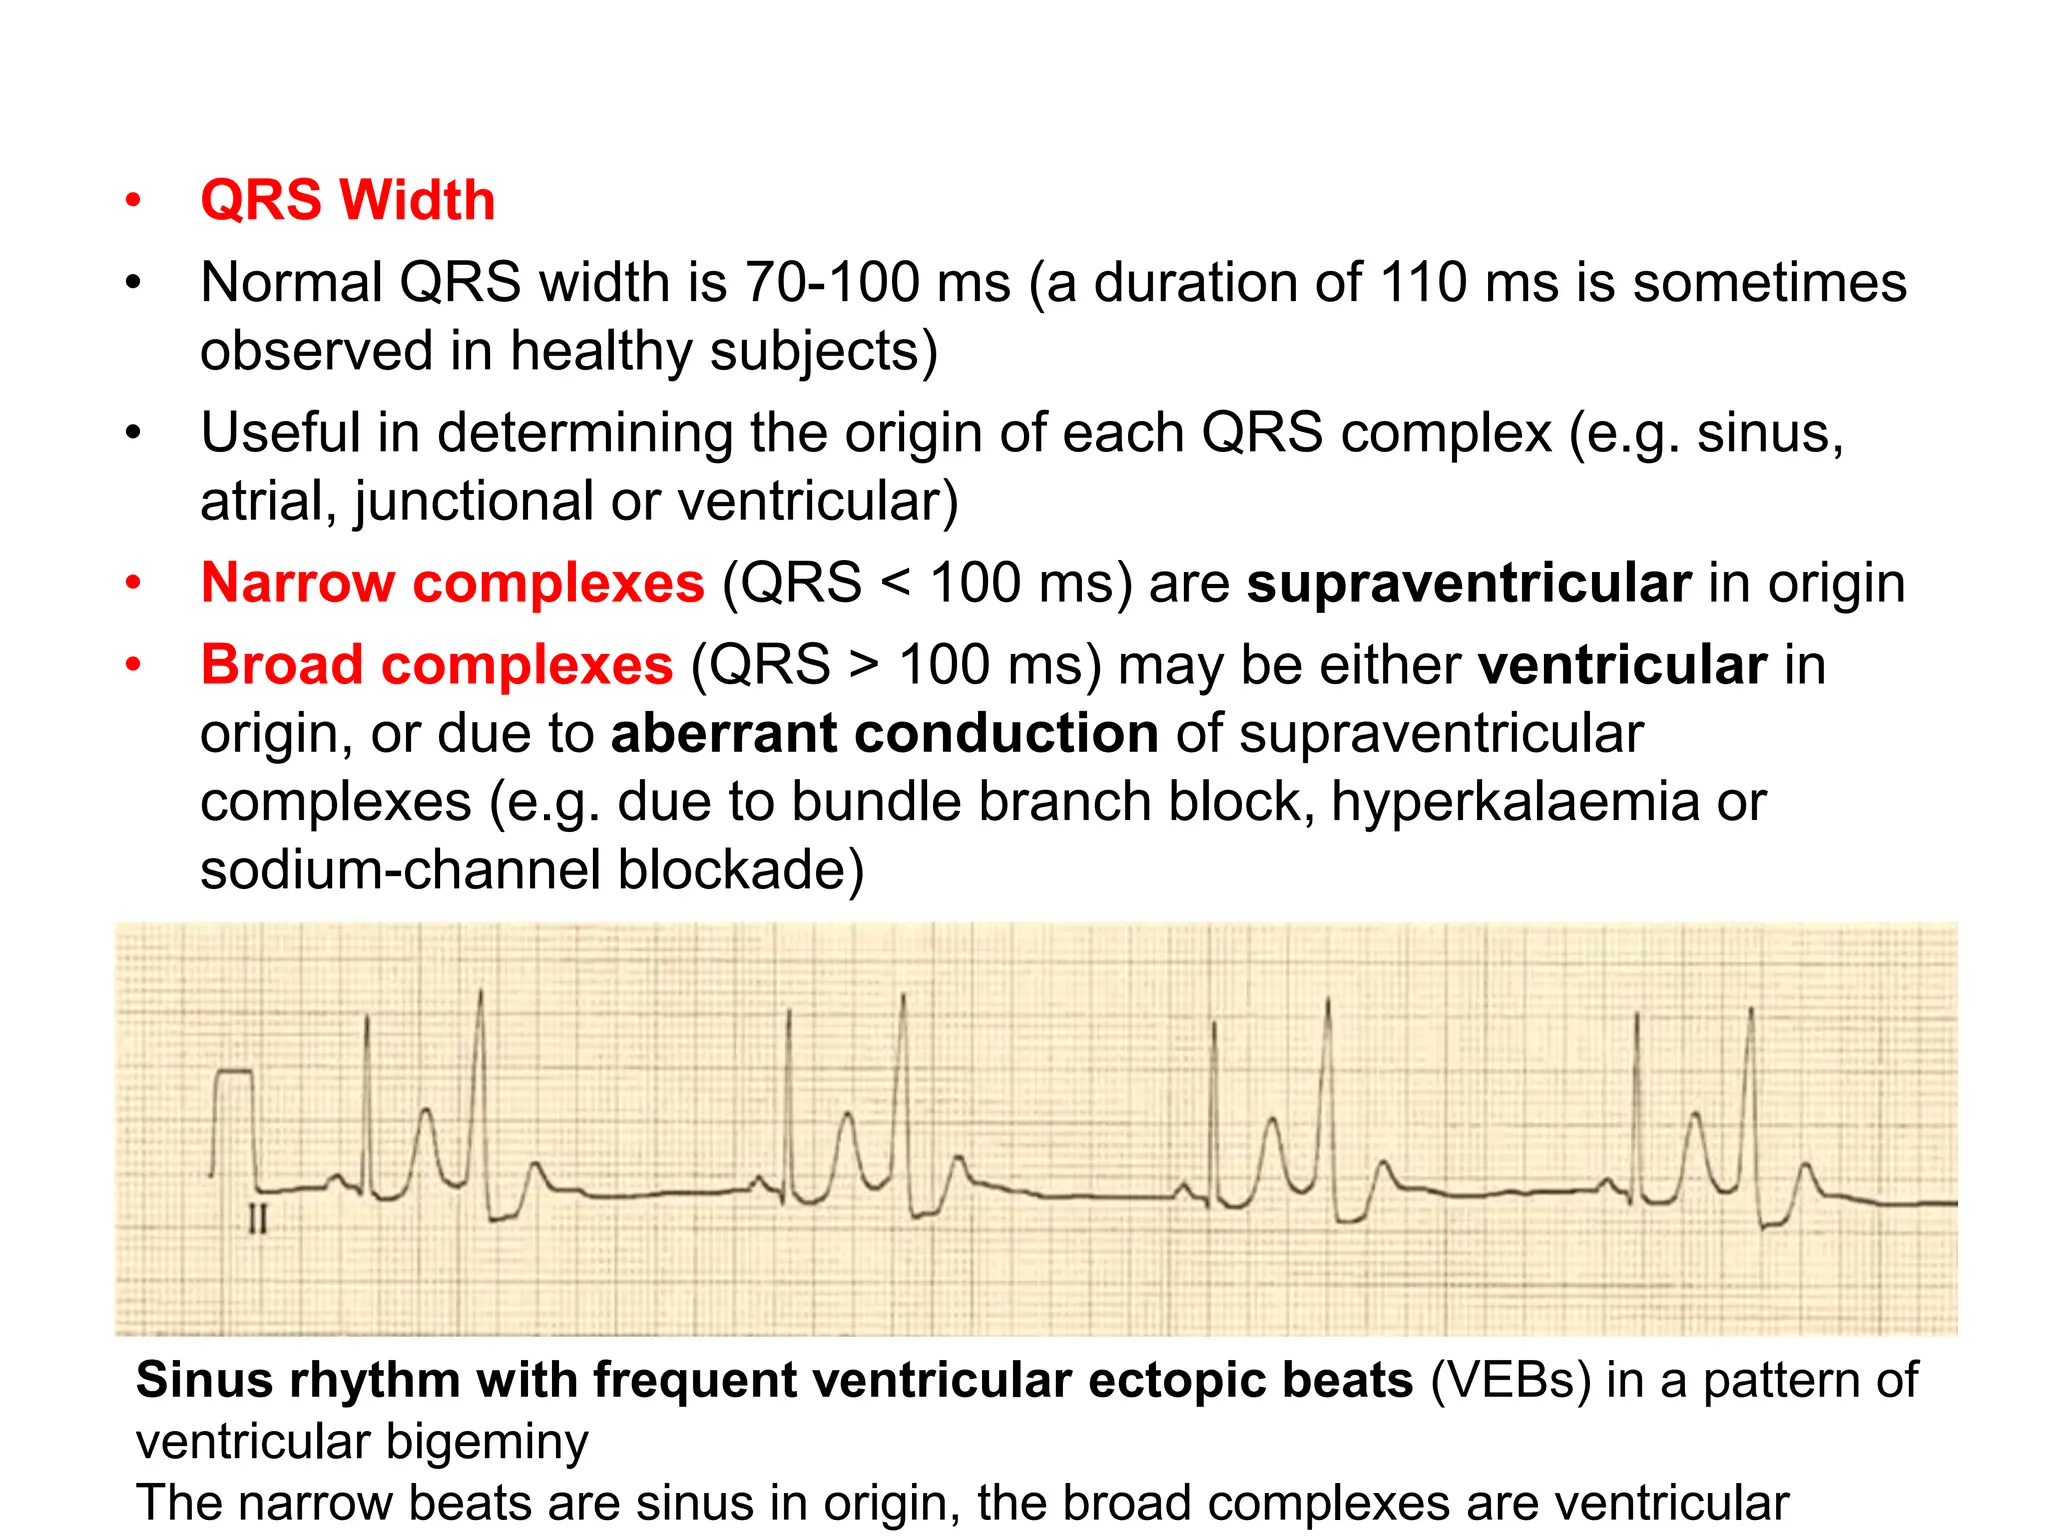
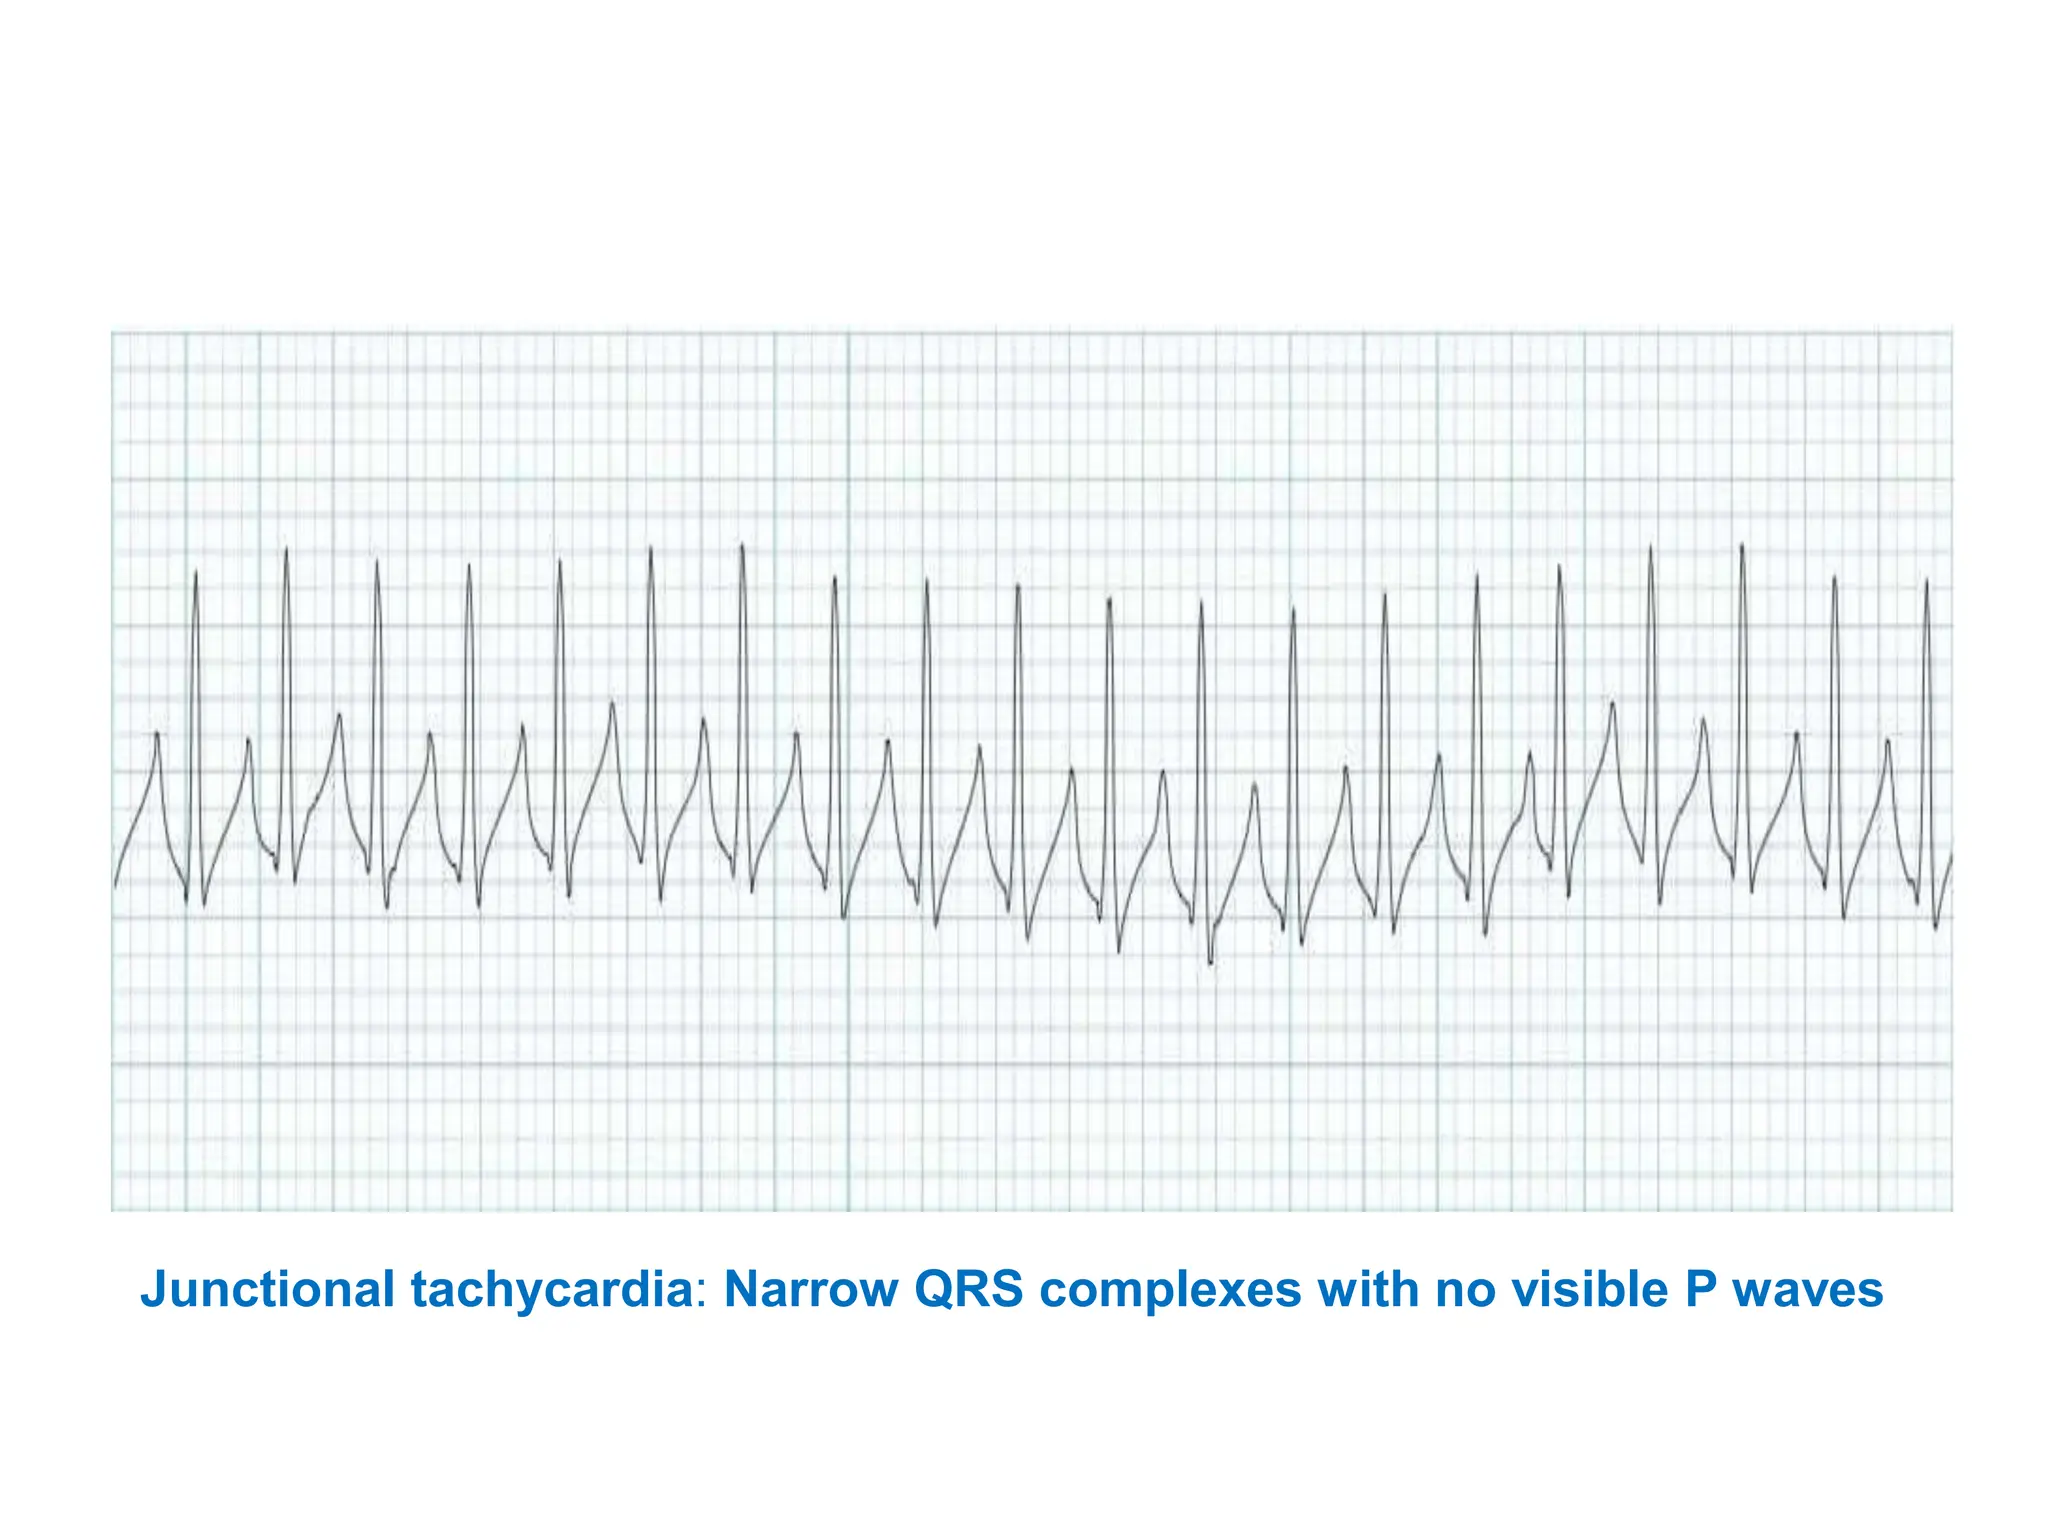
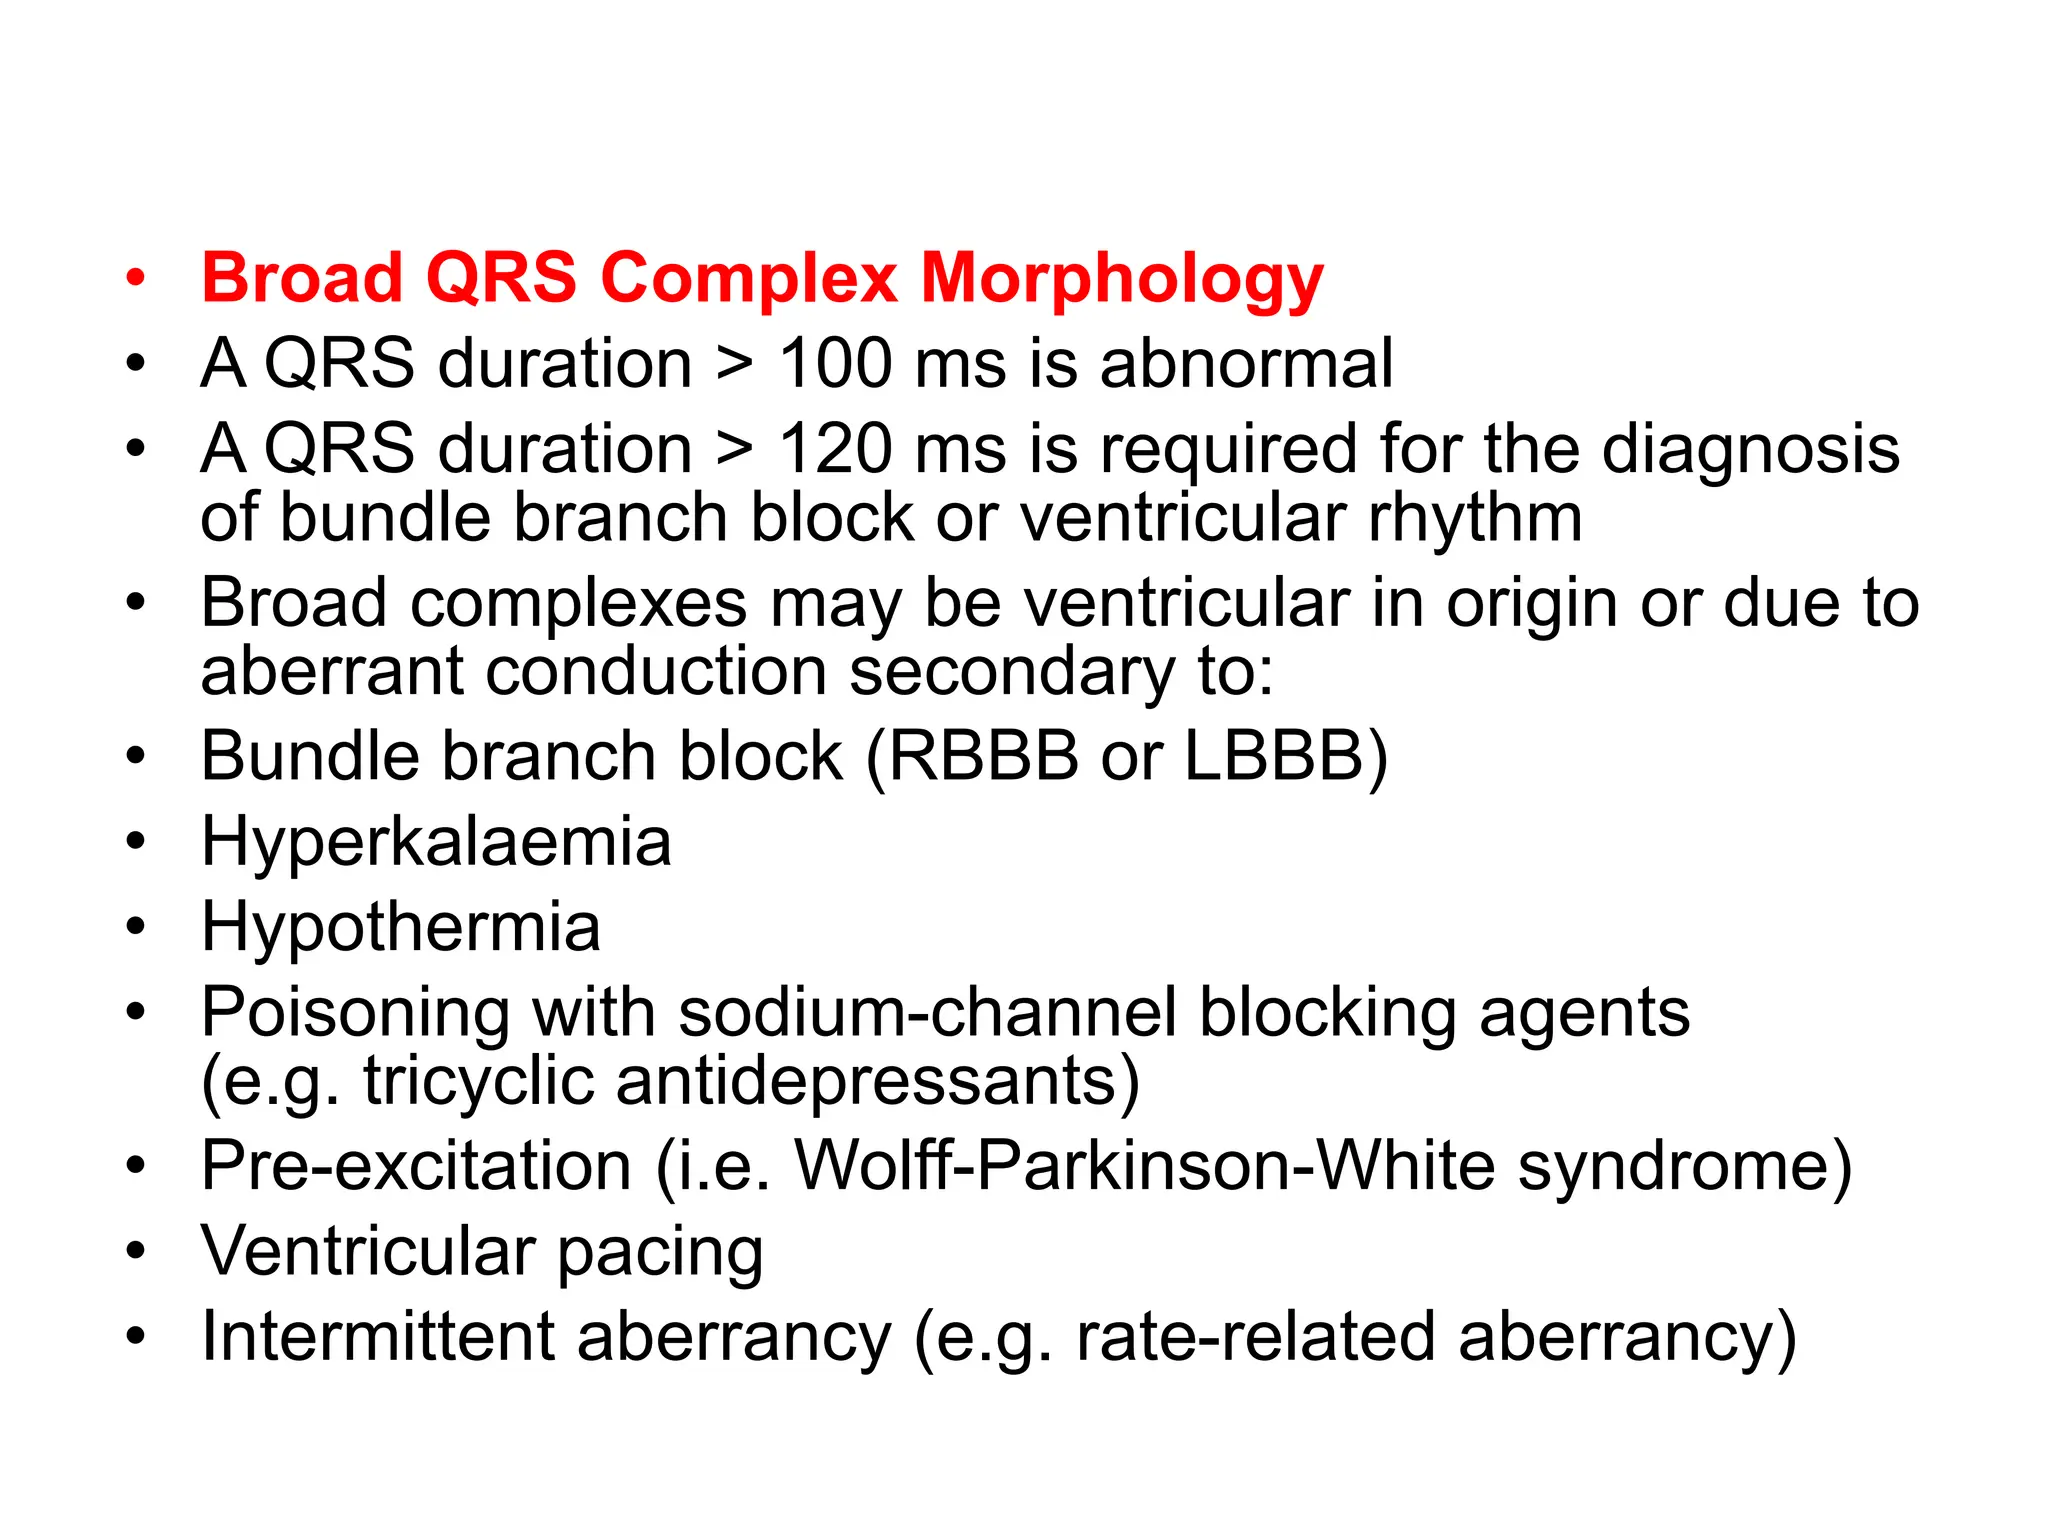
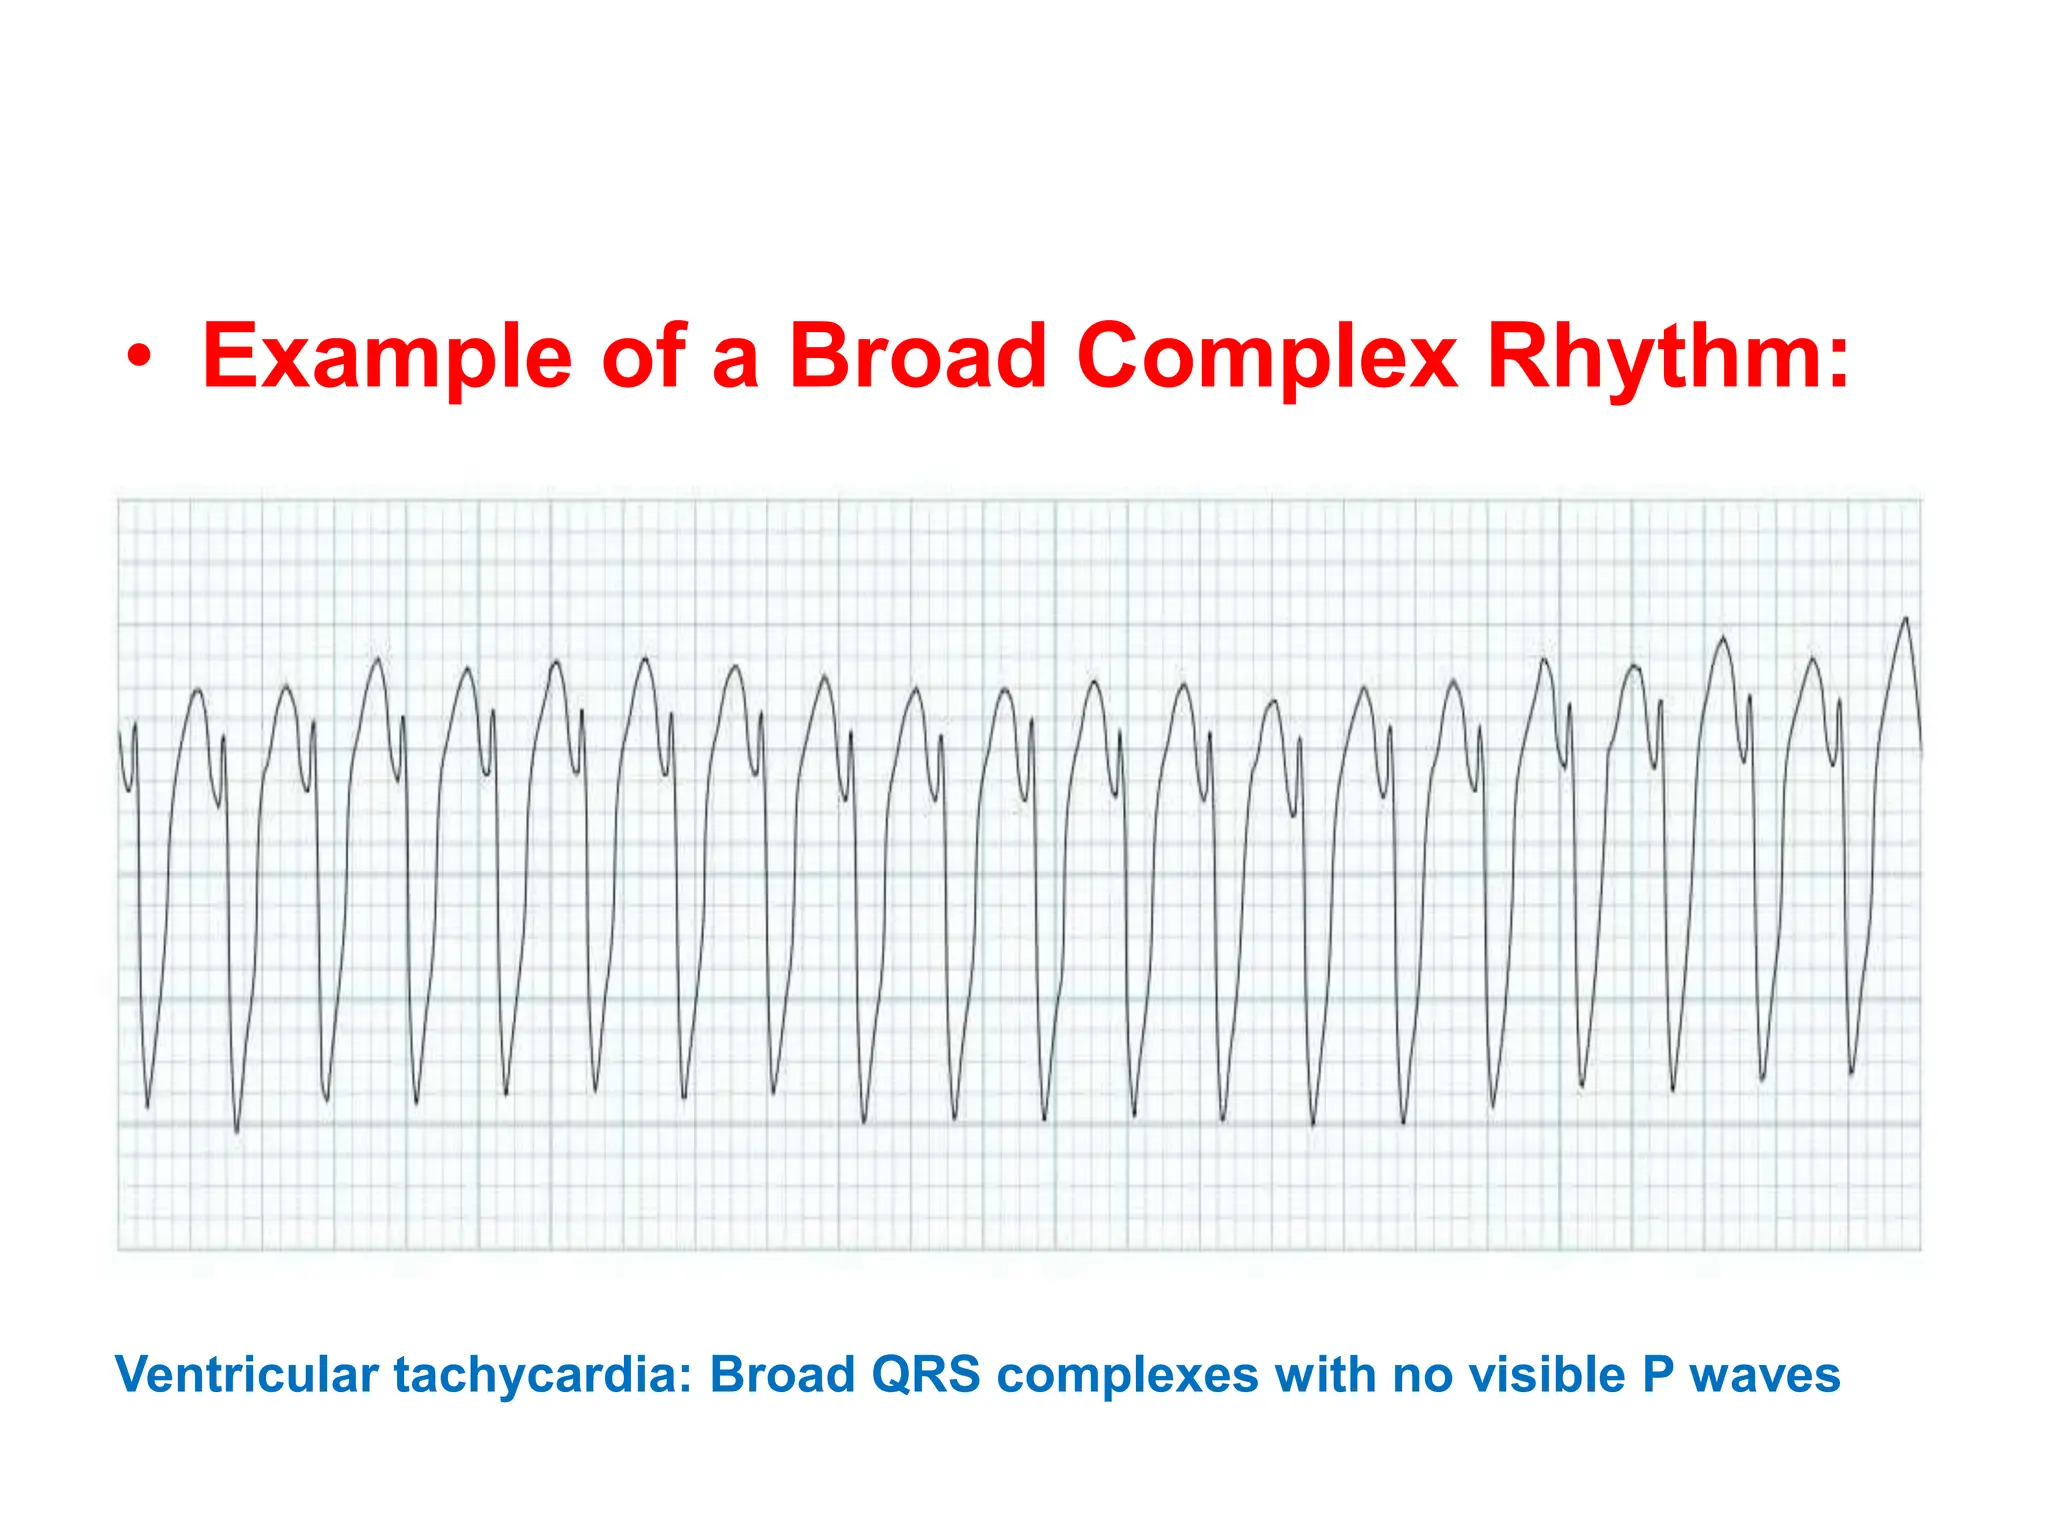
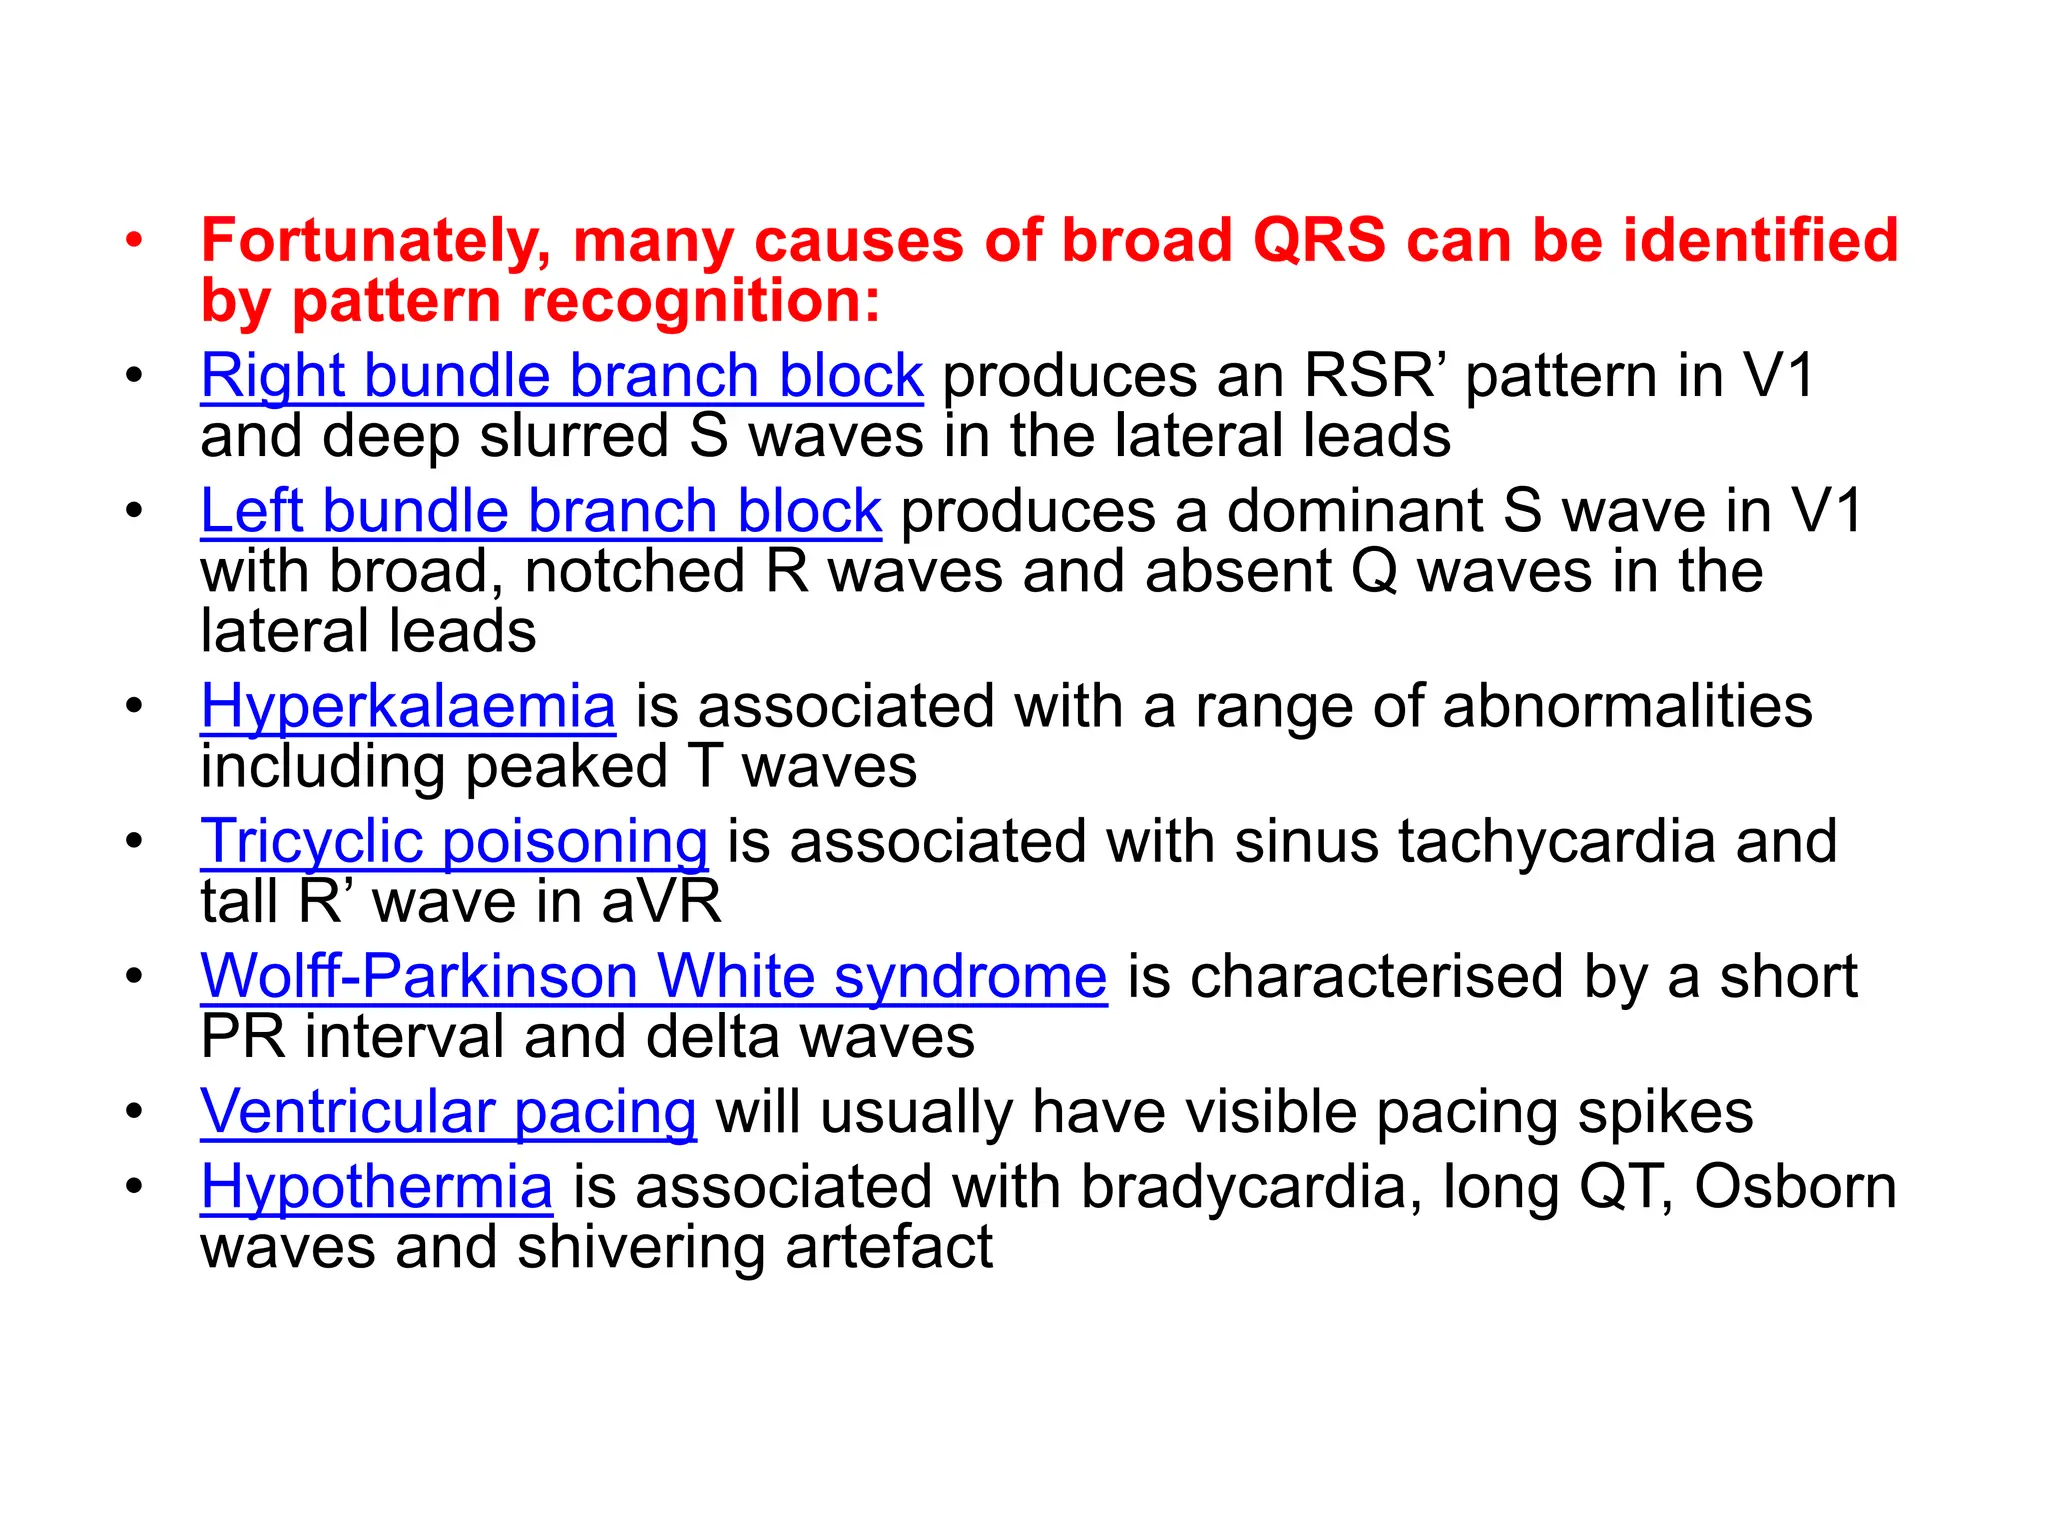
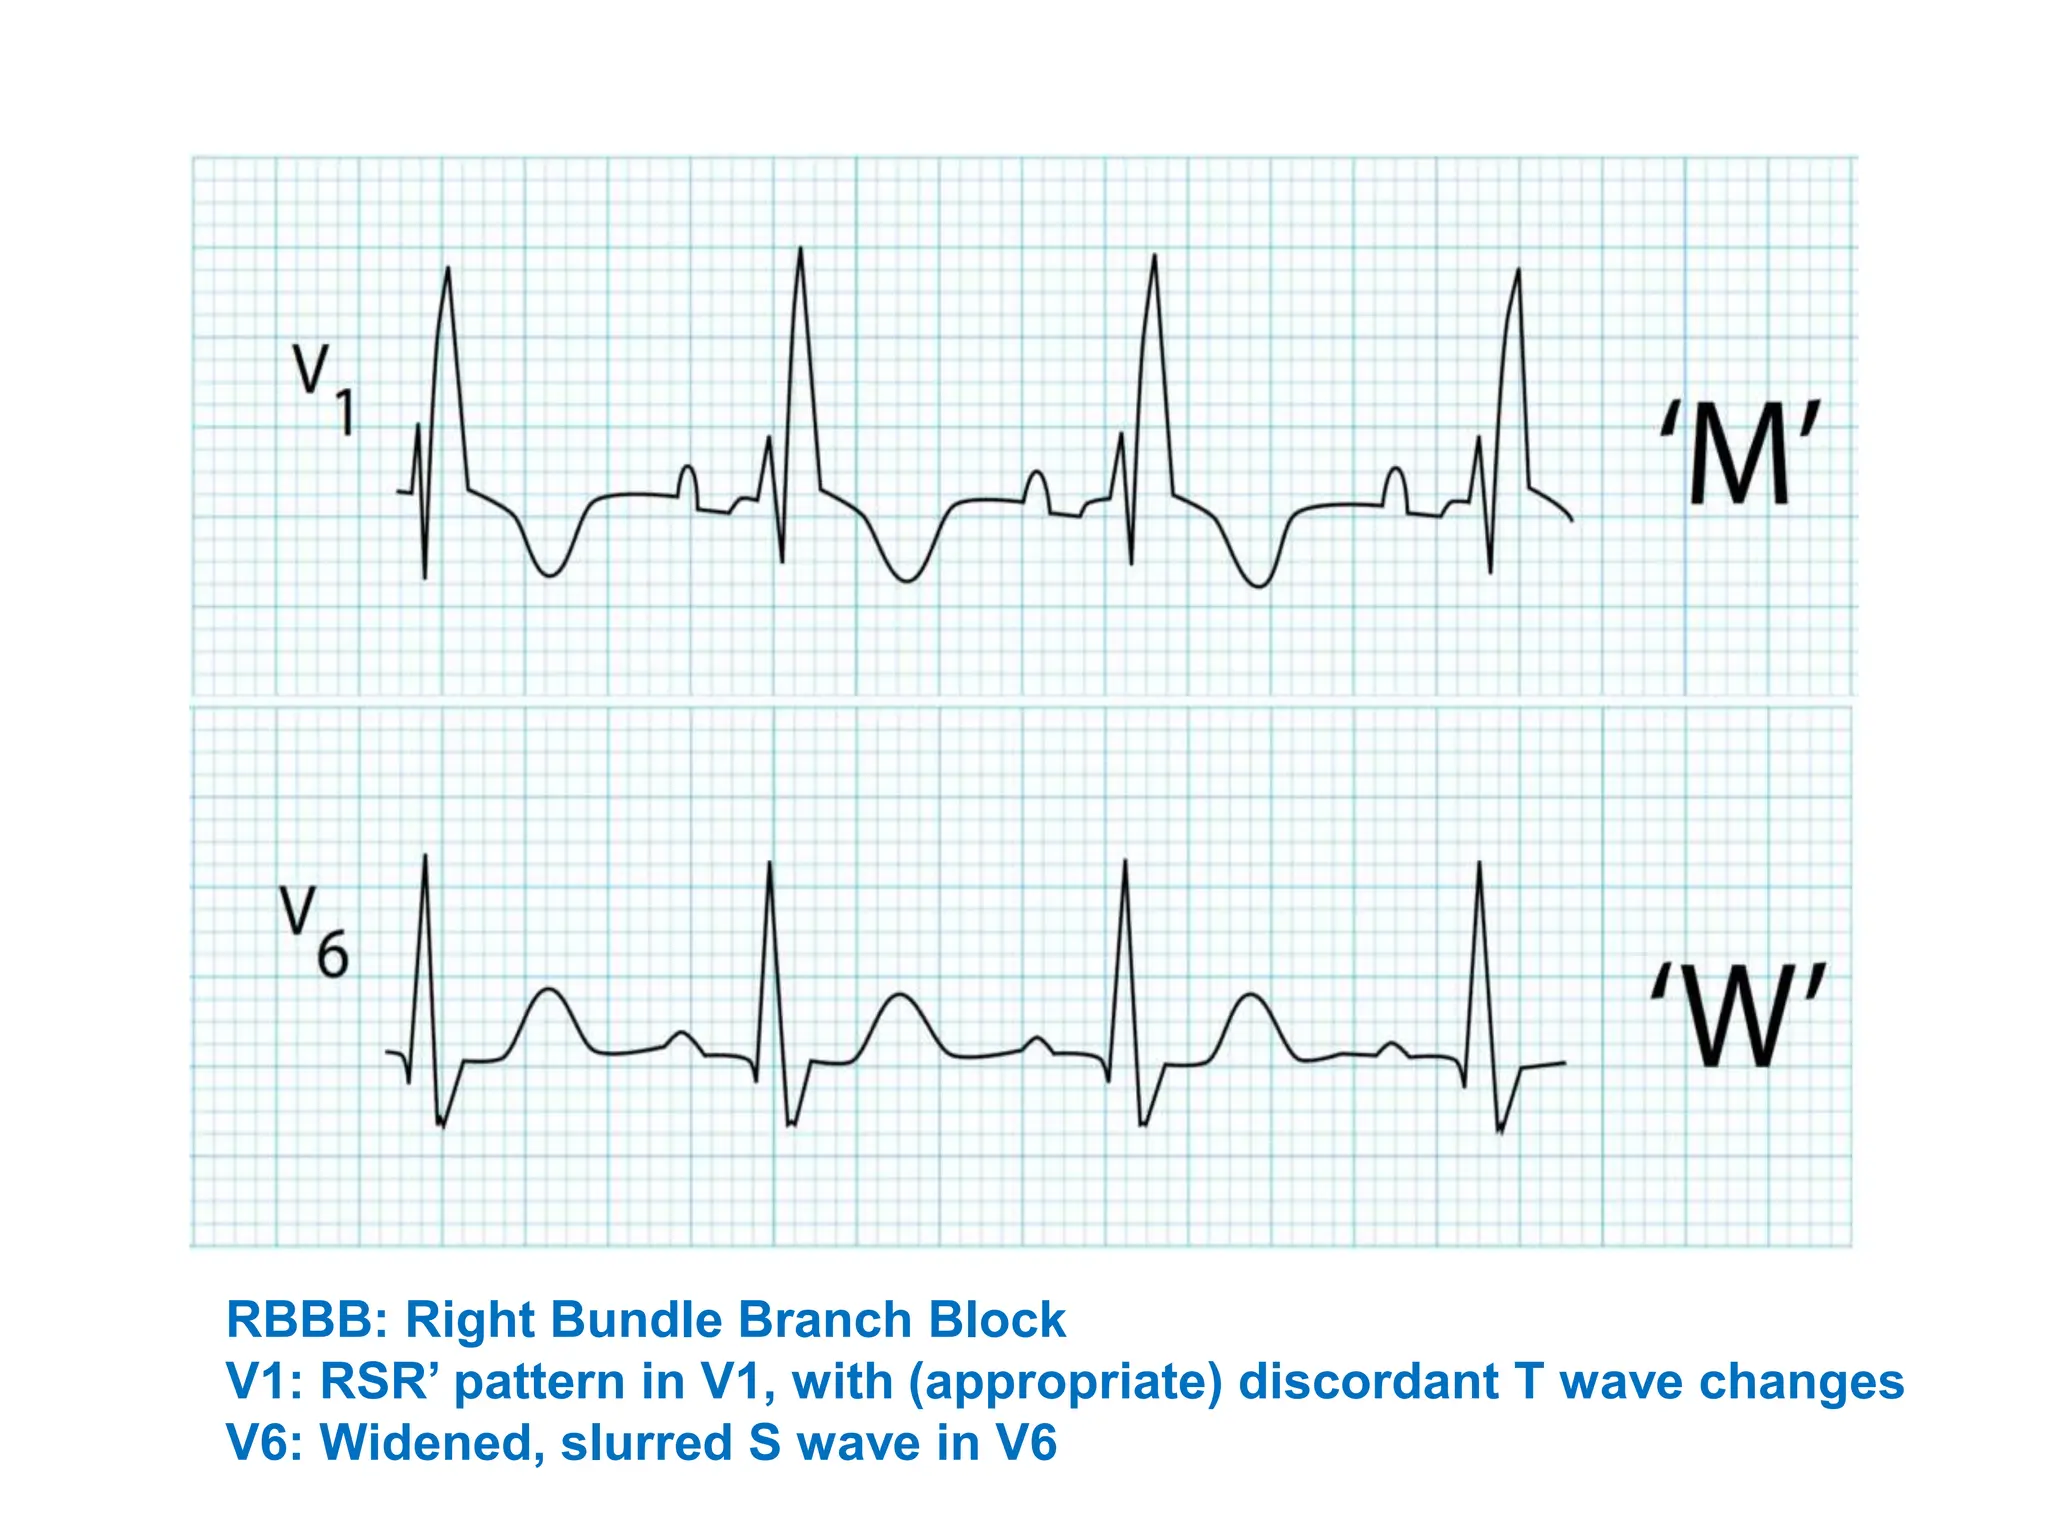
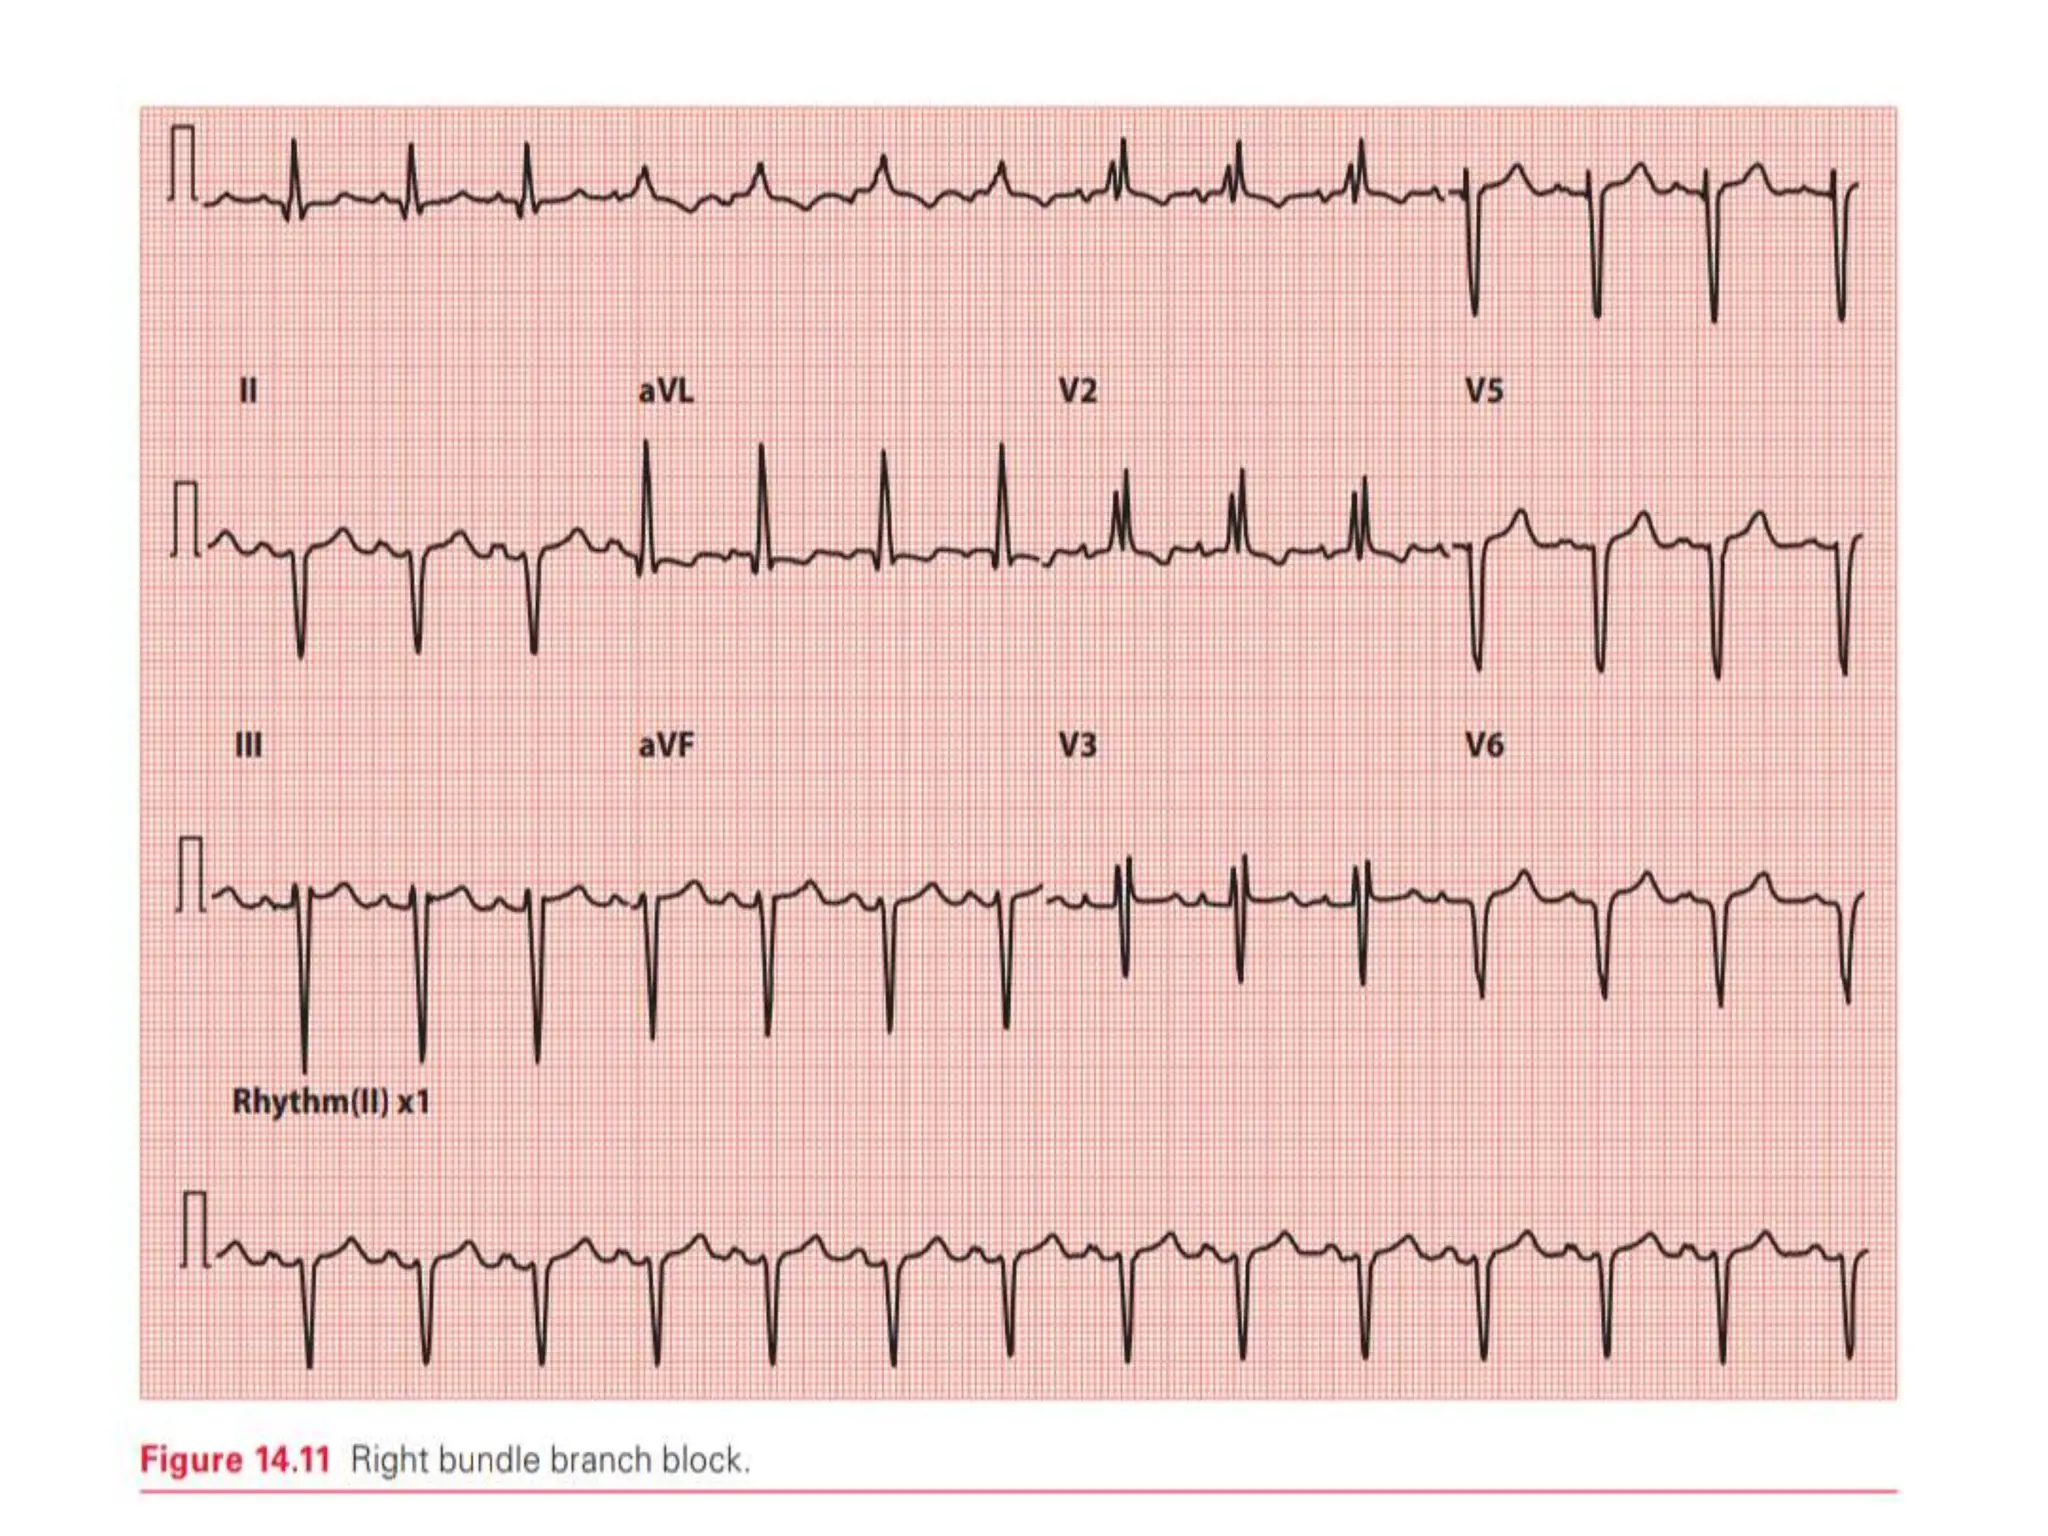
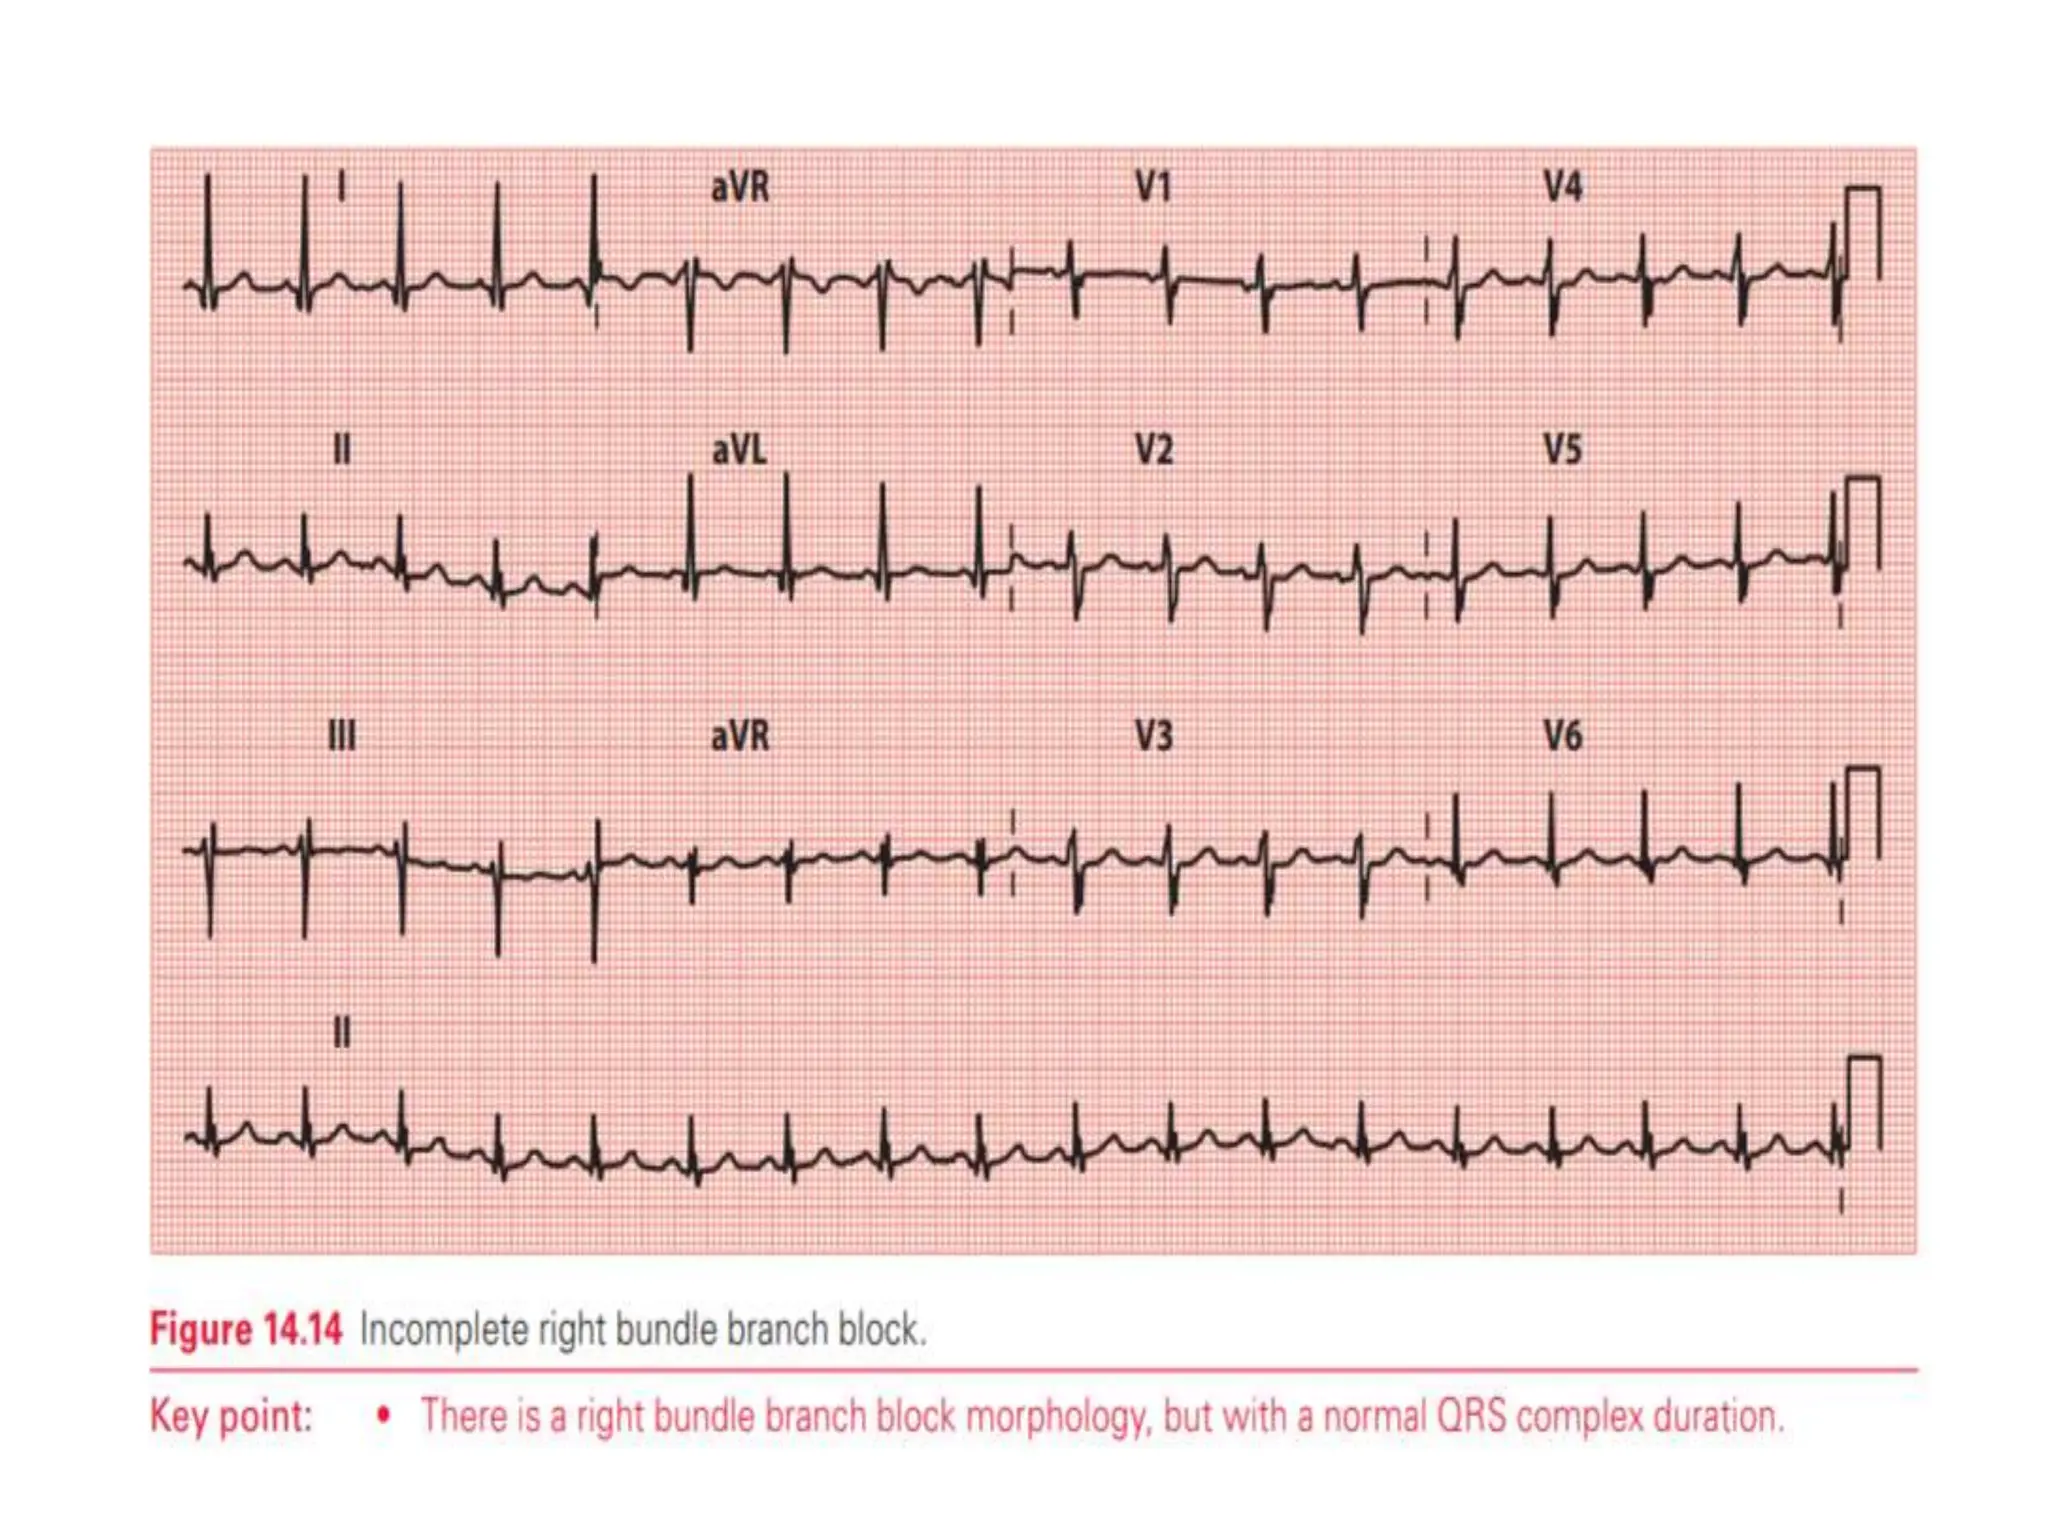
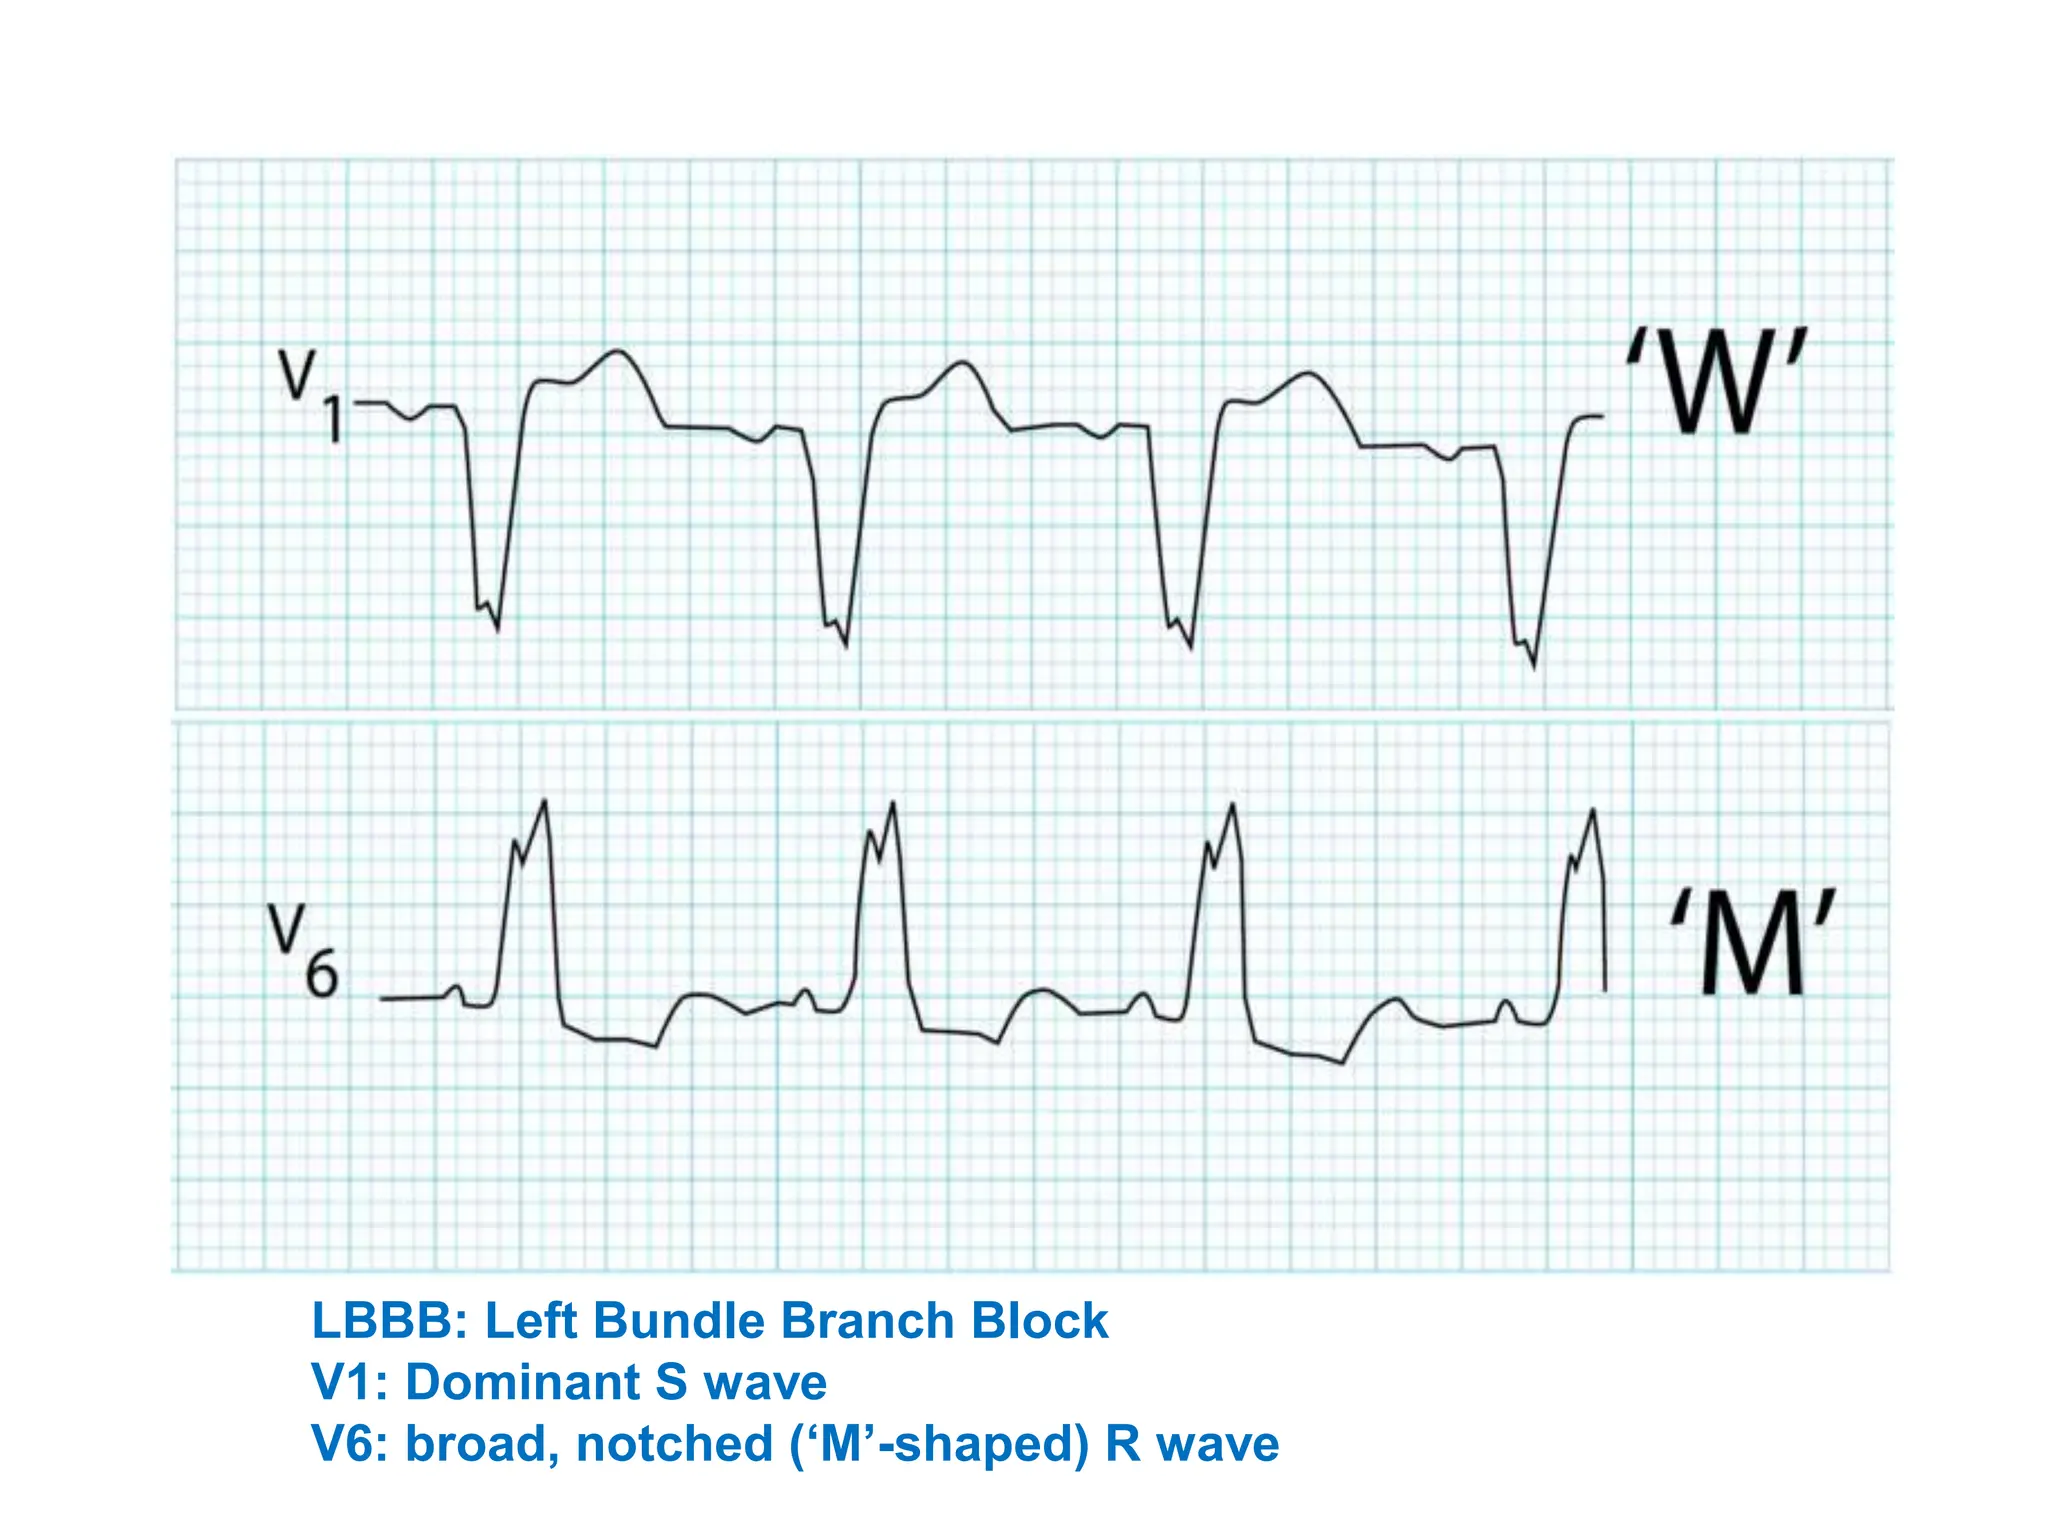
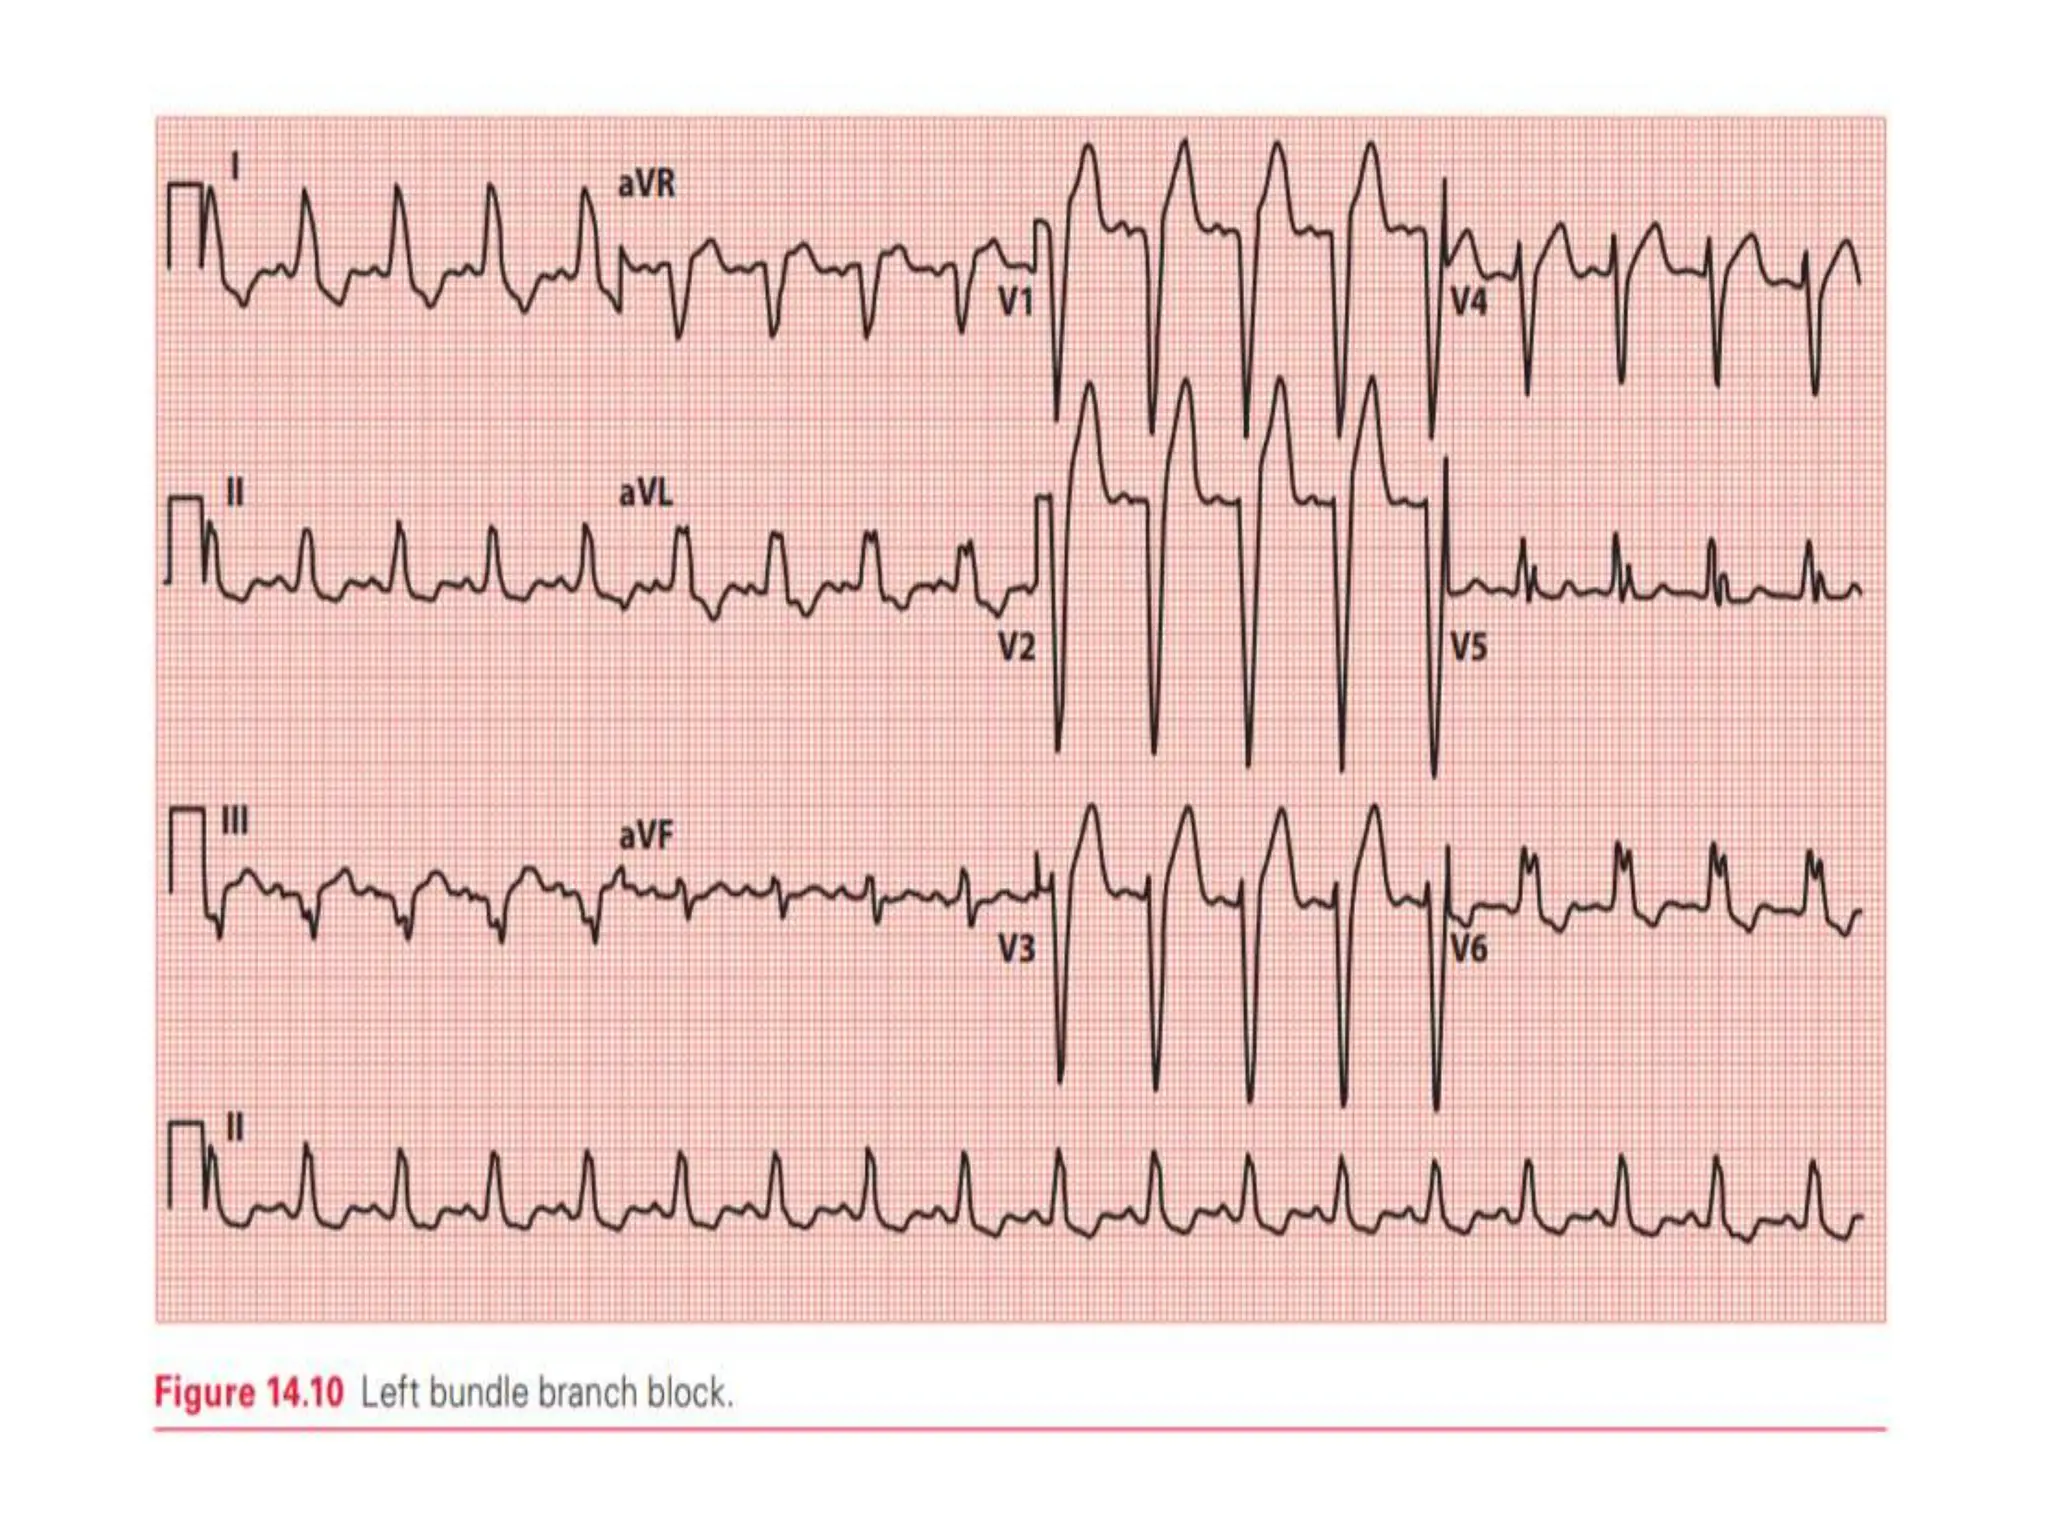
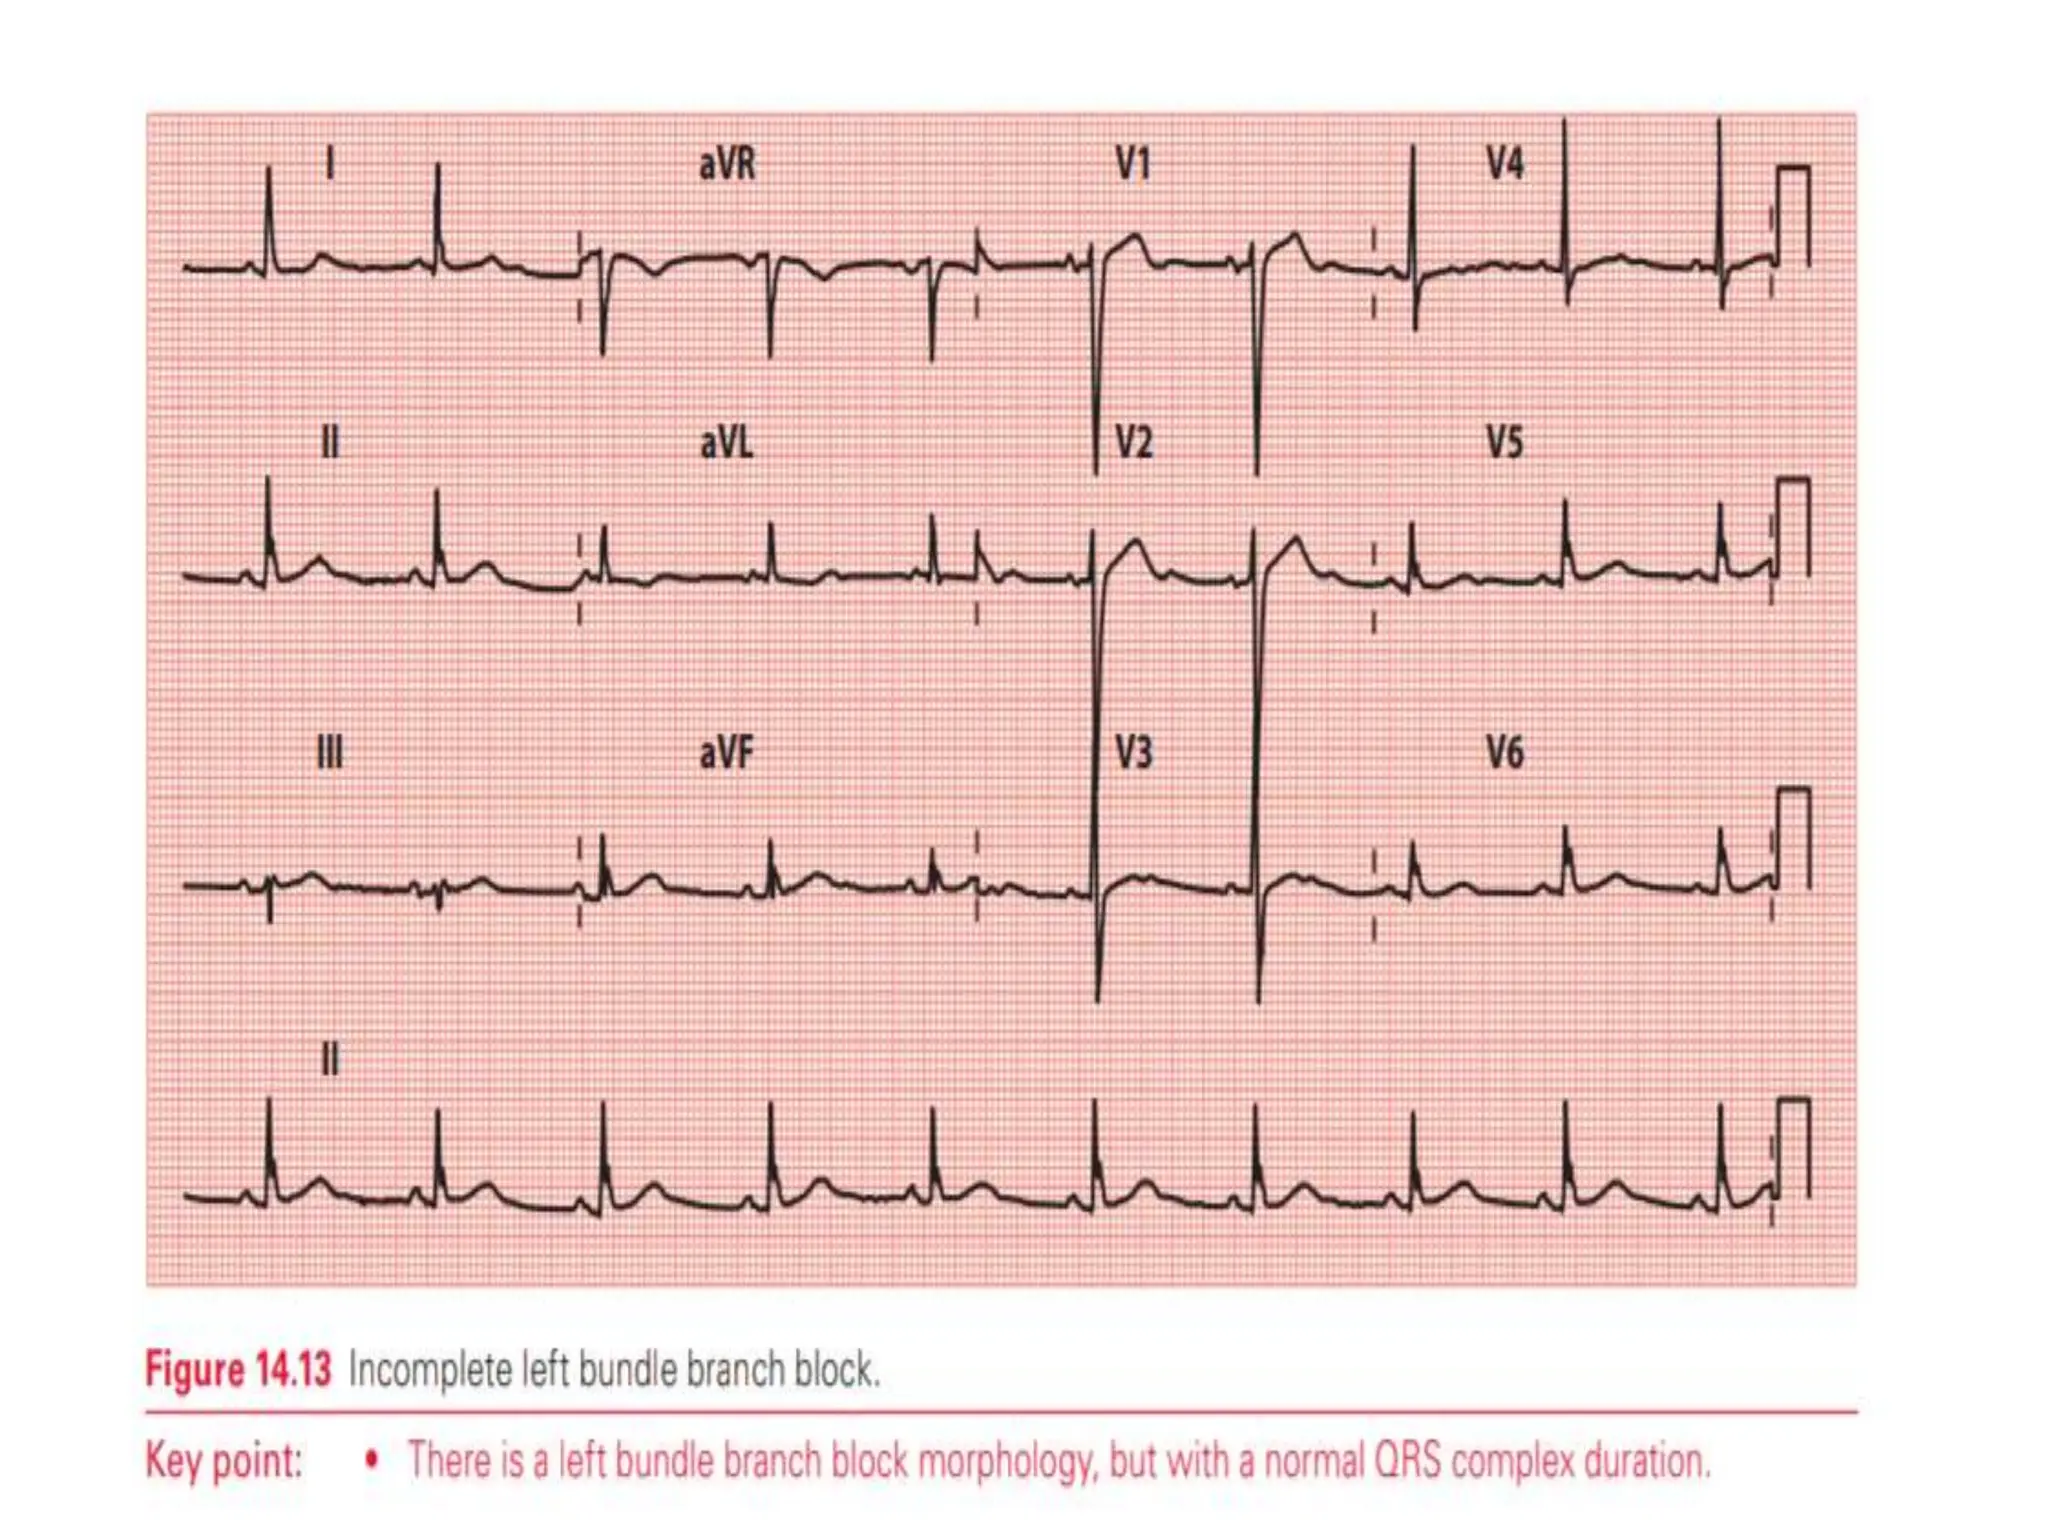
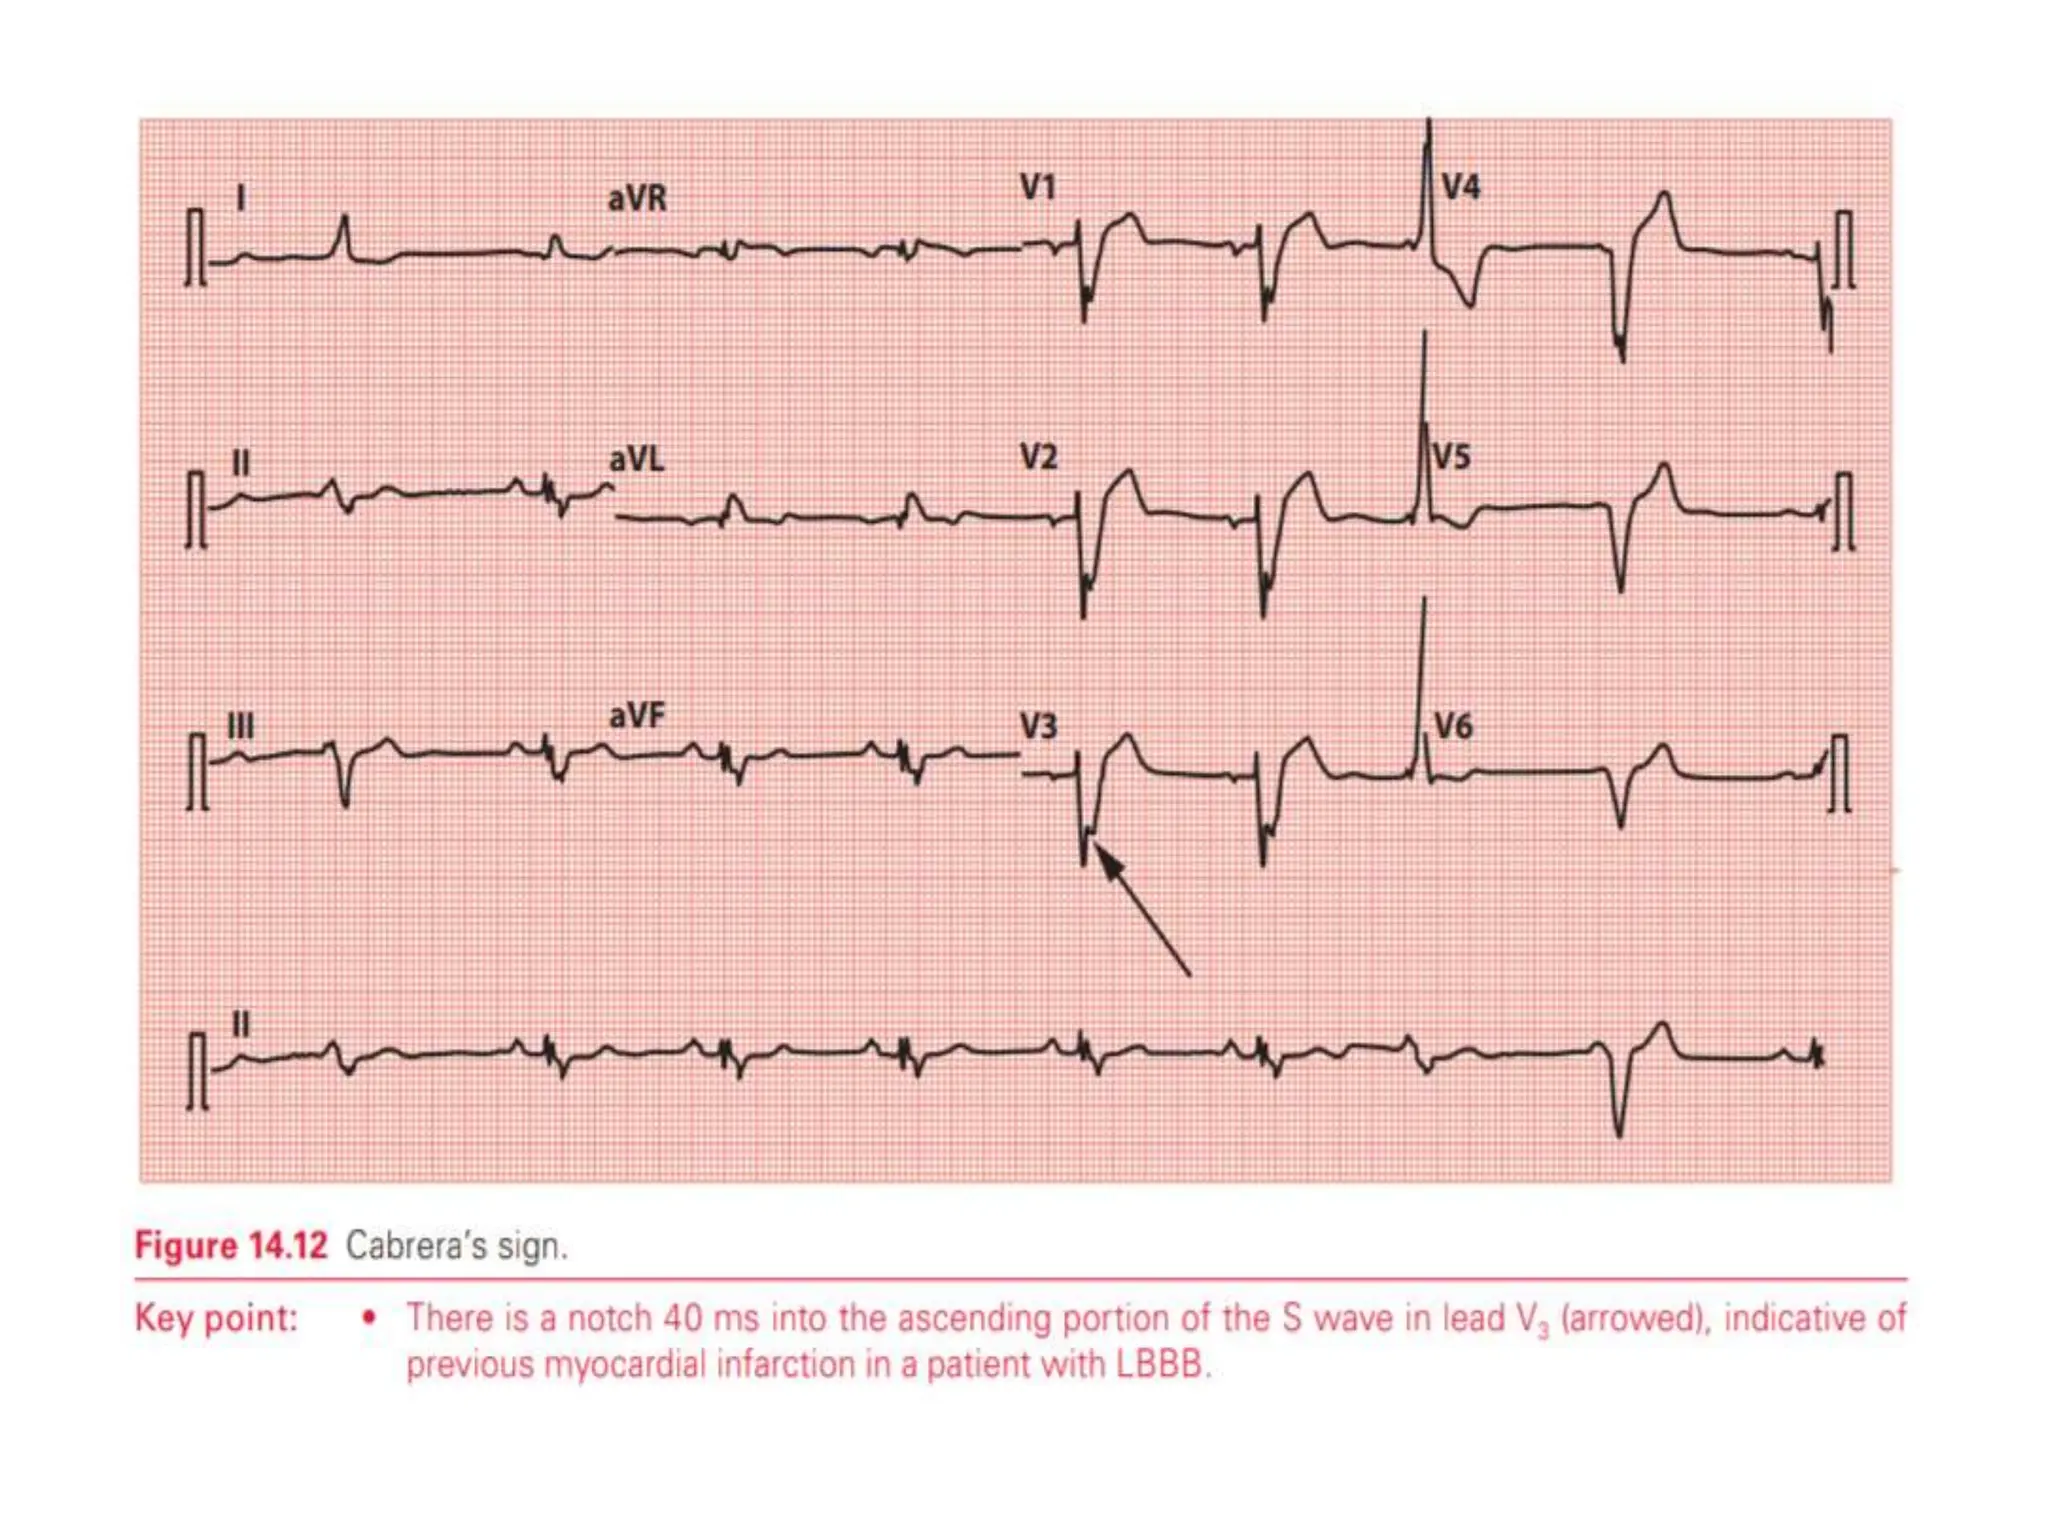
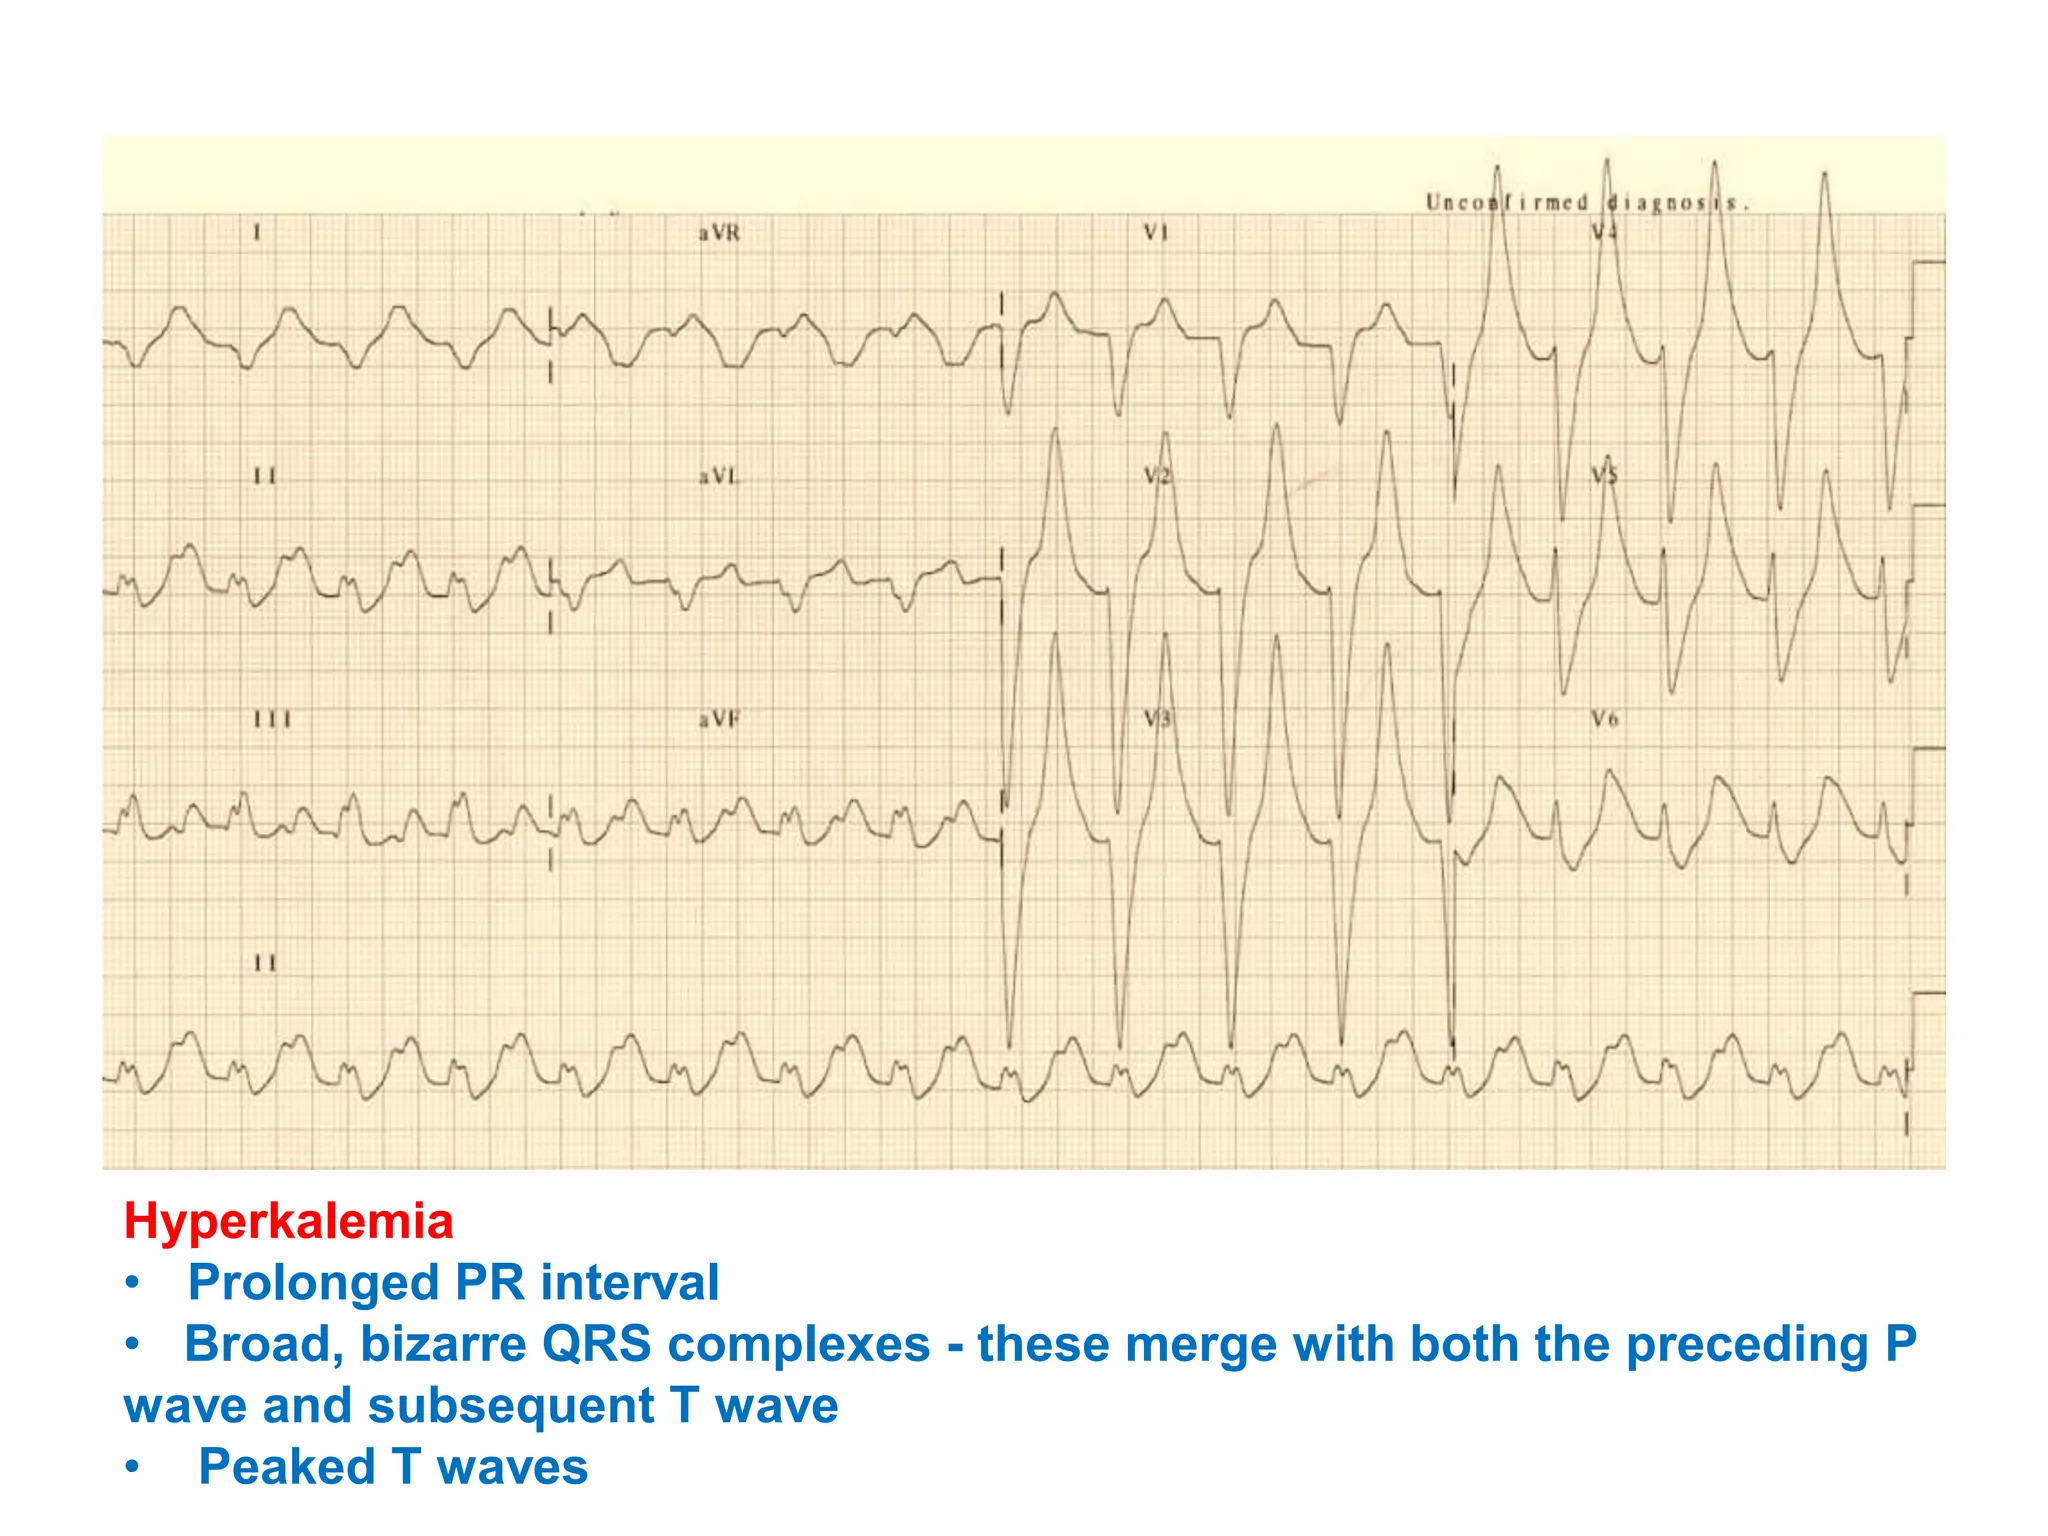
4. A broad QRS complex over 100ms suggests conditions that cause aberrant conduction, like bundle branch blocks, while a narrow QRS