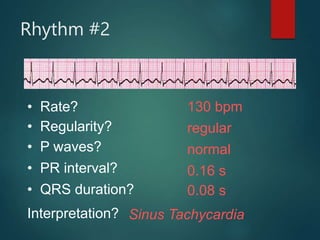
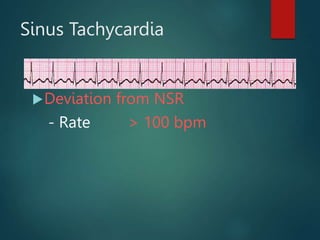
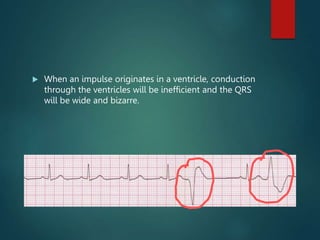
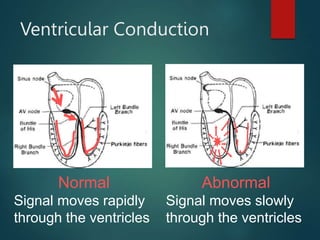
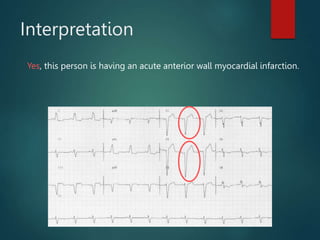
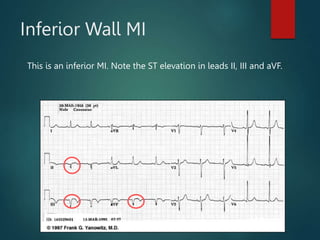
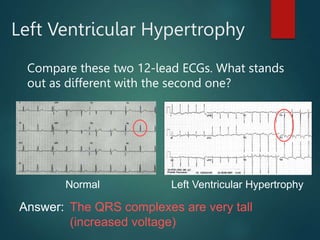
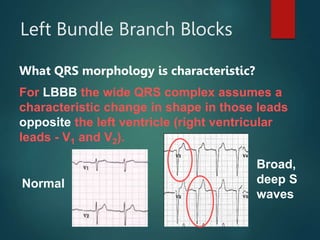
ECG
Interpretation
ECG BASICS
Normal Impulse Conduction
Sinoatrial node
AV node
Bundle of His
Bundle Branches
Purkinje fibers
Impulse Conduction & the ECG
Sinoatrial node
AV node
Bundle of His
Bundle Branches
Purkinje fibers
The “PQRST”
 P wave - Atrial
depolarization
• T wave - Ventricular
repolarization
• QRS - Ventricular
depolarization
The PR Interval
Atrial depolarization
+
delay in AV junction
(AV node/Bundle of His)
(delay allows time for the atria to
contract before the ventricles
contract)
Pacemakers of the Heart
 SA Node - Dominant pacemaker with an intrinsic rate
of 60 - 100 beats/minute.
 AV Node - Back-up pacemaker with an intrinsic rate of
40 - 60 beats/minute.
 Ventricular cells - Back-up pacemaker with an intrinsic
rate of 20 - 45 bpm.
The ECG Paper
 Horizontally
 One small box - 0.04 s
 One large box - 0.20 s
 Vertically
 One large box - 0.5 mV
The ECG Paper (cont)
 Every 3 seconds (15 large boxes) is marked by a
vertical line.
 This helps when calculating the heart rate.
3 sec 3 sec
ECG Rhythm
Interpretation
HOW TO ANALYZE A RHYTHM
Rhythm Analysis
 Step 1: Calculate rate.
 Step 2: Determine regularity.
 Step 3: Assess the P waves.
 Step 4: Determine PR interval.
 Step 5: Determine QRS duration.
Step 1: Calculate Rate
 Option 1
 Count the # of R waves in a 6 second rhythm strip, then
multiply by 10.
 Reminder: all rhythm strips in the Modules are 6 seconds
in length.
Interpretation?
9 x 10 = 90 bpm
3 sec 3 sec
Step 1: Calculate Rate
 Option 2
 Find a R wave that lands on a bold line.
 Count the # of large boxes to the next R wave. If the
second R wave is 1 large box away the rate is 300, 2
boxes - 150, 3 boxes - 100, 4 boxes - 75, etc. (cont)
R wave
Step 1: Calculate Rate
 Option 2 (cont)
 Memorize the sequence:
300 - 150 - 100 - 75 - 60 - 50
Interpretation?
3
0
0
1
5
0
1
0
0
7
5
6
0
5
0
Approx. 1 box less than
100 = 95 bpm
Step 2: Determine regularity
 Look at the R-R distances (using a caliper
or markings on a pen or paper).
 Regular (are they equidistant apart)?
Occasionally irregular? Regularly
irregular? Irregularly irregular?
Interpretation?
Regular
R R
Step 3: Assess the P waves
 Are there P waves?
 Do the P waves all look alike?
 Do the P waves occur at a regular rate?
 Is there one P wave before each QRS?
Interpretation?
Normal P waves with 1 P
wave for every QRS
Step 4: Determine PR interval
 Normal: 0.12 - 0.20 seconds.
(3 - 5 boxes)
Interpretation?
0.12 seconds
Step 5: QRS duration
 Normal: 0.04 - 0.12 seconds.
(1 - 3 boxes)
Interpretation?
0.08 seconds
Rhythm Summary
 Rate 90-95 bpm
 Regularity regular
 P waves normal
 PR interval 0.12 s
 QRS duration 0.08 s
Interpretation? Normal Sinus Rhythm
ECG Rhythm
Interpretation
NORMAL SINUS RHYTHM
Course Objectives
 To recognize the normal rhythm of the heart - “Normal
Sinus Rhythm.”
 To recognize the 13 most common rhythm
disturbances.
 To recognize an acute myocardial infarction on a 12-
lead ECG.
Learning Modules
ECG Basics
How to Analyze a Rhythm
Normal Sinus Rhythm
Heart Arrhythmias
Diagnosing a Myocardial
Infarction
Advanced 12-Lead Interpretation
Normal Sinus Rhythm (NSR)
 Etiology: the electrical impulse is formed in the SA
node and conducted normally.
 This is the normal rhythm of the heart; other rhythms
that do not conduct via the typical pathway are called
arrhythmias.
NSR Parameters
 Rate 60 - 100 bpm
 Regularity regular
 P waves normal
 PR interval 0.12 - 0.20 s
 QRS duration 0.04 - 0.12 s
Any deviation from above is sinus tachycardia, sinus bradycardia or
an arrhythmia
Arrhythmia Formation
Arrhythmias can arise from problems in the:
• Sinus node
• Atrial cells
• AV junction
• Ventricular cells
SA Node Problems
The SA Node
can:
 fire too slow
 fire too fast
Sinus Bradycardia
Sinus Tachycardia
Sinus Tachycardia may be an appropriate
response to stress.
Atrial Cell Problems
Atrial cells can:
 fire occasionally
from a focus
 fire
continuously
due to a
looping re-
entrant circuit
Premature Atrial
Contractions (PACs)
Atrial Flutter
Take a note….
 A re-entrant pathway
occurs when an impulse
loops and results in self-
perpetuating impulse
formation.
Atrial Cell Problems
Atrial cells can also:
• fire continuously
from multiple foci
or
fire continuously
due to multiple
micro re-entrant
“wavelets”
Atrial Fibrillation
Atrial Fibrillation
Multiple micro re-
entrant “wavelets”
refers to wandering
small areas of
activation which
generate fine chaotic
impulses. Colliding
wavelets can, in turn,
generate new foci of
activation.
Atrial tissue
AV Junctional Problems
The AV junction can:
 fire continuously
due to a looping
re-entrant circuit
 block impulses
coming from the
SA Node
Paroxysmal
Supraventricular
Tachycardia
AV Junctional Blocks
Ventricular Cell Problems
Ventricular cells can:
 fire occasionally from
1 or more foci
 fire continuously from
multiple foci
 fire continuously due
to a looping re-
entrant circuit
Premature Ventricular
Contractions (PVCs)
Ventricular Fibrillation
Ventricular Tachycardia
ECG Rhythm
Interpretation
SINUS RHYTHMS AND
PREMATURE BEATS
Arrhythmias
Sinus Rhythms
Premature Beats
Supraventricular Arrhythmias
Ventricular Arrhythmias
AV Junctional Blocks
Sinus Rhythms
Sinus Bradycardia
Sinus Tachycardia
Rhythm #1
30 bpm
• Rate?
• Regularity? regular
normal
0.10 s
• P waves?
• PR interval? 0.12 s
• QRS duration?
Interpretation? Sinus Bradycardia
Sinus Bradycardia
Deviation from NSR
- Rate < 60 bpm
Sinus Bradycardia
 Etiology: SA node is depolarizing slower than normal,
impulse is conducted normally (i.e. normal PR and QRS
interval).
Rhythm #2
130 bpm
• Rate?
• Regularity? regular
normal
0.08 s
• P waves?
• PR interval? 0.16 s
• QRS duration?
Interpretation? Sinus Tachycardia
Sinus Tachycardia
Deviation from NSR
- Rate > 100 bpm
Sinus Tachycardia
 Etiology: SA node is depolarizing faster than normal,
impulse is conducted normally.
 Remember: sinus tachycardia is a response to physical
or psychological stress, not a primary arrhythmia.
Premature Beats
Premature Atrial Contractions
(PACs)
Premature Ventricular
Contractions (PVCs)
Rhythm #3
70 bpm
• Rate?
• Regularity? occasionally irreg.
2/7 different contour
0.08 s
• P waves?
• PR interval? 0.14 s (except 2/7)
• QRS duration?
Interpretation? NSR with Premature
Atrial Contractions
Premature Atrial
Contractions
Deviation from NSR
These ectopic beats originate in
the atria (but not in the SA node),
therefore the contour of the P
wave, the PR interval, and the
timing are different than a
normally generated pulse from
the SA node.
Premature Atrial
Contractions
 Etiology: Excitation of an atrial cell forms an impulse
that is then conducted normally through the AV node
and ventricles.
 When an impulse originates anywhere in the atria (SA node, atrial
cells, AV node, Bundle of His) and then is conducted normally
through the ventricles, the QRS will be narrow (0.04 - 0.12 s).
Rhythm #4
60 bpm
• Rate?
• Regularity? occasionally irreg.
none for 7th QRS
0.08 s (7th wide)
• P waves?
• PR interval? 0.14 s
• QRS duration?
Interpretation? Sinus Rhythm with 1 PVC
PVCs
 Deviation from NSR
 Ectopic beats originate in the ventricles resulting in wide and bizarre
QRS complexes.
 When there are more than 1 premature beats and look alike, they are
called “uniform”. When they look different, they are called “multiform”.
PVCs
 Etiology: One or more ventricular cells are depolarizing and the
impulses are abnormally conducting through the ventricles.
 When an impulse originates in a ventricle, conduction
through the ventricles will be inefficient and the QRS
will be wide and bizarre.
Ventricular Conduction
Normal
Signal moves rapidly
through the ventricles
Abnormal
Signal moves slowly
through the ventricles
ECG Rhythm
Interpretation
ACUTE MYOCARDIAL INFARCTION
Diagnosing a MI
To diagnose a myocardial infarction you need to go beyond
looking at a rhythm strip and obtain a 12-Lead ECG.
Rhythm
Strip
12-Lead
ECG
The 12-Lead ECG
The 12-Lead ECG sees the heart from
12 different views.
Therefore, the 12-Lead ECG helps
you see what is happening in
different portions of the heart.
The rhythm strip is only 1 of these 12
views.
The 12-Leads
The 12-leads include:
–3 Limb leads
(I, II, III)
–3 Augmented leads
(aVR, aVL, aVF)
–6 Precordial leads
(V1- V6)
Views of the Heart
Some leads get a good view
of the:
Anterior portion
of the heart
Lateral portion
of the heart
Inferior portion
of the heart
ST Elevation
One way to diagnose
an acute MI is to look
for elevation of the ST
segment.
ST Elevation (cont)
Elevation of the ST segment
(greater than 1 small box) in
2 leads is consistent with a
myocardial infarction.
Anterior View of the Heart
The anterior portion of the heart is best viewed using leads V1- V4.
Anterior Myocardial
Infarction
If you see changes in leads V1 -
V4 that are consistent with a
myocardial infarction, you can
conclude that it is an anterior
wall myocardial infarction.
Putting it all Together
Do you think this person is having a myocardial infarction. If so,
where?
Interpretation
Yes, this person is having an acute anterior wall myocardial infarction.
Other MI Locations
Now that you know where to look for an anterior wall
myocardial infarction let’s look at how you would
determine if the MI involves the lateral wall or the inferior
wall of the heart.
Other MI Locations
First, take a look
again at this
picture of the
heart.
Anterior portion
of the heart
Lateral portion
of the heart
Inferior portion
of the heart
Other MI Locations
Second, remember that the 12-leads of the ECG look at
different portions of the heart. The limb and augmented
leads “see” electrical activity moving inferiorly (II, III and
aVF), to the left (I, aVL) and to the right (aVR). Whereas, the
precordial leads “see” electrical activity in the posterior to
anterior direction.
Limb Leads Augmented Leads Precordial Leads
Other MI Locations
Now, using these 3 diagrams let’s figure where
to look for a lateral wall and inferior wall MI.
Limb Leads Augmented Leads Precordial Leads
Anterior MI
Remember the anterior portion of the heart is
best viewed using leads V1- V4.
Limb Leads Augmented Leads Precordial Leads
Lateral MI
So what leads do you think
the lateral portion of the
heart is best viewed?
Limb Leads Augmented Leads Precordial Leads
Leads I, aVL, and V5- V6
Inferior MI
Now how about the
inferior portion of the
heart?
Limb Leads Augmented Leads Precordial Leads
Leads II, III and aVF
Putting it all Together
Now, where do you think this person is having a myocardial
infarction?
Inferior Wall MI
This is an inferior MI. Note the ST elevation in leads II, III and aVF.
Putting it all Together
How about now?
Anterolateral MI
This person’s MI involves both the anterior wall
(V2-V4) and the lateral wall (V5-V6, I, and aVL)!
ECG Rhythm
Interpretation
ADVANCED 12-LEAD
INTERPRETATION
The 12-Lead ECG
The 12-Lead ECG contains a wealth of information. In previous slides
you learned that ST segment elevation in two leads is suggestive of an
acute myocardial infarction. In this module we will cover:
ST Elevation and non-ST Elevation MIs
Left Ventricular Hypertrophy
Bundle Branch Blocks
ST Elevation and
non-ST Elevation MIs
ST Elevation and non-ST Elevation MIs
 When myocardial blood supply is abruptly
reduced or cut off to a region of the heart, a
sequence of injurious events occur beginning
with ischemia (inadequate tissue perfusion),
followed by necrosis (infarction), and eventual
fibrosis (scarring) if the blood supply isn't
restored in an appropriate period of time.
 The ECG changes over time with each of these
events…
ECG Changes
Ways the ECG can change include:
Appearance
of pathologic
Q-waves
T-waves
peaked flattened inverted
ST elevation &
depression
ECG Changes & the Evolving
MI
There are two
distinct patterns
of ECG change
depending if the
infarction is:
–ST Elevation (Transmural or Q-wave), or
–Non-ST Elevation (Subendocardial or non-Q-wave)
Non-ST
Elevation
ST
Elevation
ST Elevation Infarction
ST depression, peaked T-waves, then
T-wave inversion
The ECG changes seen with a ST elevation infarction are:
Before injury Normal ECG
ST elevation & appearance of
Q-waves
ST segments and T-waves return to
normal, but Q-waves persist
Ischemia
Infarction
Fibrosis
ST Elevation Infarction
A. Normal ECG prior to MI
B. Ischemia from coronary artery occlusion
results in ST depression (not shown) and
peaked T-waves
C. Infarction from ongoing ischemia results in
marked ST elevation
D/E. Ongoing infarction with appearance of
pathologic Q-waves and T-wave inversion
F. Fibrosis (months later) with persistent Q-
waves, but normal ST segment and T- waves
Here’s a diagram depicting an evolving infarction:
ST Elevation Infarction
Look at the
inferior leads
(II, III, aVF).
Here’s an ECG of an inferior MI:
Question:
What ECG
changes do
you see?
ST elevation
and Q-waves
Extra credit:
What is the
rhythm? Atrial fibrillation (irregularly irregular with narrow QRS)!
ST Elevation Infarction
Now what do
you see in the
inferior leads?
Here’s an ECG of an inferior MI later in time:
ST elevation,
Q-waves and
T-wave
inversion
Non-ST Elevation Infarction
ST depression & T-wave inversion
The ECG changes seen with a non-ST elevation infarction are:
Before injury Normal ECG
ST depression & T-wave inversion
ST returns to baseline, but T-wave
inversion persists
Ischemia
Infarction
Fibrosis
Non-ST Elevation Infarction
Note the ST
depression and
T-wave
inversion in
leads V2-V6.
Here’s an ECG of an evolving non-ST elevation MI:
Question:
What area of
the heart is
infarcting?
Anterolateral
Left Ventricular
Hypertrophy
Left Ventricular Hypertrophy
Compare these two 12-lead ECGs. What stands
out as different with the second one?
Normal Left Ventricular Hypertrophy
Answer: The QRS complexes are very tall
(increased voltage)
Left Ventricular Hypertrophy
Why is left ventricular hypertrophy characterized by tall
QRS complexes?
LVH ECHOcardiogram
Increased QRS voltage
As the heart muscle wall thickens there is an increase in
electrical forces moving through the myocardium resulting
in increased QRS voltage.
Left Ventricular Hypertrophy
Criteria exists to diagnose LVH using a 12-lead ECG.
 For example:
 The R wave in V5 or V6 plus the S wave in V1 or V2 exceeds
35 mm.
• However, for now, all
you need to know is
that the QRS voltage
increases with LVH.
Bundle Branch
Blocks
Bundle Branch Blocks
Turning our attention to bundle branch blocks…
Remember normal
impulse conduction is
SA node 
AV node 
Bundle of His 
Bundle Branches 
Purkinje fibers
Normal Impulse Conduction
Sinoatrial node
AV node
Bundle of His
Bundle Branches
Purkinje fibers
Bundle Branch Blocks
So, depolarization of
the Bundle Branches
and Purkinje fibers are
seen as the QRS
complex on the ECG.
Therefore, a conduction
block of the Bundle
Branches would be
reflected as a change in
the QRS complex.
Right
BBB
Bundle Branch Blocks
With Bundle Branch Blocks you will see two changes
on the ECG.
1. QRS complex widens (> 0.12 sec).
2. QRS morphology changes (varies depending on ECG lead,
and if it is a right vs. left bundle branch block).
Bundle Branch Blocks
Why does the QRS complex widen?
When the conduction
pathway is blocked it
will take longer for
the electrical signal
to pass throughout
the ventricles.
Right Bundle Branch Blocks
What QRS morphology is characteristic?
V1
For RBBB the wide QRS complex assumes a
unique, virtually diagnostic shape in those
leads overlying the right ventricle (V1 and V2).
“Rabbit Ears”
Left Bundle Branch Blocks
What QRS morphology is characteristic?
For LBBB the wide QRS complex assumes a
characteristic change in shape in those leads
opposite the left ventricle (right ventricular
leads - V1 and V2).
Broad,
deep S
waves
Normal
THANKYOU

ECG

  • 1.
  • 2.
    Normal Impulse Conduction Sinoatrialnode AV node Bundle of His Bundle Branches Purkinje fibers
  • 3.
    Impulse Conduction &the ECG Sinoatrial node AV node Bundle of His Bundle Branches Purkinje fibers
  • 4.
    The “PQRST”  Pwave - Atrial depolarization • T wave - Ventricular repolarization • QRS - Ventricular depolarization
  • 5.
    The PR Interval Atrialdepolarization + delay in AV junction (AV node/Bundle of His) (delay allows time for the atria to contract before the ventricles contract)
  • 6.
    Pacemakers of theHeart  SA Node - Dominant pacemaker with an intrinsic rate of 60 - 100 beats/minute.  AV Node - Back-up pacemaker with an intrinsic rate of 40 - 60 beats/minute.  Ventricular cells - Back-up pacemaker with an intrinsic rate of 20 - 45 bpm.
  • 7.
    The ECG Paper Horizontally  One small box - 0.04 s  One large box - 0.20 s  Vertically  One large box - 0.5 mV
  • 8.
    The ECG Paper(cont)  Every 3 seconds (15 large boxes) is marked by a vertical line.  This helps when calculating the heart rate. 3 sec 3 sec
  • 9.
  • 10.
    Rhythm Analysis  Step1: Calculate rate.  Step 2: Determine regularity.  Step 3: Assess the P waves.  Step 4: Determine PR interval.  Step 5: Determine QRS duration.
  • 11.
    Step 1: CalculateRate  Option 1  Count the # of R waves in a 6 second rhythm strip, then multiply by 10.  Reminder: all rhythm strips in the Modules are 6 seconds in length. Interpretation? 9 x 10 = 90 bpm 3 sec 3 sec
  • 12.
    Step 1: CalculateRate  Option 2  Find a R wave that lands on a bold line.  Count the # of large boxes to the next R wave. If the second R wave is 1 large box away the rate is 300, 2 boxes - 150, 3 boxes - 100, 4 boxes - 75, etc. (cont) R wave
  • 13.
    Step 1: CalculateRate  Option 2 (cont)  Memorize the sequence: 300 - 150 - 100 - 75 - 60 - 50 Interpretation? 3 0 0 1 5 0 1 0 0 7 5 6 0 5 0 Approx. 1 box less than 100 = 95 bpm
  • 14.
    Step 2: Determineregularity  Look at the R-R distances (using a caliper or markings on a pen or paper).  Regular (are they equidistant apart)? Occasionally irregular? Regularly irregular? Irregularly irregular? Interpretation? Regular R R
  • 15.
    Step 3: Assessthe P waves  Are there P waves?  Do the P waves all look alike?  Do the P waves occur at a regular rate?  Is there one P wave before each QRS? Interpretation? Normal P waves with 1 P wave for every QRS
  • 16.
    Step 4: DeterminePR interval  Normal: 0.12 - 0.20 seconds. (3 - 5 boxes) Interpretation? 0.12 seconds
  • 17.
    Step 5: QRSduration  Normal: 0.04 - 0.12 seconds. (1 - 3 boxes) Interpretation? 0.08 seconds
  • 18.
    Rhythm Summary  Rate90-95 bpm  Regularity regular  P waves normal  PR interval 0.12 s  QRS duration 0.08 s Interpretation? Normal Sinus Rhythm
  • 19.
  • 20.
    Course Objectives  Torecognize the normal rhythm of the heart - “Normal Sinus Rhythm.”  To recognize the 13 most common rhythm disturbances.  To recognize an acute myocardial infarction on a 12- lead ECG.
  • 21.
    Learning Modules ECG Basics Howto Analyze a Rhythm Normal Sinus Rhythm Heart Arrhythmias Diagnosing a Myocardial Infarction Advanced 12-Lead Interpretation
  • 22.
    Normal Sinus Rhythm(NSR)  Etiology: the electrical impulse is formed in the SA node and conducted normally.  This is the normal rhythm of the heart; other rhythms that do not conduct via the typical pathway are called arrhythmias.
  • 23.
    NSR Parameters  Rate60 - 100 bpm  Regularity regular  P waves normal  PR interval 0.12 - 0.20 s  QRS duration 0.04 - 0.12 s Any deviation from above is sinus tachycardia, sinus bradycardia or an arrhythmia
  • 24.
    Arrhythmia Formation Arrhythmias canarise from problems in the: • Sinus node • Atrial cells • AV junction • Ventricular cells
  • 25.
    SA Node Problems TheSA Node can:  fire too slow  fire too fast Sinus Bradycardia Sinus Tachycardia Sinus Tachycardia may be an appropriate response to stress.
  • 26.
    Atrial Cell Problems Atrialcells can:  fire occasionally from a focus  fire continuously due to a looping re- entrant circuit Premature Atrial Contractions (PACs) Atrial Flutter
  • 27.
    Take a note…. A re-entrant pathway occurs when an impulse loops and results in self- perpetuating impulse formation.
  • 28.
    Atrial Cell Problems Atrialcells can also: • fire continuously from multiple foci or fire continuously due to multiple micro re-entrant “wavelets” Atrial Fibrillation Atrial Fibrillation
  • 29.
    Multiple micro re- entrant“wavelets” refers to wandering small areas of activation which generate fine chaotic impulses. Colliding wavelets can, in turn, generate new foci of activation. Atrial tissue
  • 30.
    AV Junctional Problems TheAV junction can:  fire continuously due to a looping re-entrant circuit  block impulses coming from the SA Node Paroxysmal Supraventricular Tachycardia AV Junctional Blocks
  • 31.
    Ventricular Cell Problems Ventricularcells can:  fire occasionally from 1 or more foci  fire continuously from multiple foci  fire continuously due to a looping re- entrant circuit Premature Ventricular Contractions (PVCs) Ventricular Fibrillation Ventricular Tachycardia
  • 32.
  • 33.
    Arrhythmias Sinus Rhythms Premature Beats SupraventricularArrhythmias Ventricular Arrhythmias AV Junctional Blocks
  • 34.
  • 35.
    Rhythm #1 30 bpm •Rate? • Regularity? regular normal 0.10 s • P waves? • PR interval? 0.12 s • QRS duration? Interpretation? Sinus Bradycardia
  • 36.
  • 37.
    Sinus Bradycardia  Etiology:SA node is depolarizing slower than normal, impulse is conducted normally (i.e. normal PR and QRS interval).
  • 38.
    Rhythm #2 130 bpm •Rate? • Regularity? regular normal 0.08 s • P waves? • PR interval? 0.16 s • QRS duration? Interpretation? Sinus Tachycardia
  • 39.
  • 40.
    Sinus Tachycardia  Etiology:SA node is depolarizing faster than normal, impulse is conducted normally.  Remember: sinus tachycardia is a response to physical or psychological stress, not a primary arrhythmia.
  • 41.
    Premature Beats Premature AtrialContractions (PACs) Premature Ventricular Contractions (PVCs)
  • 42.
    Rhythm #3 70 bpm •Rate? • Regularity? occasionally irreg. 2/7 different contour 0.08 s • P waves? • PR interval? 0.14 s (except 2/7) • QRS duration? Interpretation? NSR with Premature Atrial Contractions
  • 43.
    Premature Atrial Contractions Deviation fromNSR These ectopic beats originate in the atria (but not in the SA node), therefore the contour of the P wave, the PR interval, and the timing are different than a normally generated pulse from the SA node.
  • 44.
    Premature Atrial Contractions  Etiology:Excitation of an atrial cell forms an impulse that is then conducted normally through the AV node and ventricles.
  • 45.
     When animpulse originates anywhere in the atria (SA node, atrial cells, AV node, Bundle of His) and then is conducted normally through the ventricles, the QRS will be narrow (0.04 - 0.12 s).
  • 46.
    Rhythm #4 60 bpm •Rate? • Regularity? occasionally irreg. none for 7th QRS 0.08 s (7th wide) • P waves? • PR interval? 0.14 s • QRS duration? Interpretation? Sinus Rhythm with 1 PVC
  • 47.
    PVCs  Deviation fromNSR  Ectopic beats originate in the ventricles resulting in wide and bizarre QRS complexes.  When there are more than 1 premature beats and look alike, they are called “uniform”. When they look different, they are called “multiform”.
  • 48.
    PVCs  Etiology: Oneor more ventricular cells are depolarizing and the impulses are abnormally conducting through the ventricles.
  • 49.
     When animpulse originates in a ventricle, conduction through the ventricles will be inefficient and the QRS will be wide and bizarre.
  • 50.
    Ventricular Conduction Normal Signal movesrapidly through the ventricles Abnormal Signal moves slowly through the ventricles
  • 51.
  • 52.
    Diagnosing a MI Todiagnose a myocardial infarction you need to go beyond looking at a rhythm strip and obtain a 12-Lead ECG. Rhythm Strip 12-Lead ECG
  • 53.
    The 12-Lead ECG The12-Lead ECG sees the heart from 12 different views. Therefore, the 12-Lead ECG helps you see what is happening in different portions of the heart. The rhythm strip is only 1 of these 12 views.
  • 54.
    The 12-Leads The 12-leadsinclude: –3 Limb leads (I, II, III) –3 Augmented leads (aVR, aVL, aVF) –6 Precordial leads (V1- V6)
  • 55.
    Views of theHeart Some leads get a good view of the: Anterior portion of the heart Lateral portion of the heart Inferior portion of the heart
  • 56.
    ST Elevation One wayto diagnose an acute MI is to look for elevation of the ST segment.
  • 57.
    ST Elevation (cont) Elevationof the ST segment (greater than 1 small box) in 2 leads is consistent with a myocardial infarction.
  • 58.
    Anterior View ofthe Heart The anterior portion of the heart is best viewed using leads V1- V4.
  • 59.
    Anterior Myocardial Infarction If yousee changes in leads V1 - V4 that are consistent with a myocardial infarction, you can conclude that it is an anterior wall myocardial infarction.
  • 60.
    Putting it allTogether Do you think this person is having a myocardial infarction. If so, where?
  • 61.
    Interpretation Yes, this personis having an acute anterior wall myocardial infarction.
  • 62.
    Other MI Locations Nowthat you know where to look for an anterior wall myocardial infarction let’s look at how you would determine if the MI involves the lateral wall or the inferior wall of the heart.
  • 63.
    Other MI Locations First,take a look again at this picture of the heart. Anterior portion of the heart Lateral portion of the heart Inferior portion of the heart
  • 64.
    Other MI Locations Second,remember that the 12-leads of the ECG look at different portions of the heart. The limb and augmented leads “see” electrical activity moving inferiorly (II, III and aVF), to the left (I, aVL) and to the right (aVR). Whereas, the precordial leads “see” electrical activity in the posterior to anterior direction. Limb Leads Augmented Leads Precordial Leads
  • 65.
    Other MI Locations Now,using these 3 diagrams let’s figure where to look for a lateral wall and inferior wall MI. Limb Leads Augmented Leads Precordial Leads
  • 66.
    Anterior MI Remember theanterior portion of the heart is best viewed using leads V1- V4. Limb Leads Augmented Leads Precordial Leads
  • 67.
    Lateral MI So whatleads do you think the lateral portion of the heart is best viewed? Limb Leads Augmented Leads Precordial Leads Leads I, aVL, and V5- V6
  • 68.
    Inferior MI Now howabout the inferior portion of the heart? Limb Leads Augmented Leads Precordial Leads Leads II, III and aVF
  • 69.
    Putting it allTogether Now, where do you think this person is having a myocardial infarction?
  • 70.
    Inferior Wall MI Thisis an inferior MI. Note the ST elevation in leads II, III and aVF.
  • 71.
    Putting it allTogether How about now?
  • 72.
    Anterolateral MI This person’sMI involves both the anterior wall (V2-V4) and the lateral wall (V5-V6, I, and aVL)!
  • 73.
  • 74.
    The 12-Lead ECG The12-Lead ECG contains a wealth of information. In previous slides you learned that ST segment elevation in two leads is suggestive of an acute myocardial infarction. In this module we will cover: ST Elevation and non-ST Elevation MIs Left Ventricular Hypertrophy Bundle Branch Blocks
  • 75.
  • 76.
    ST Elevation andnon-ST Elevation MIs  When myocardial blood supply is abruptly reduced or cut off to a region of the heart, a sequence of injurious events occur beginning with ischemia (inadequate tissue perfusion), followed by necrosis (infarction), and eventual fibrosis (scarring) if the blood supply isn't restored in an appropriate period of time.  The ECG changes over time with each of these events…
  • 77.
    ECG Changes Ways theECG can change include: Appearance of pathologic Q-waves T-waves peaked flattened inverted ST elevation & depression
  • 78.
    ECG Changes &the Evolving MI There are two distinct patterns of ECG change depending if the infarction is: –ST Elevation (Transmural or Q-wave), or –Non-ST Elevation (Subendocardial or non-Q-wave) Non-ST Elevation ST Elevation
  • 79.
    ST Elevation Infarction STdepression, peaked T-waves, then T-wave inversion The ECG changes seen with a ST elevation infarction are: Before injury Normal ECG ST elevation & appearance of Q-waves ST segments and T-waves return to normal, but Q-waves persist Ischemia Infarction Fibrosis
  • 80.
    ST Elevation Infarction A.Normal ECG prior to MI B. Ischemia from coronary artery occlusion results in ST depression (not shown) and peaked T-waves C. Infarction from ongoing ischemia results in marked ST elevation D/E. Ongoing infarction with appearance of pathologic Q-waves and T-wave inversion F. Fibrosis (months later) with persistent Q- waves, but normal ST segment and T- waves Here’s a diagram depicting an evolving infarction:
  • 81.
    ST Elevation Infarction Lookat the inferior leads (II, III, aVF). Here’s an ECG of an inferior MI: Question: What ECG changes do you see? ST elevation and Q-waves Extra credit: What is the rhythm? Atrial fibrillation (irregularly irregular with narrow QRS)!
  • 82.
    ST Elevation Infarction Nowwhat do you see in the inferior leads? Here’s an ECG of an inferior MI later in time: ST elevation, Q-waves and T-wave inversion
  • 83.
    Non-ST Elevation Infarction STdepression & T-wave inversion The ECG changes seen with a non-ST elevation infarction are: Before injury Normal ECG ST depression & T-wave inversion ST returns to baseline, but T-wave inversion persists Ischemia Infarction Fibrosis
  • 84.
    Non-ST Elevation Infarction Notethe ST depression and T-wave inversion in leads V2-V6. Here’s an ECG of an evolving non-ST elevation MI: Question: What area of the heart is infarcting? Anterolateral
  • 85.
  • 86.
    Left Ventricular Hypertrophy Comparethese two 12-lead ECGs. What stands out as different with the second one? Normal Left Ventricular Hypertrophy Answer: The QRS complexes are very tall (increased voltage)
  • 87.
    Left Ventricular Hypertrophy Whyis left ventricular hypertrophy characterized by tall QRS complexes? LVH ECHOcardiogram Increased QRS voltage As the heart muscle wall thickens there is an increase in electrical forces moving through the myocardium resulting in increased QRS voltage.
  • 88.
    Left Ventricular Hypertrophy Criteriaexists to diagnose LVH using a 12-lead ECG.  For example:  The R wave in V5 or V6 plus the S wave in V1 or V2 exceeds 35 mm. • However, for now, all you need to know is that the QRS voltage increases with LVH.
  • 89.
  • 90.
    Bundle Branch Blocks Turningour attention to bundle branch blocks… Remember normal impulse conduction is SA node  AV node  Bundle of His  Bundle Branches  Purkinje fibers
  • 91.
    Normal Impulse Conduction Sinoatrialnode AV node Bundle of His Bundle Branches Purkinje fibers
  • 92.
    Bundle Branch Blocks So,depolarization of the Bundle Branches and Purkinje fibers are seen as the QRS complex on the ECG. Therefore, a conduction block of the Bundle Branches would be reflected as a change in the QRS complex. Right BBB
  • 93.
    Bundle Branch Blocks WithBundle Branch Blocks you will see two changes on the ECG. 1. QRS complex widens (> 0.12 sec). 2. QRS morphology changes (varies depending on ECG lead, and if it is a right vs. left bundle branch block).
  • 94.
    Bundle Branch Blocks Whydoes the QRS complex widen? When the conduction pathway is blocked it will take longer for the electrical signal to pass throughout the ventricles.
  • 95.
    Right Bundle BranchBlocks What QRS morphology is characteristic? V1 For RBBB the wide QRS complex assumes a unique, virtually diagnostic shape in those leads overlying the right ventricle (V1 and V2). “Rabbit Ears”
  • 96.
    Left Bundle BranchBlocks What QRS morphology is characteristic? For LBBB the wide QRS complex assumes a characteristic change in shape in those leads opposite the left ventricle (right ventricular leads - V1 and V2). Broad, deep S waves Normal
  • 97.