Downloaded 21 times
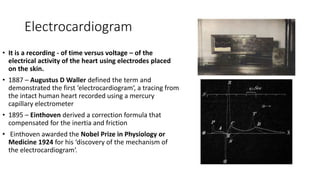
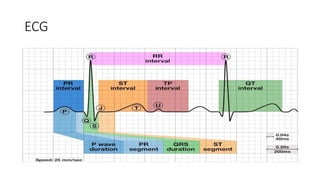
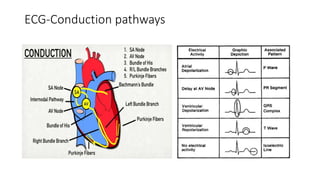
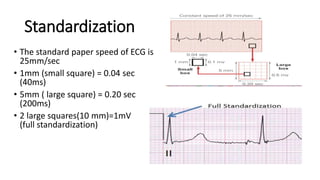
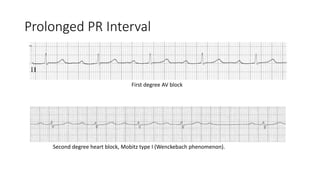

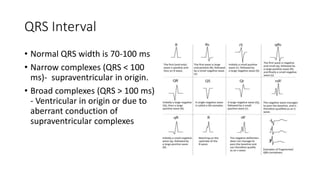
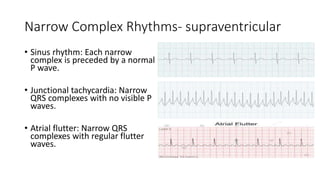
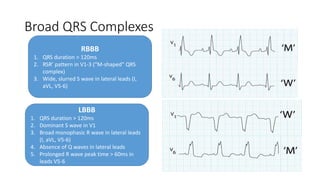

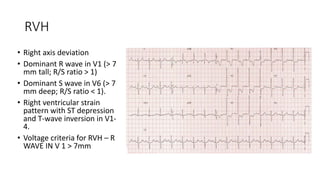
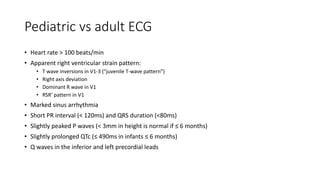


This document provides an overview of basics of ECG interpretation. It discusses the history and development of ECG, conduction pathways, standardization, waves and intervals including P wave, PR interval, QRS complex, QT interval, axis determination, and abnormalities indicative of conditions like LVH and RVH. Pediatric ECG variations from adult ECG are also summarized. The document is intended as an educational guide on ECG interpretation for medical professionals.


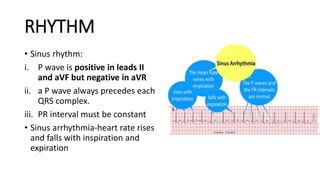
![CTEV [ clubfoot] DR ARUN LAL ,DR MOHAMED ASHRAF travancore medical college k...](https://cdn.slidesharecdn.com/ss_thumbnails/ctevclubfootdrarunlaldrmohamedashraftravancoremedicalcollegekollamkeralaindia-260208063247-18fc466c-thumbnail.jpg?width=640&height=640&fit=bounds)


![ONFH[AVN HIP] -TRIPLE REGIME -A NOVAL SURGICAL CONCEPT .pptx](https://cdn.slidesharecdn.com/ss_thumbnails/onfhavnhip2026koaconcalicutdrgokuldevdrmashraf-260210064517-213ec005-thumbnail.jpg?width=640&height=640&fit=bounds)