Downloaded 158 times
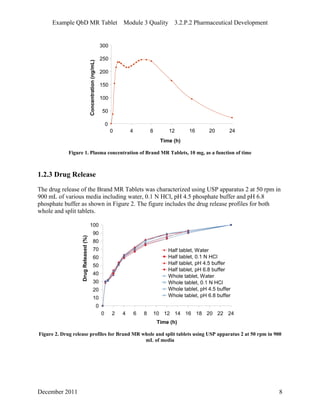
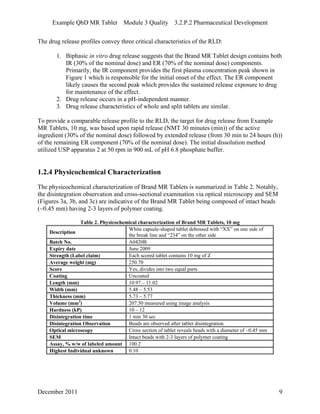
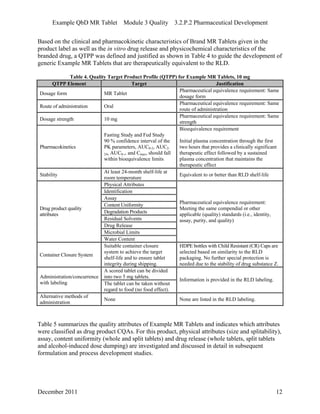
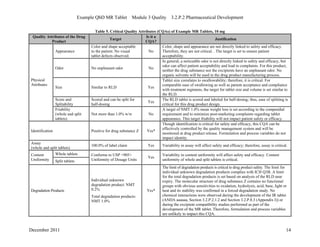
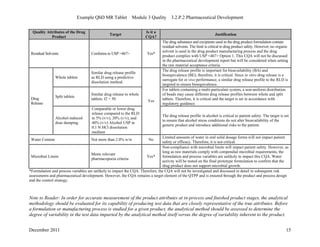
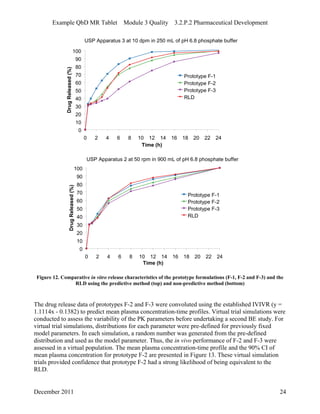
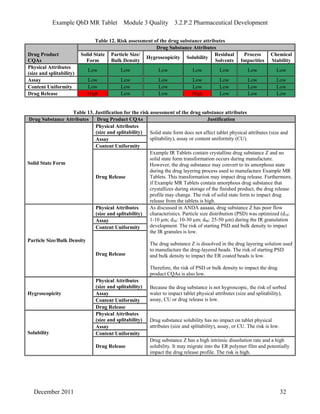
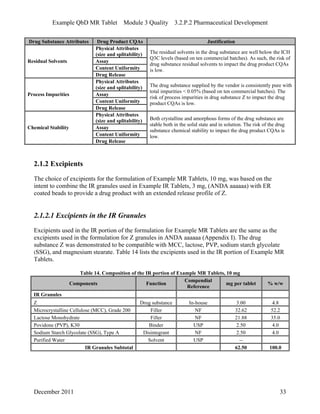
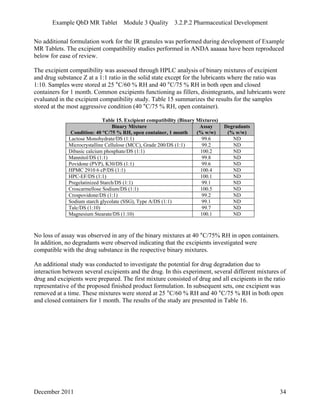
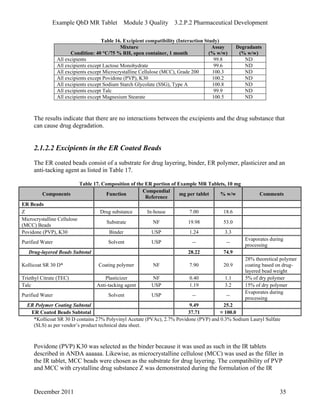
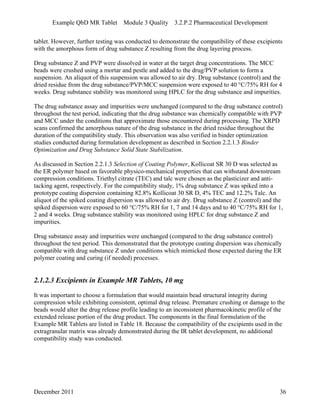
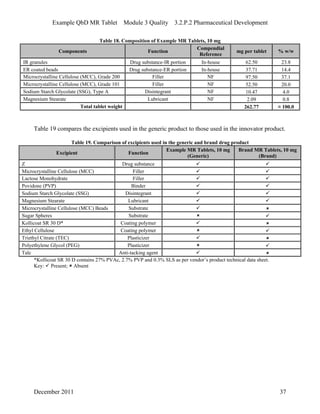
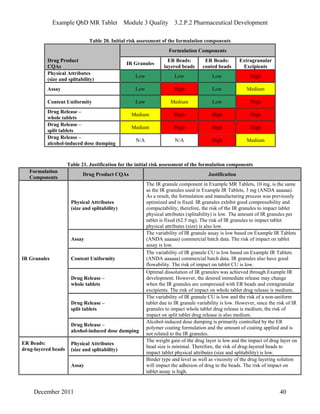
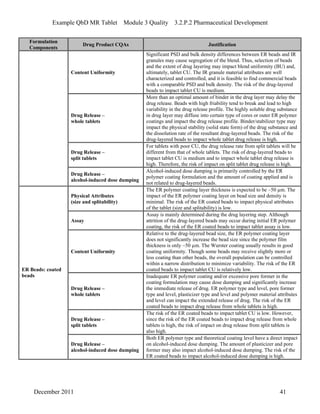
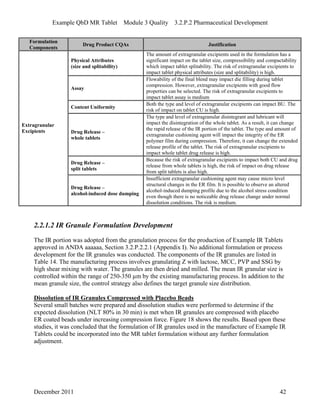
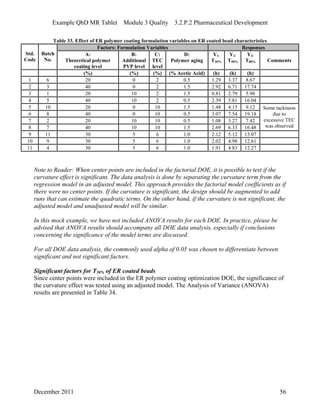
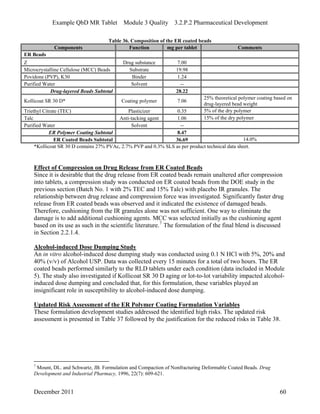

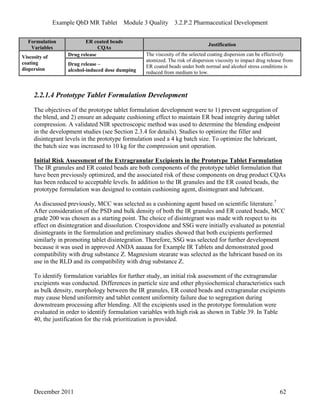
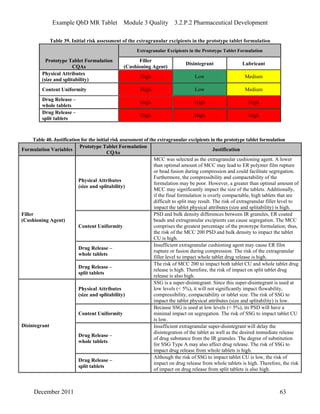
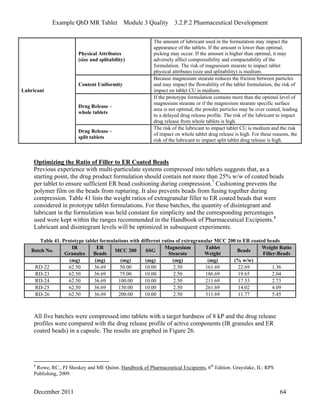
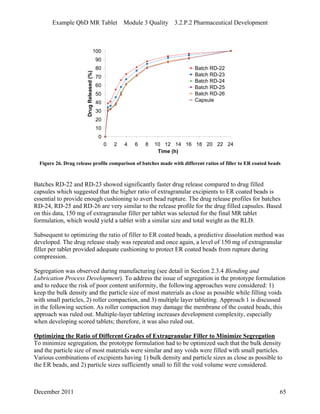
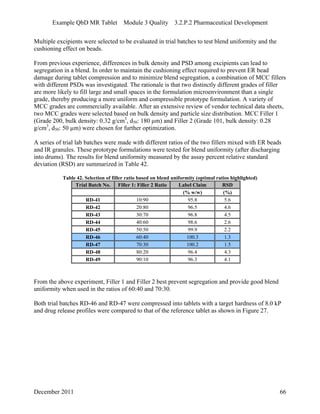
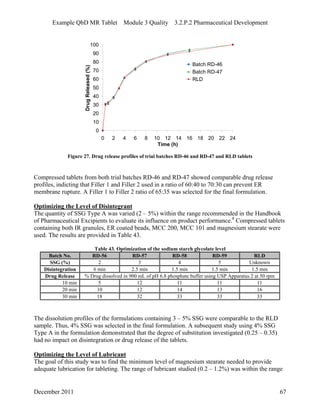
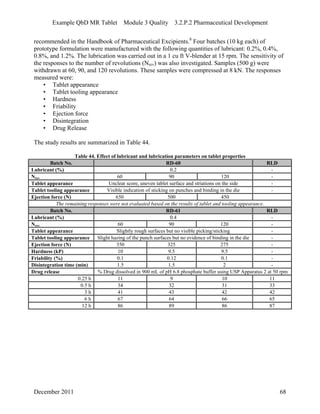
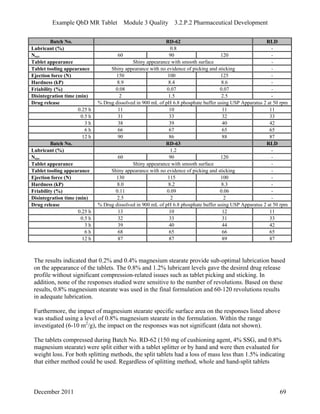
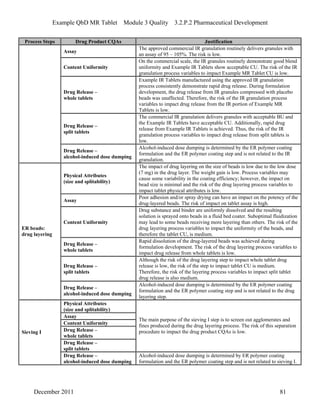
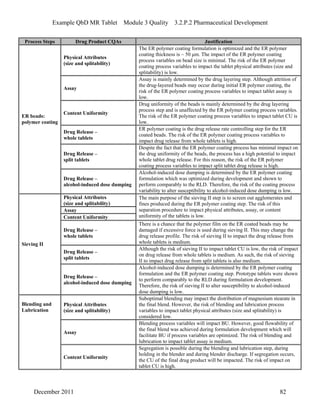
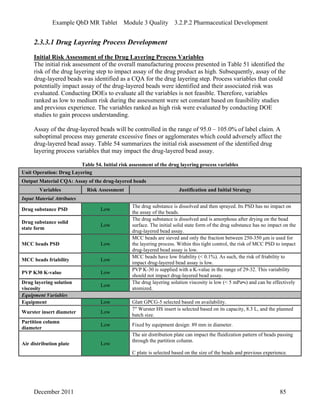
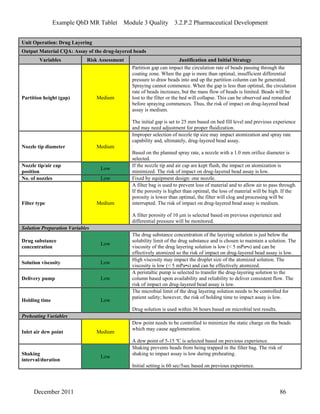
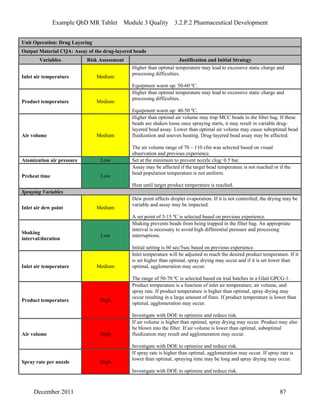
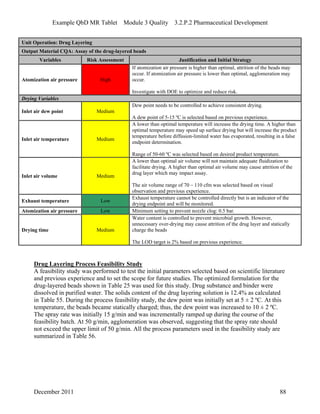
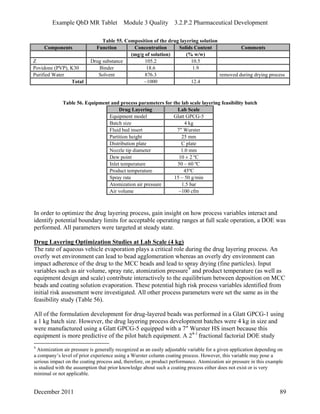
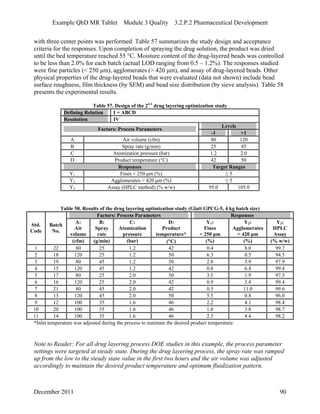
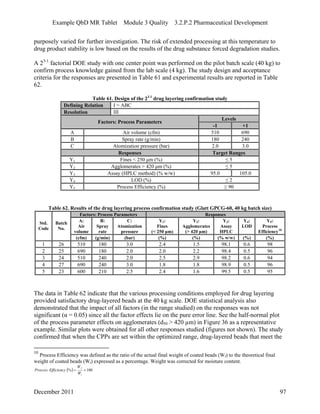
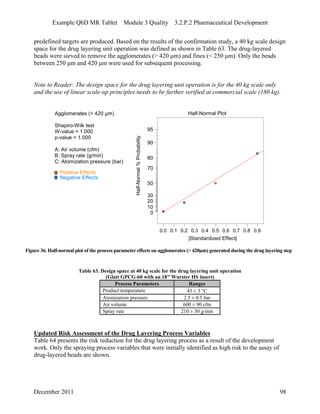
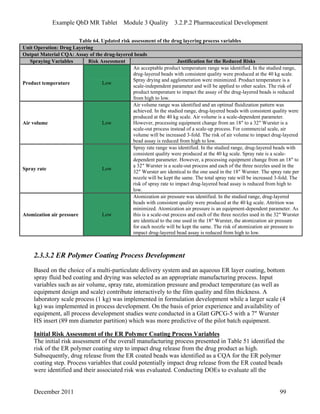
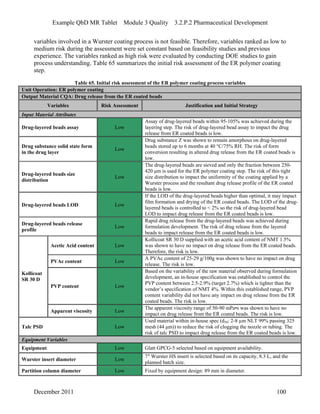
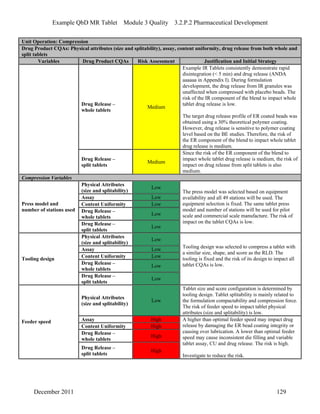
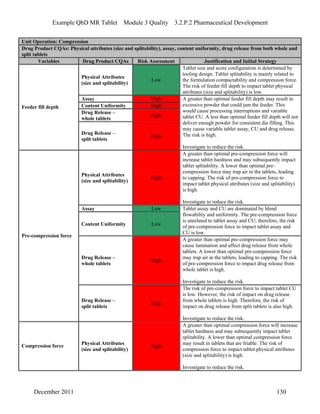
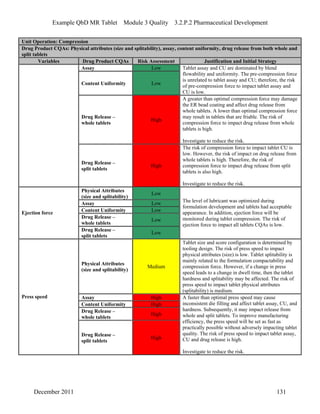
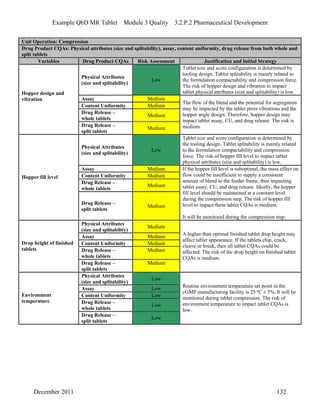
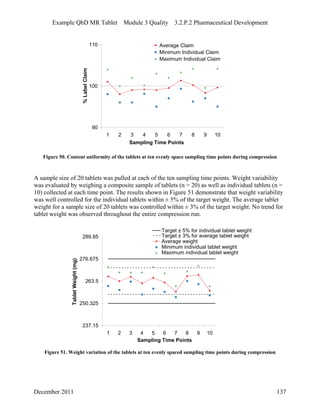
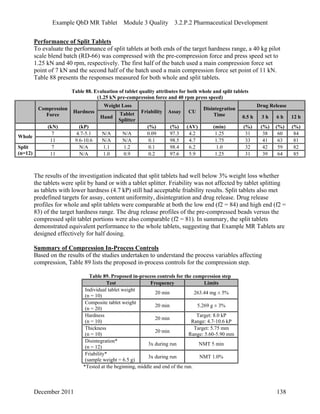
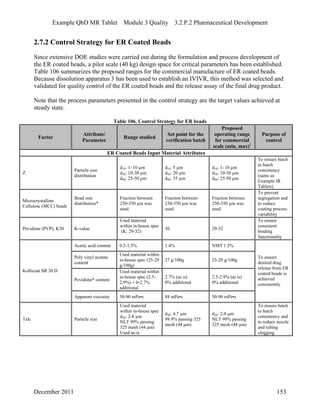
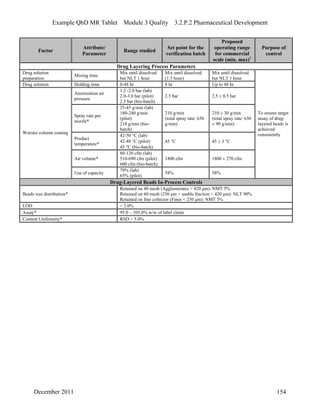
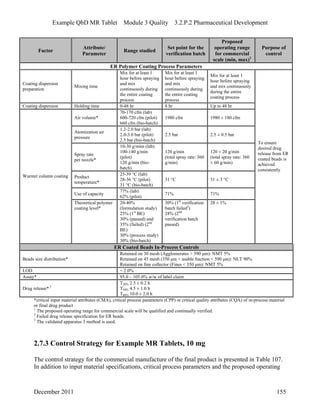
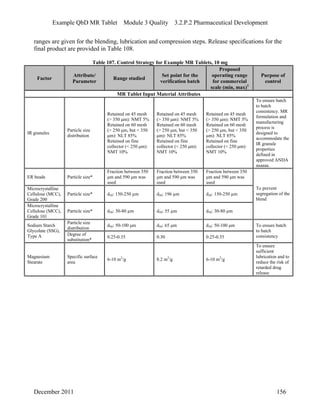
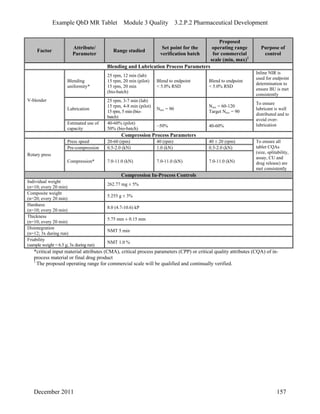
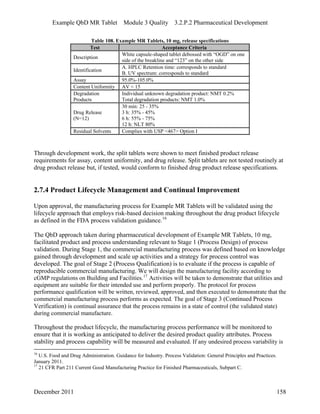

This pharmaceutical development report describes the development of a generic modified release tablet to match the reference listed drug. A quality target product profile was established based on the properties of the active drug substance and reference listed drug characteristics. Critical quality attributes were identified, including physical attributes, assay, content uniformity and drug release. The generic tablet was designed to contain immediate release granules and extended release polymer-coated beads compressed into scored tablets. Formulation and manufacturing processes were optimized using a quality by design approach and design of experiments to ensure matching of the critical quality attributes of the reference listed drug.


![cmc [ chemistry manufacturing control ]](https://cdn.slidesharecdn.com/ss_thumbnails/presentation2222ra-181120122336-thumbnail.jpg?width=640&height=640&fit=bounds)


![New Drug Application [NDA]](https://cdn.slidesharecdn.com/ss_thumbnails/newdrugapplicationnda-160619063242-thumbnail.jpg?width=640&height=640&fit=bounds)


