Download as PPSX, PPTX


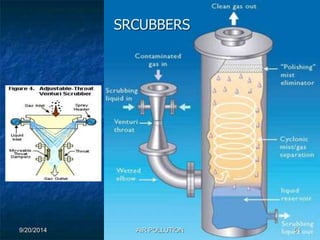


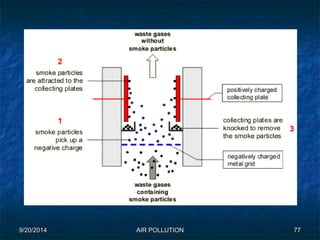


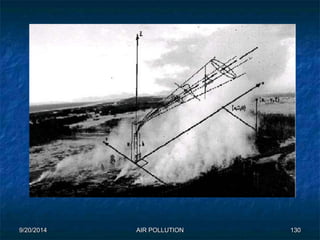


The document discusses air pollution, including its sources, effects, and methods of control and remediation. It provides details on the composition of the atmosphere and criteria air pollutants. Major sources of air pollution are described as natural (such as volcanoes) and anthropogenic (such as fuel combustion). Air pollutants can be in gaseous or particulate form. Methods for reducing air pollution include the use of emission control devices like catalytic converters, scrubbers, and electrostatic precipitators. Air pollution has negative effects on both the environment and human health.


