Download as PDF, PPTX
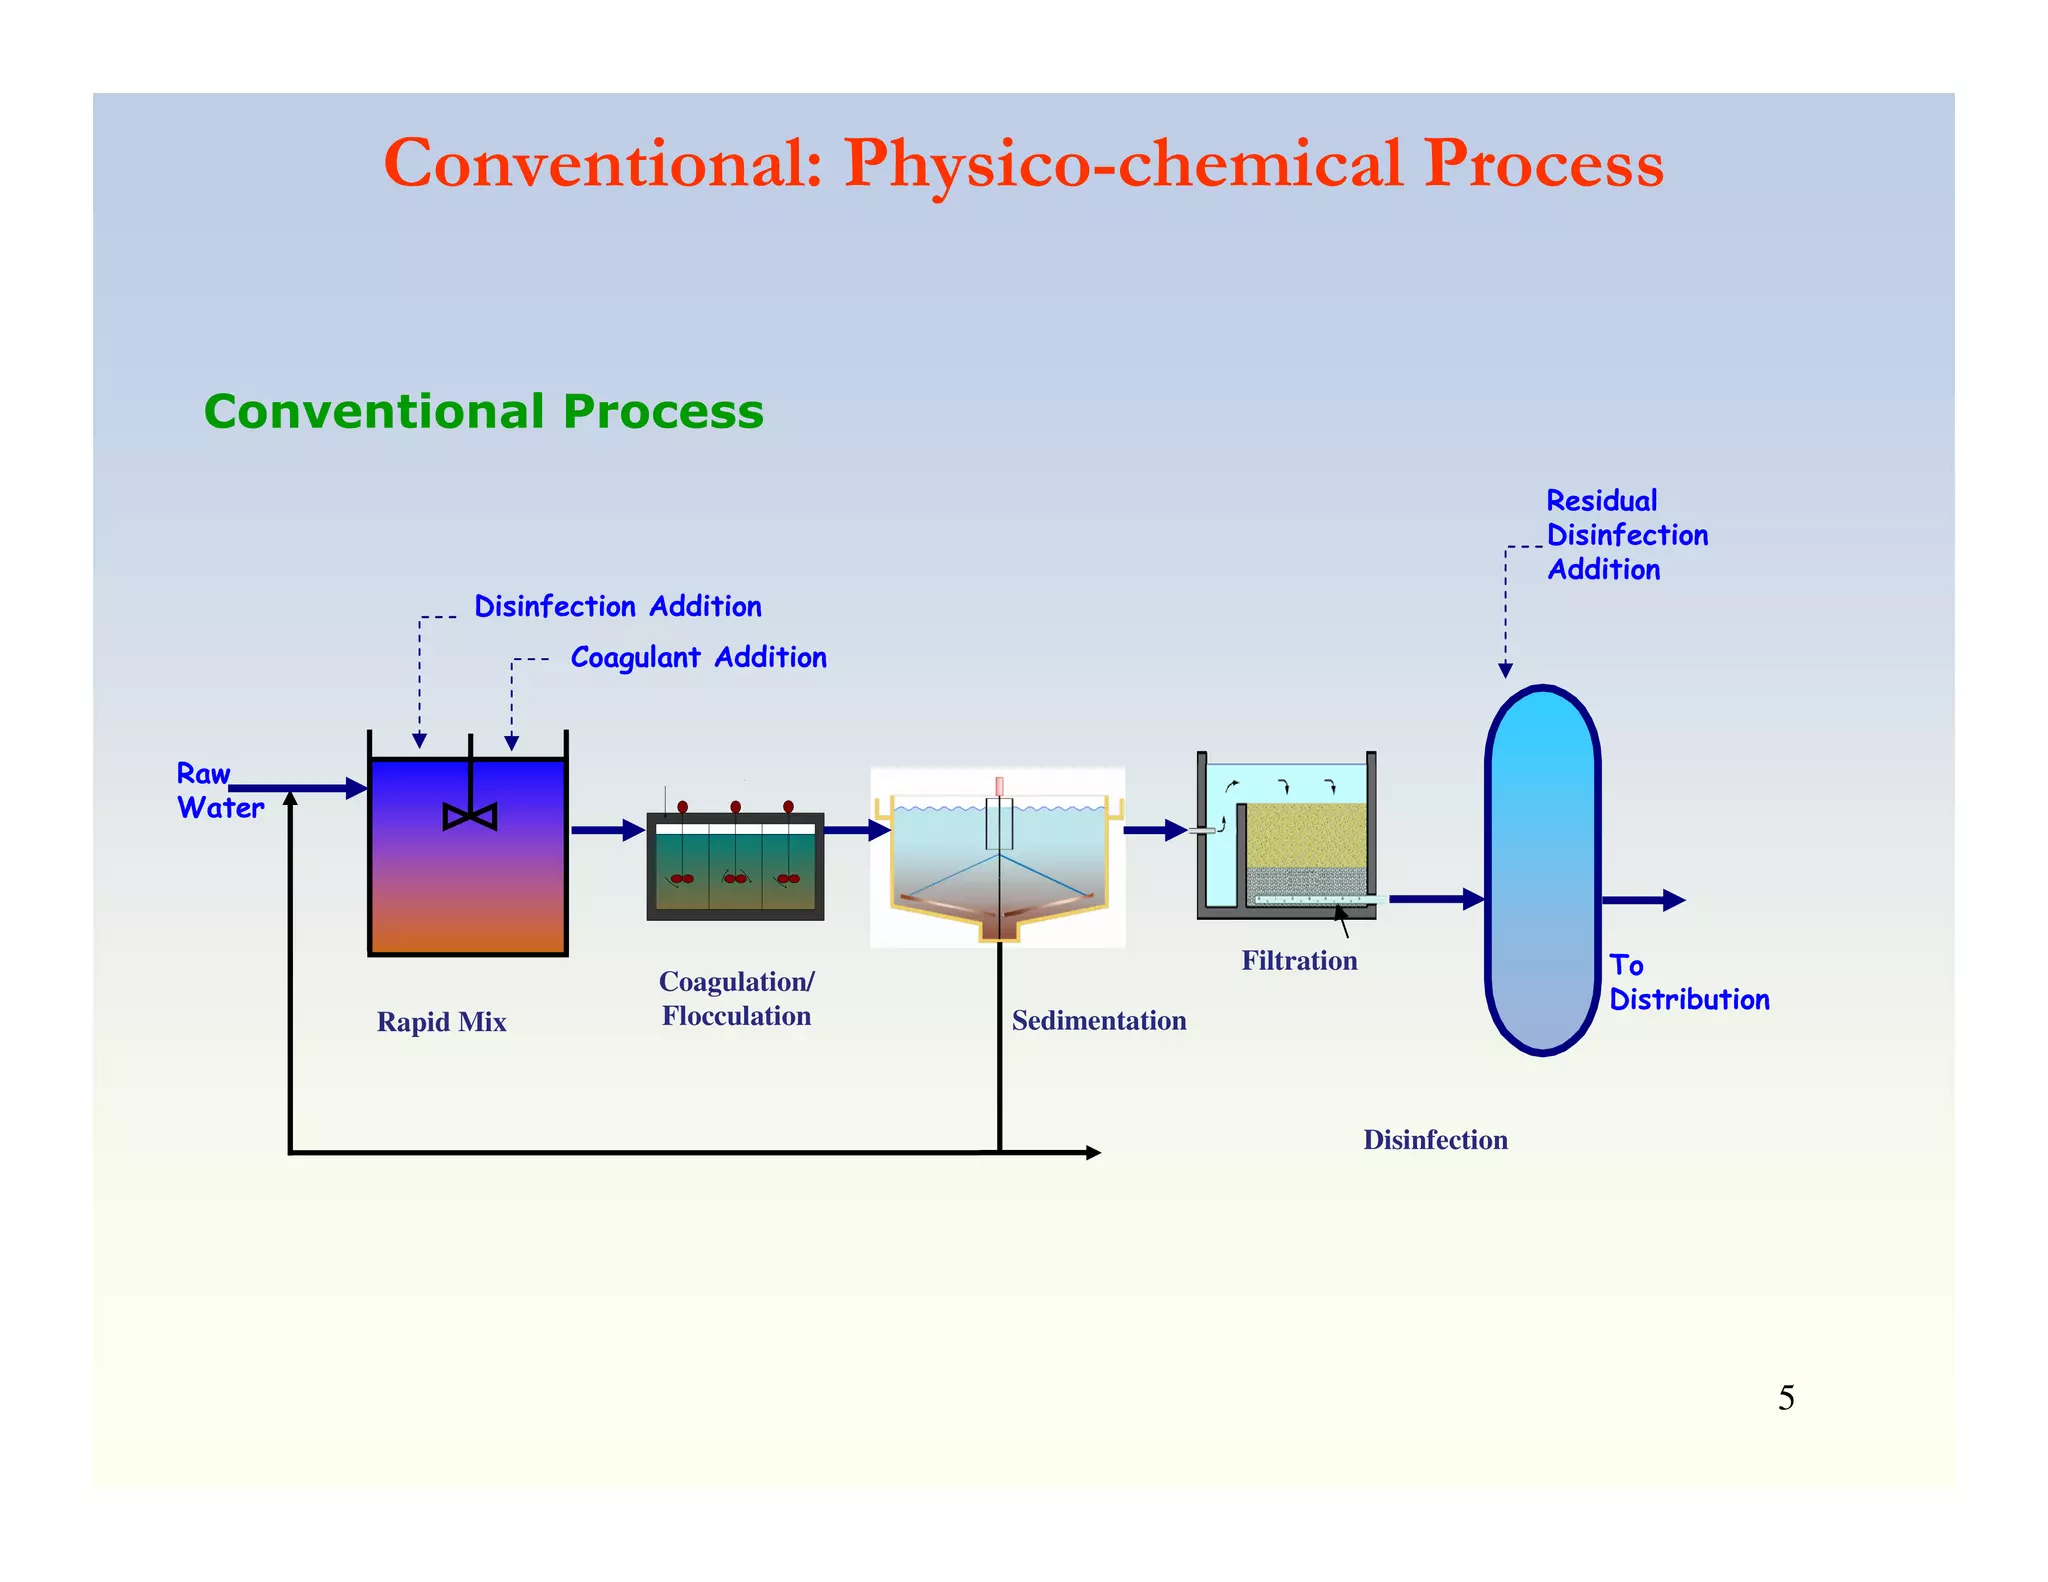
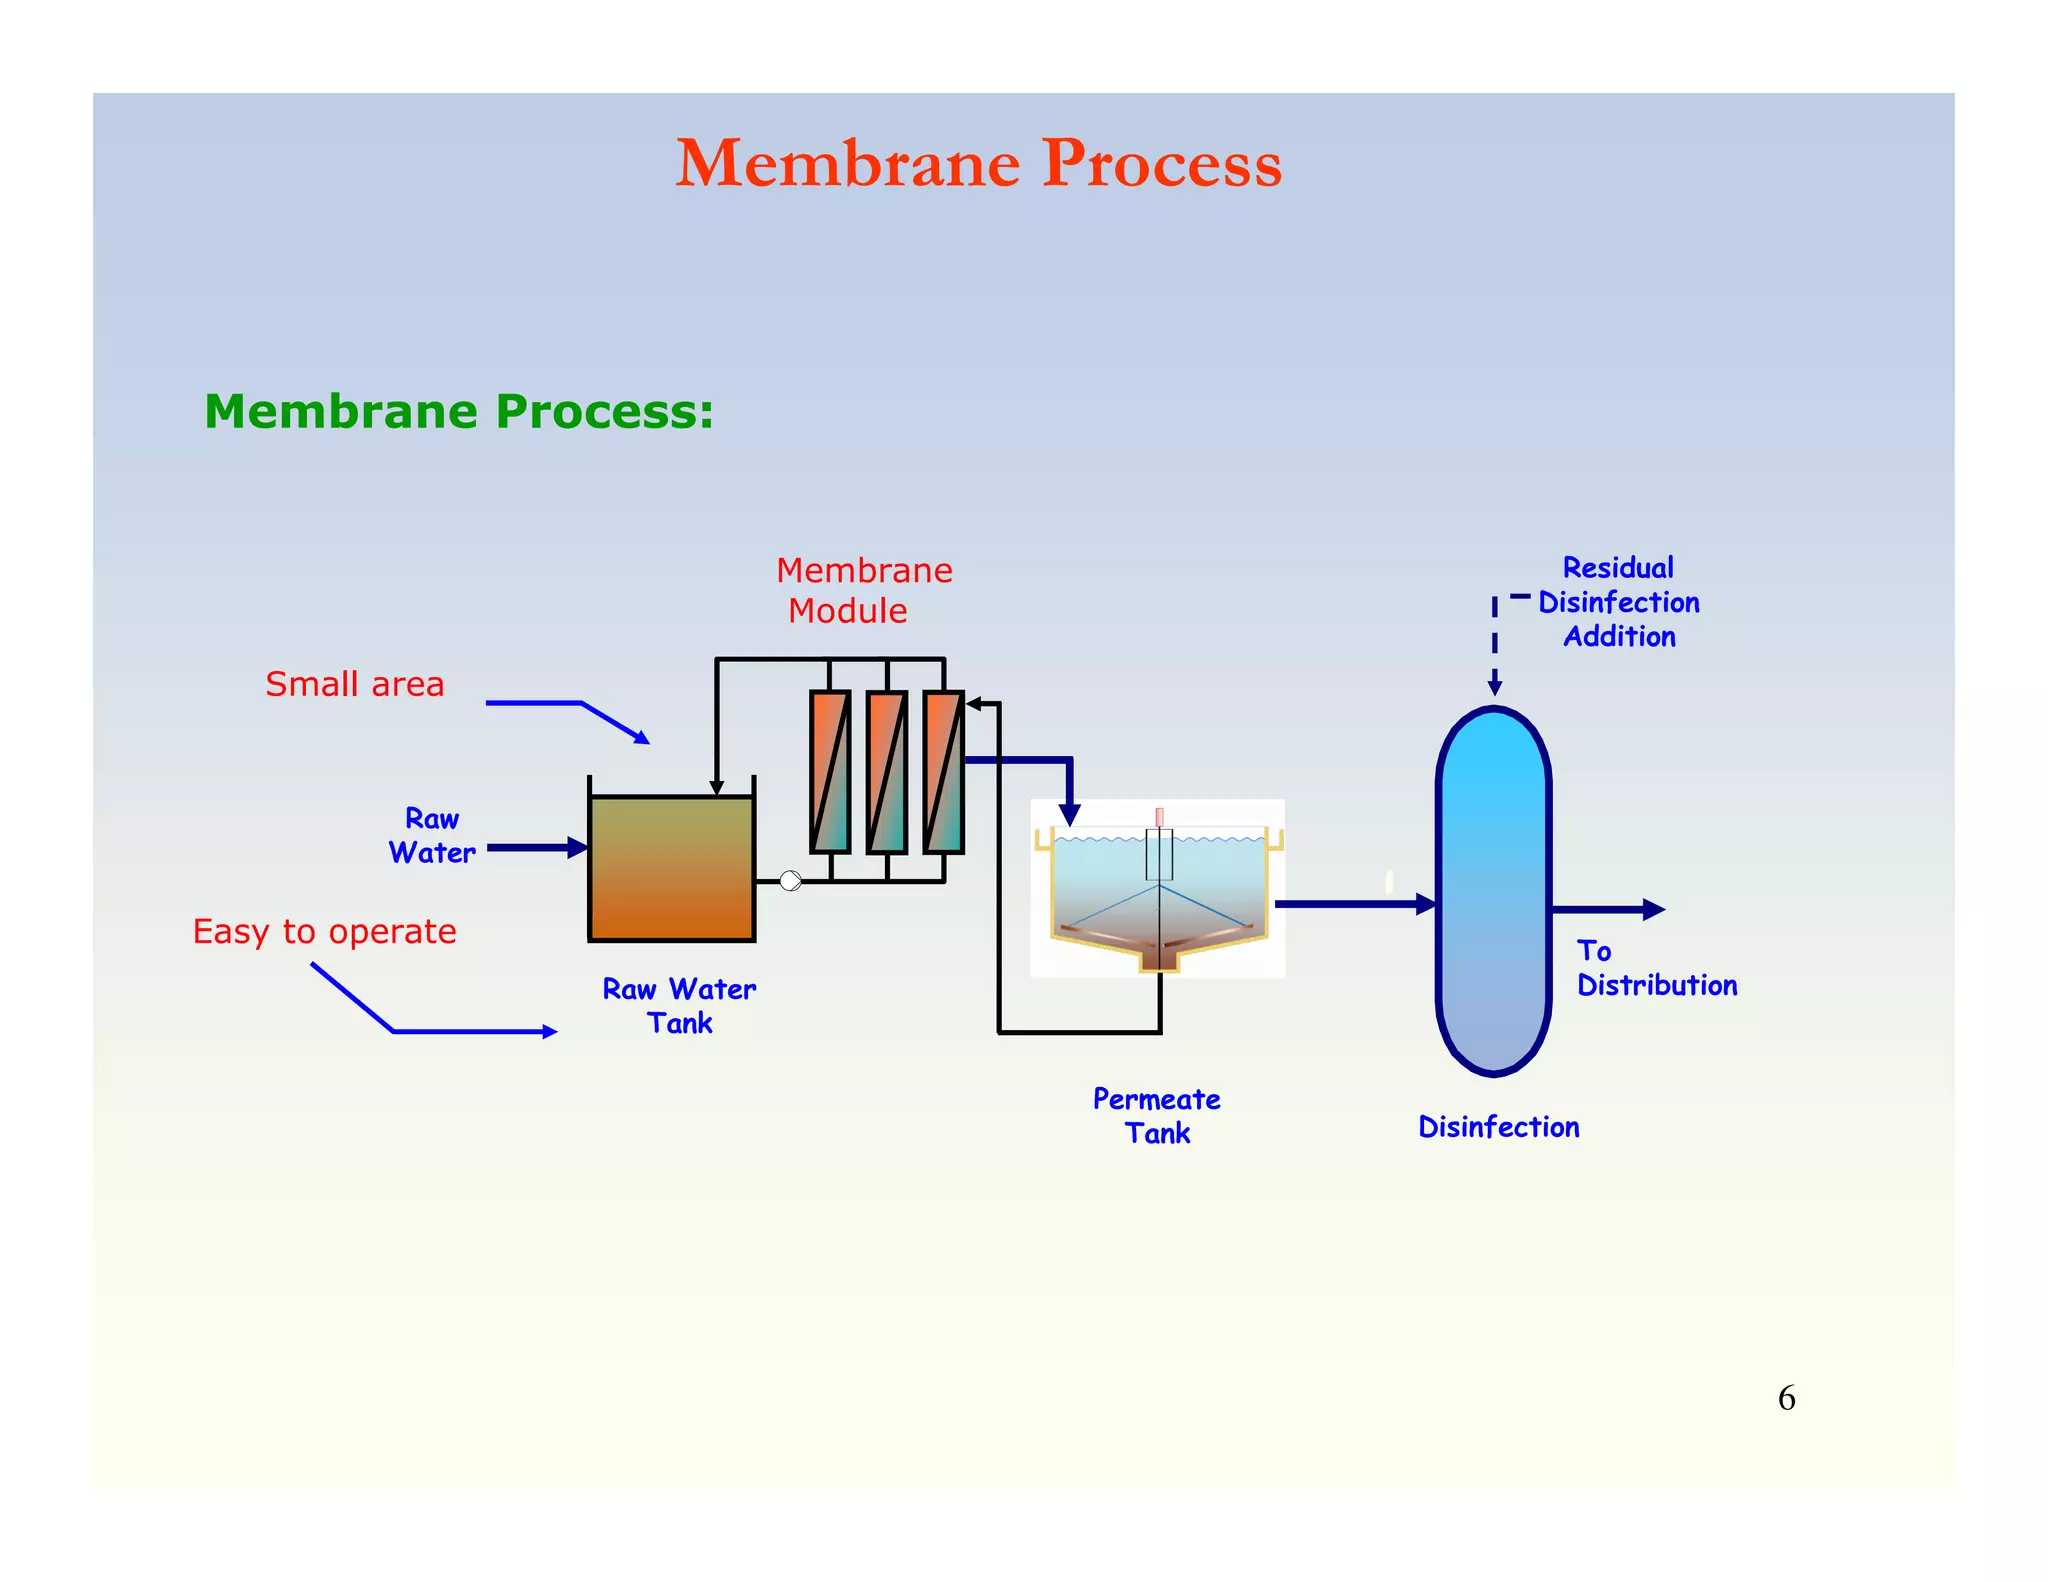
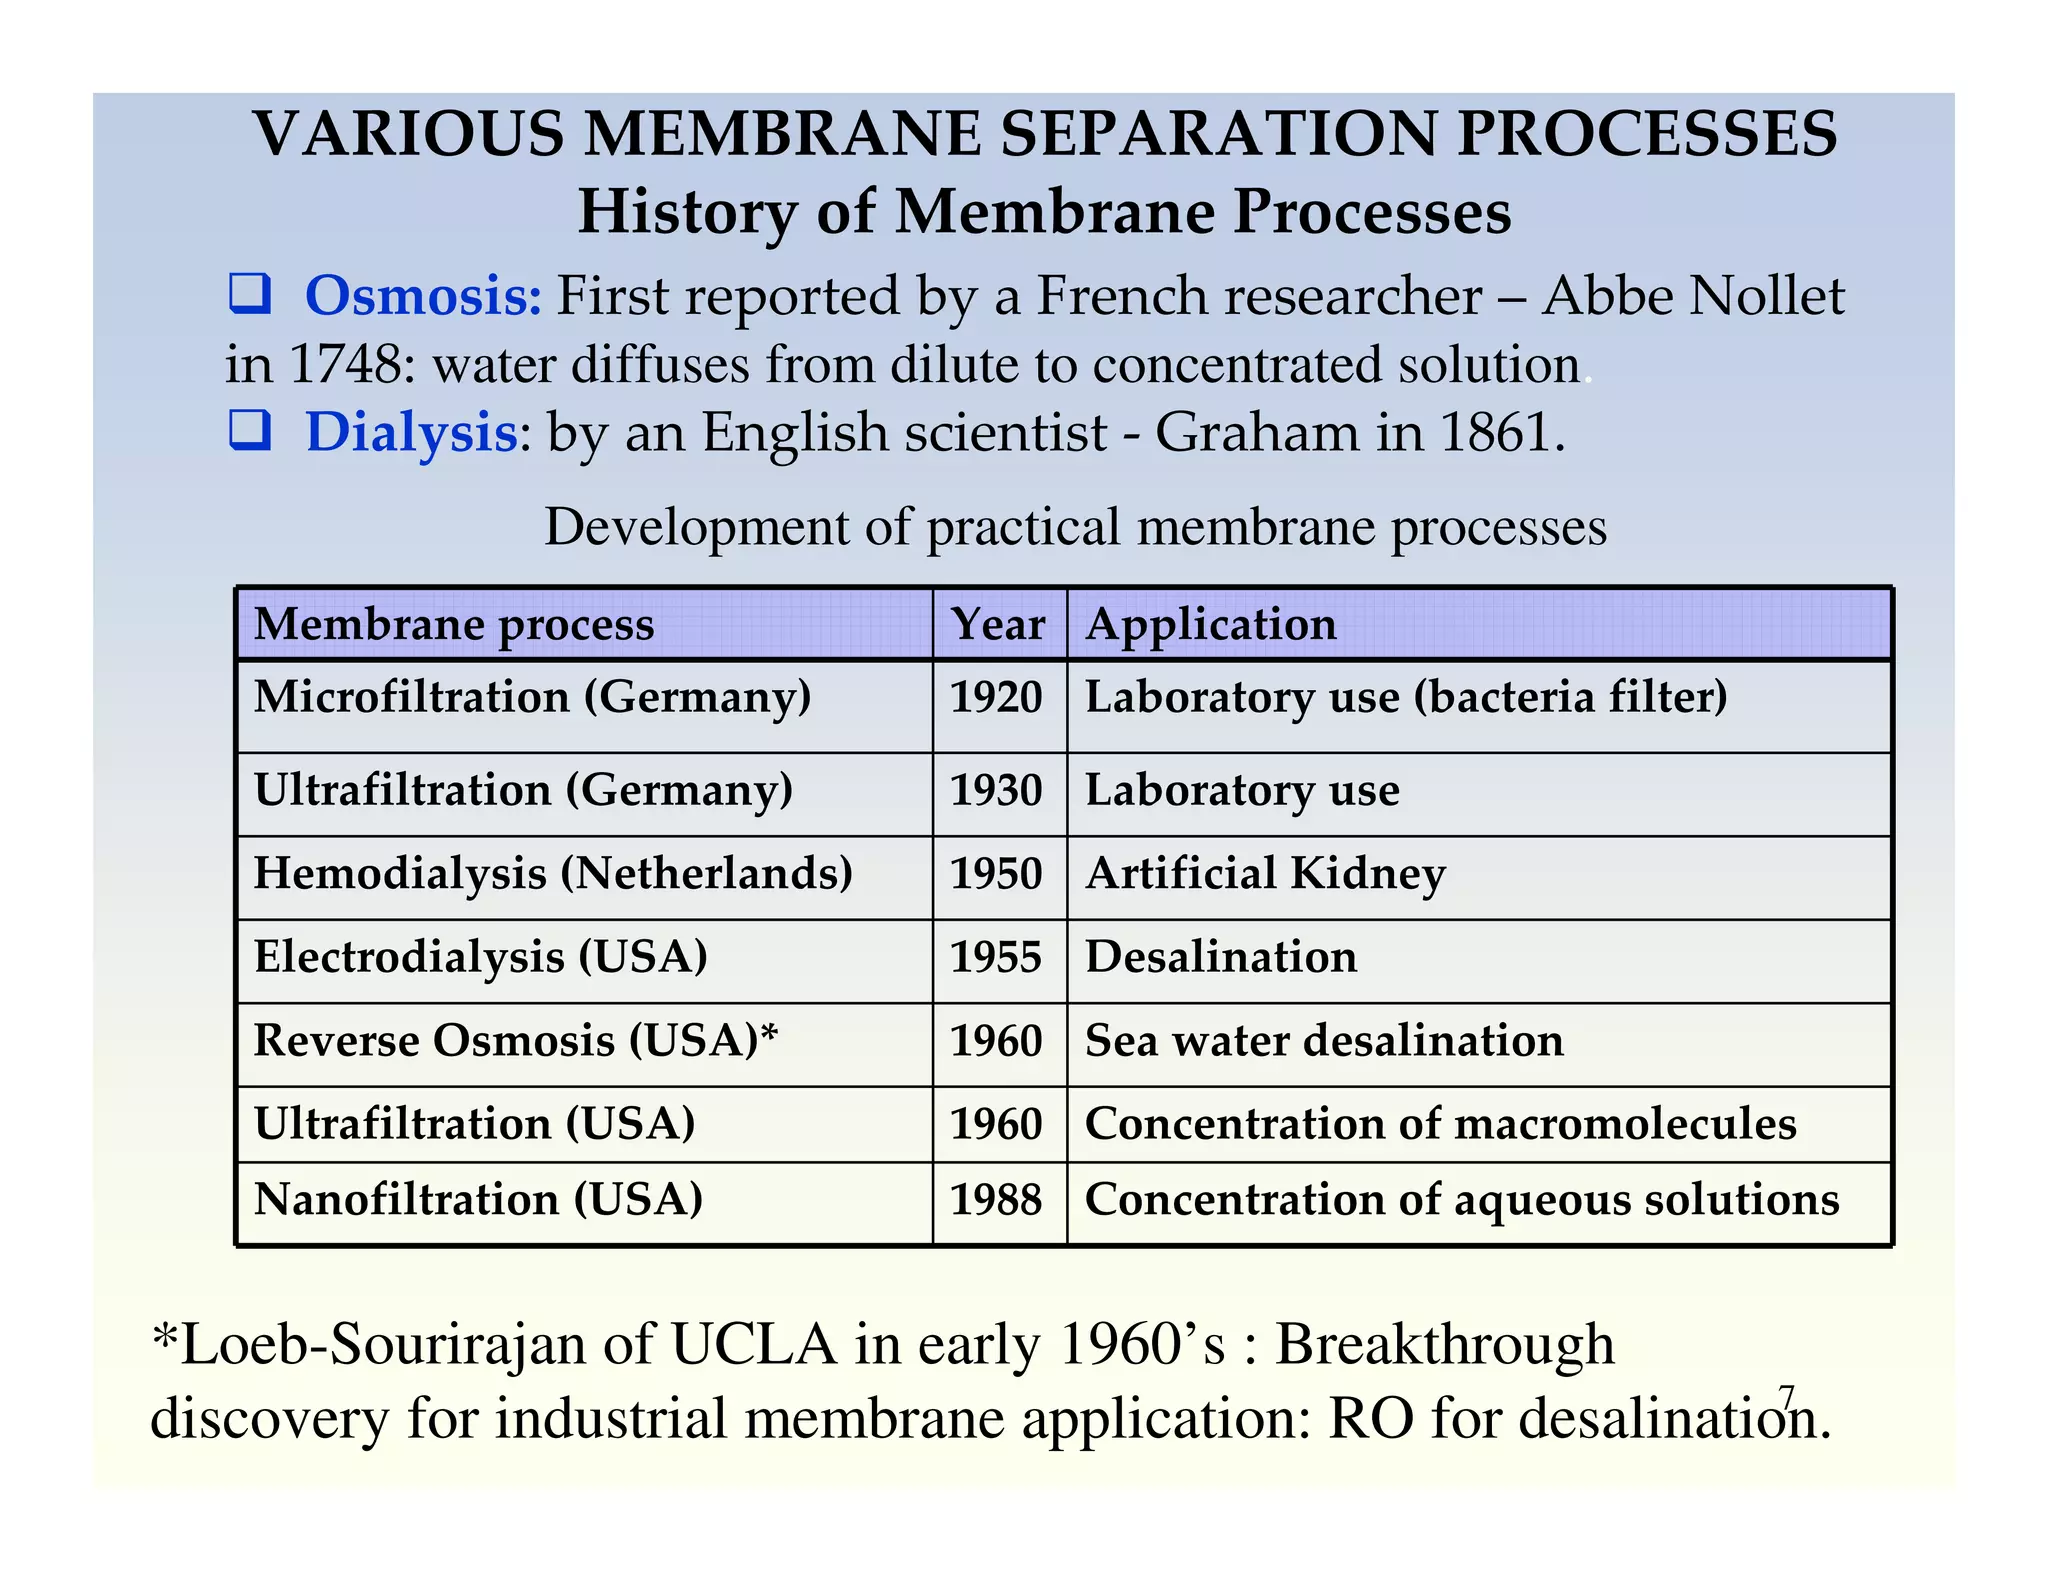
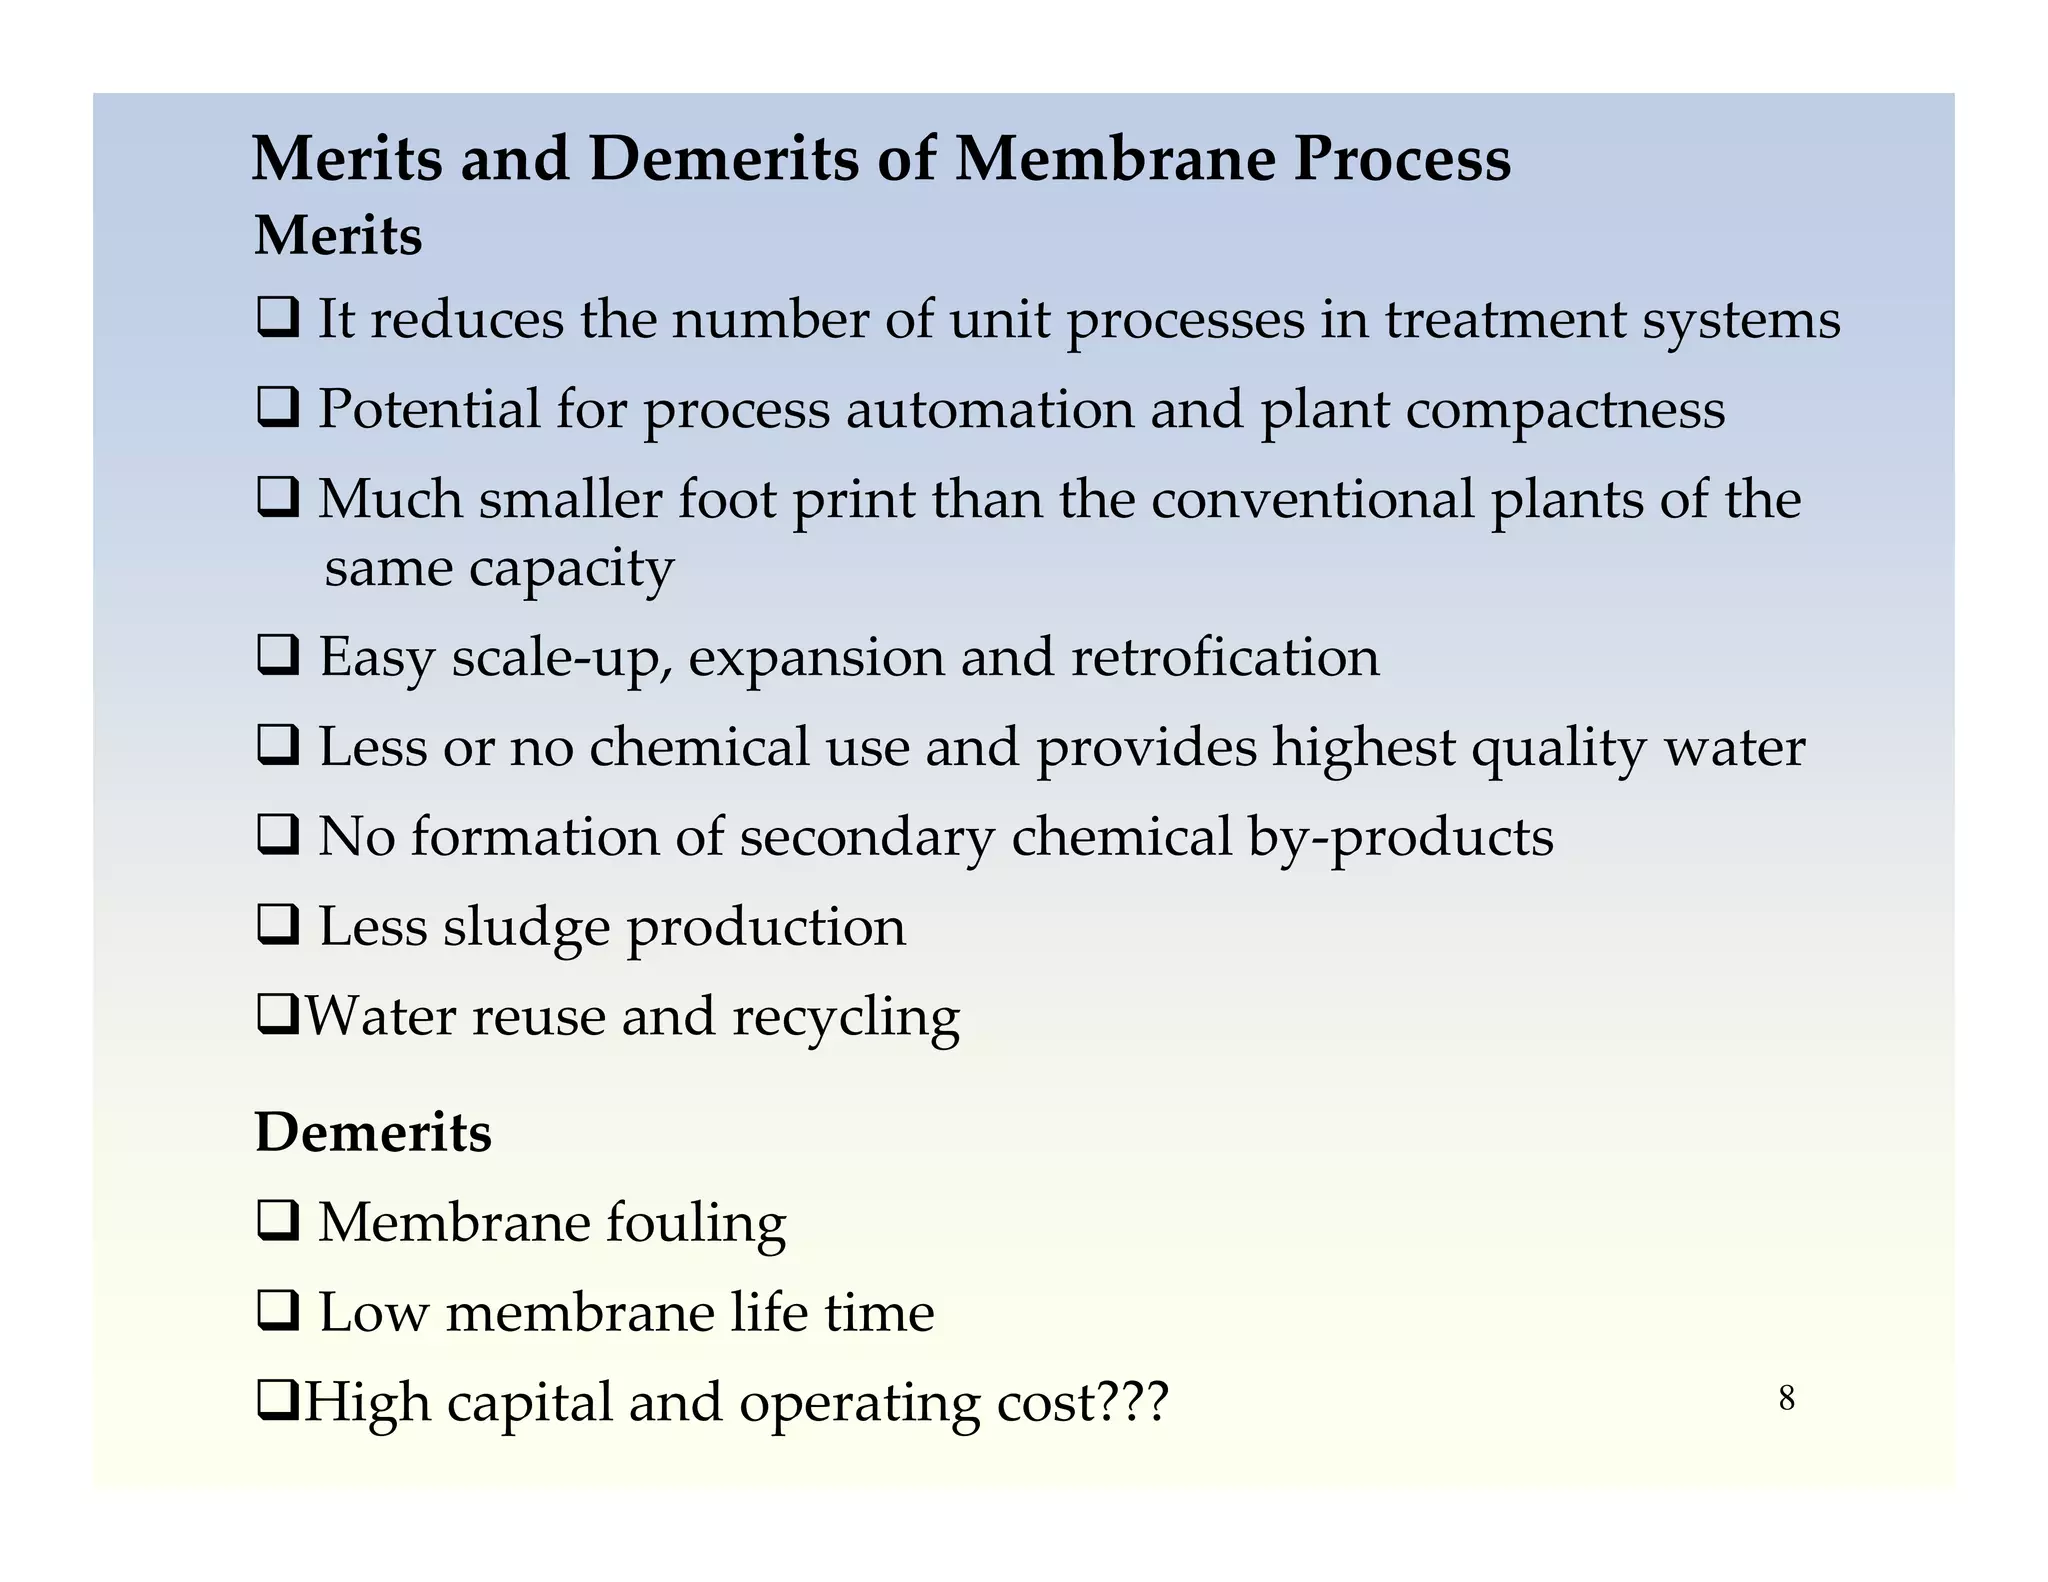
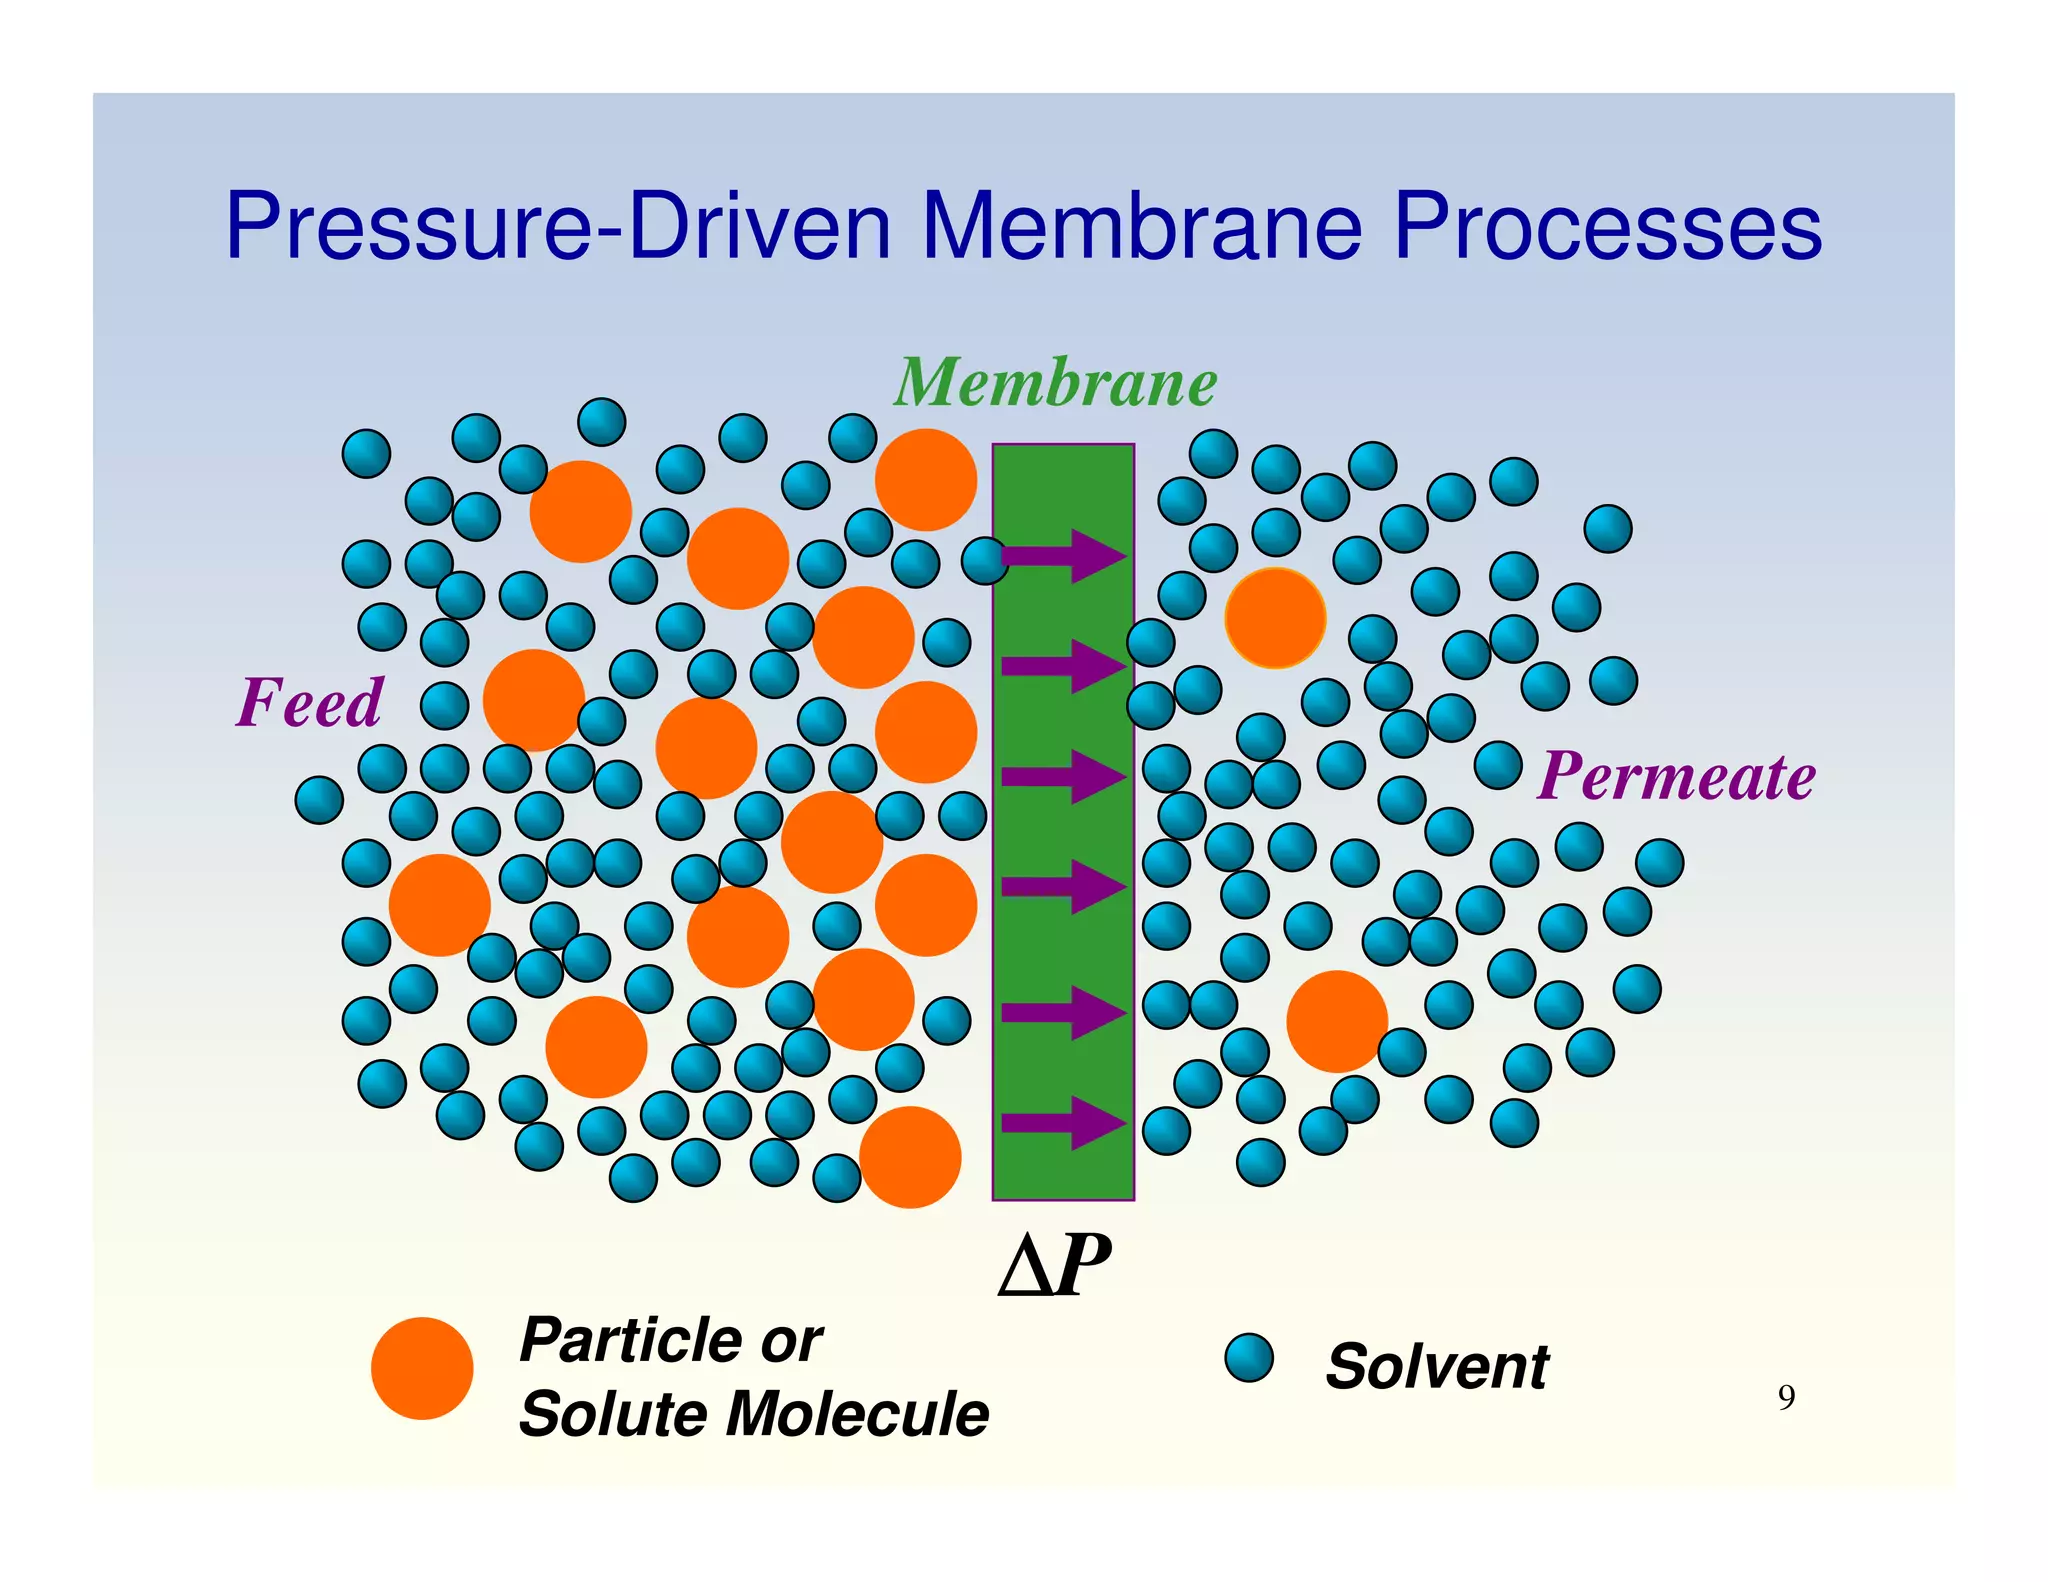
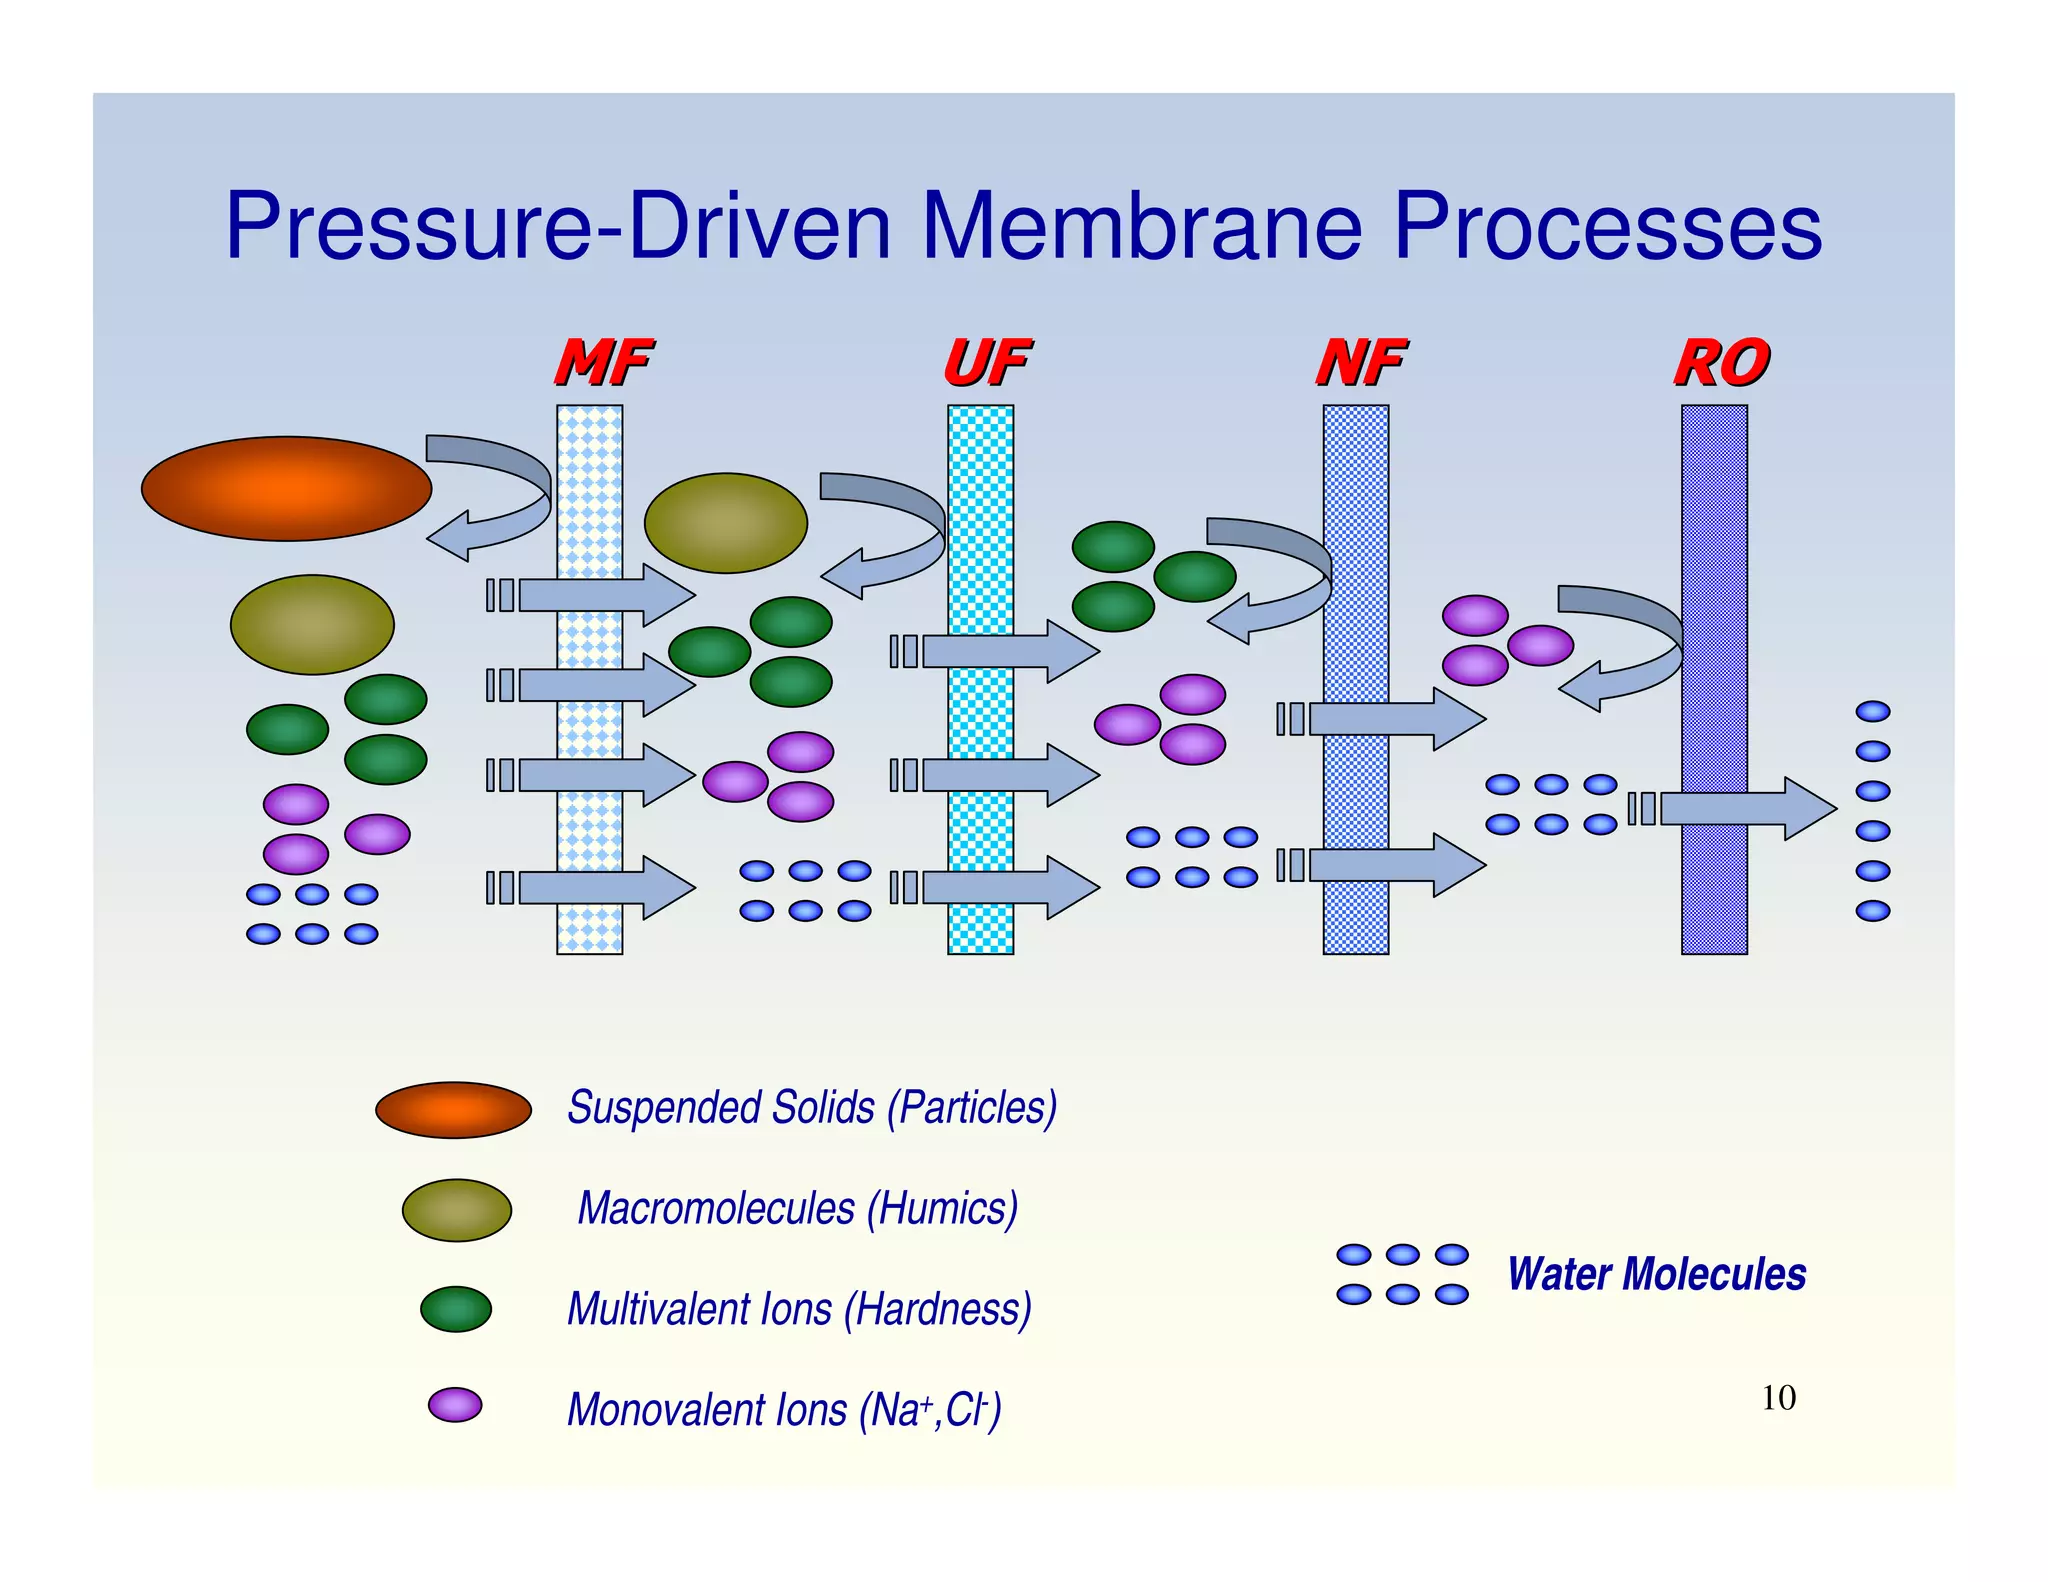
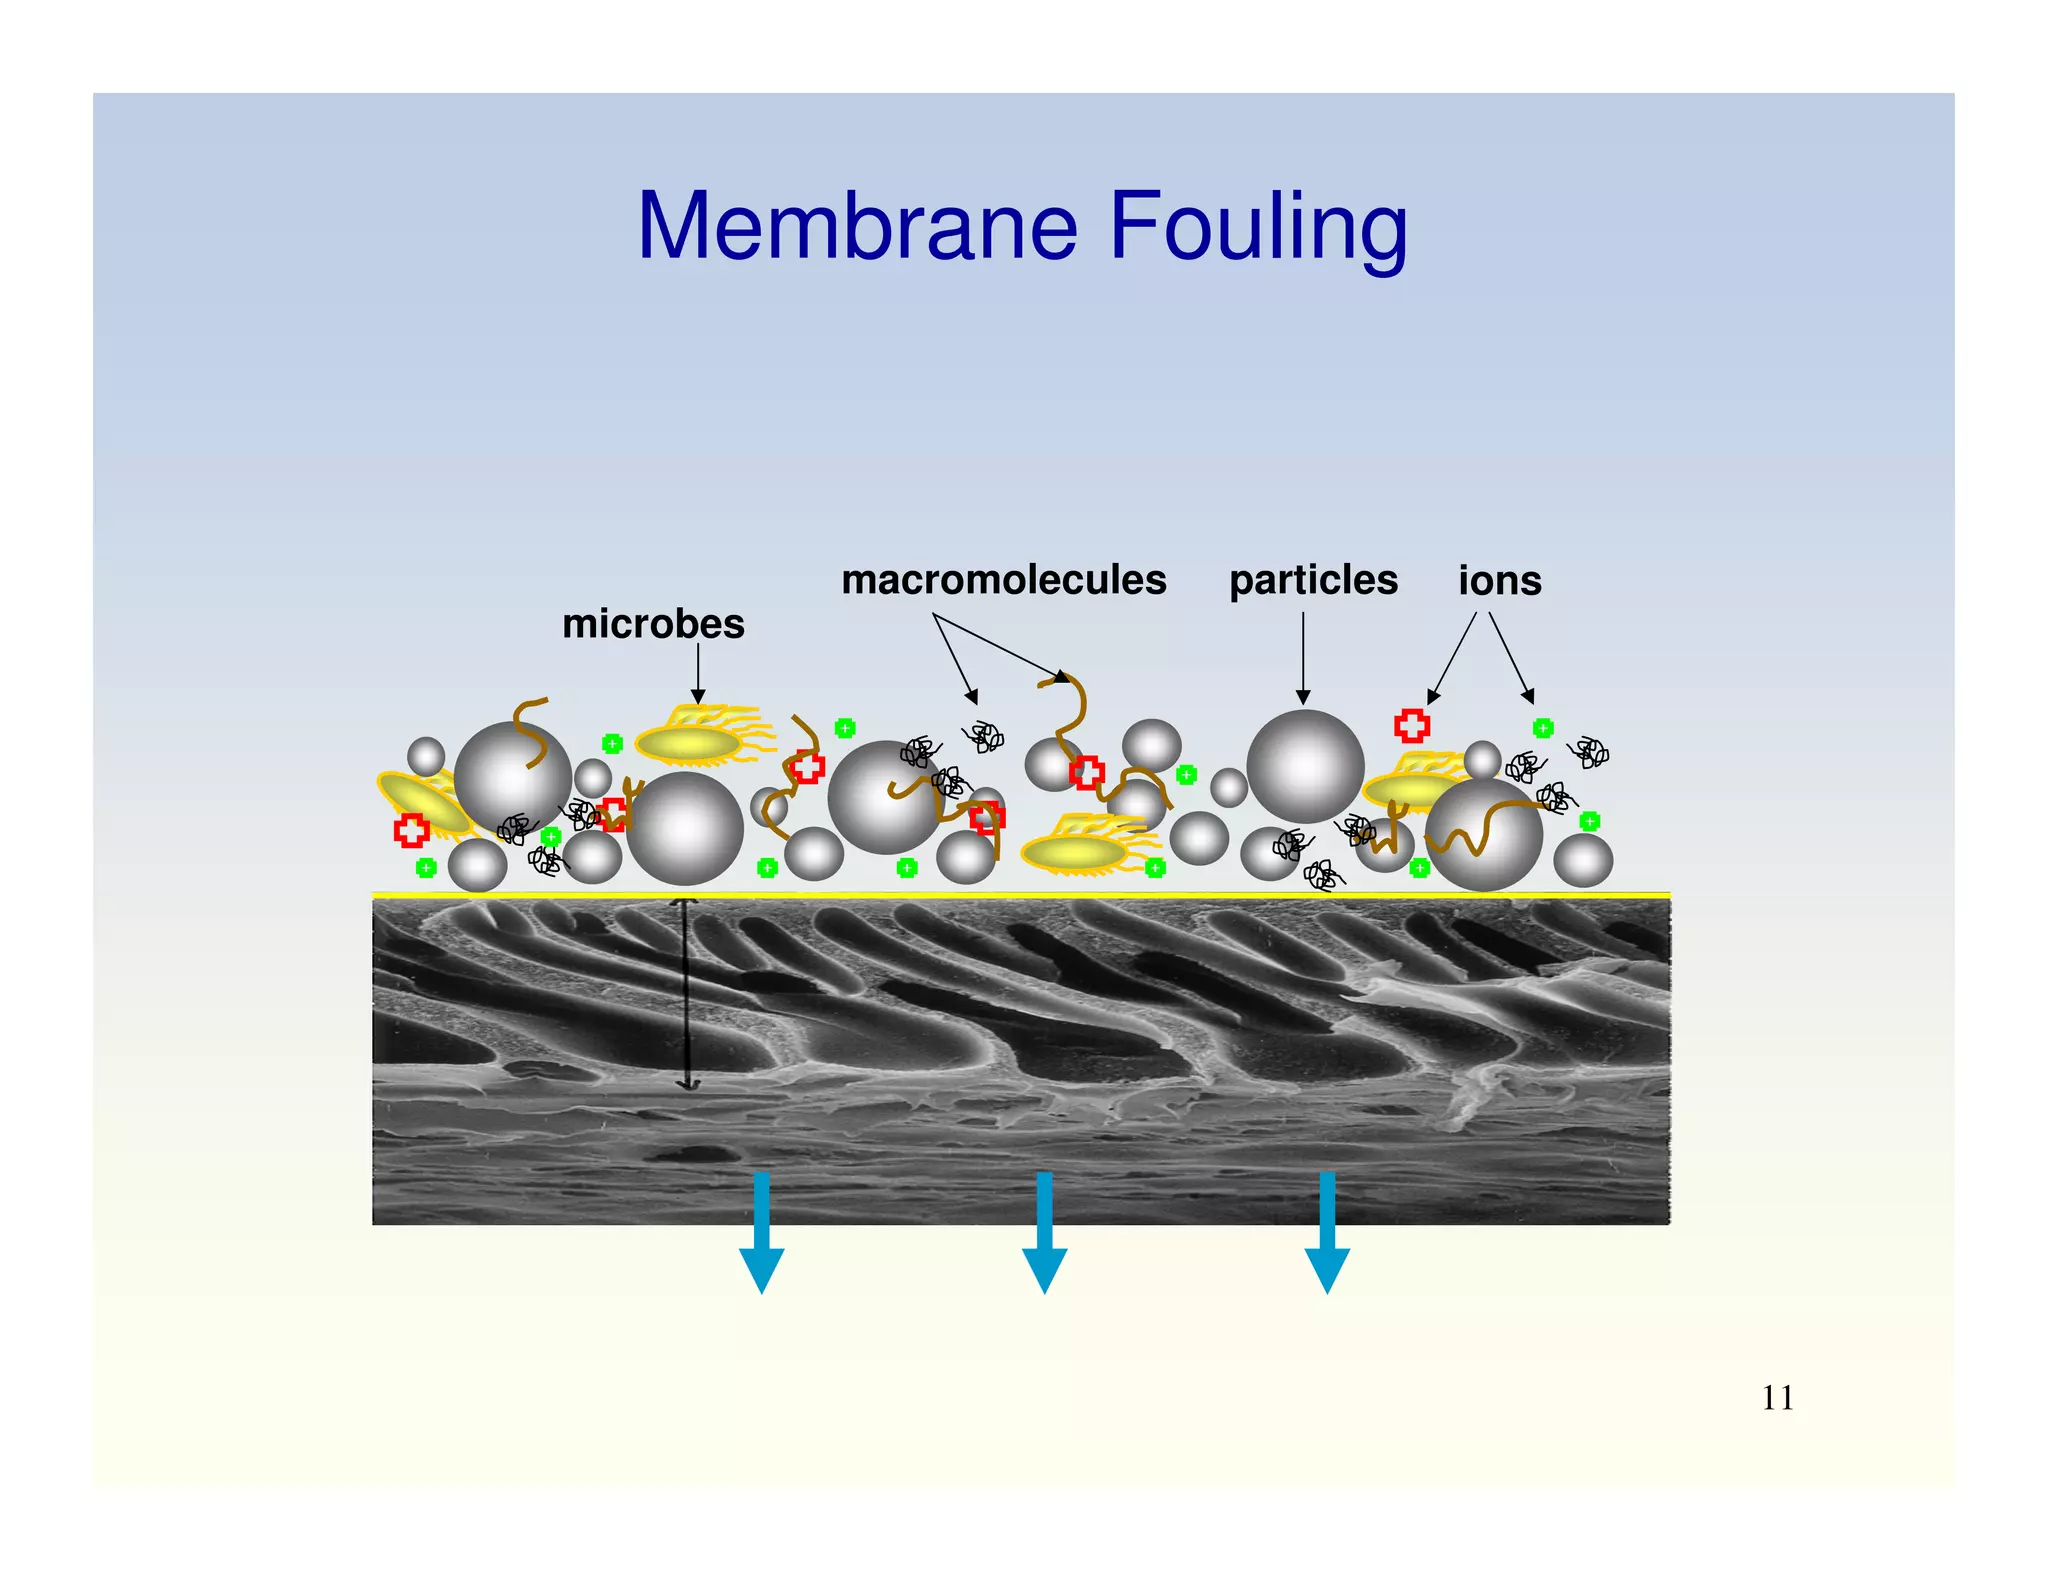
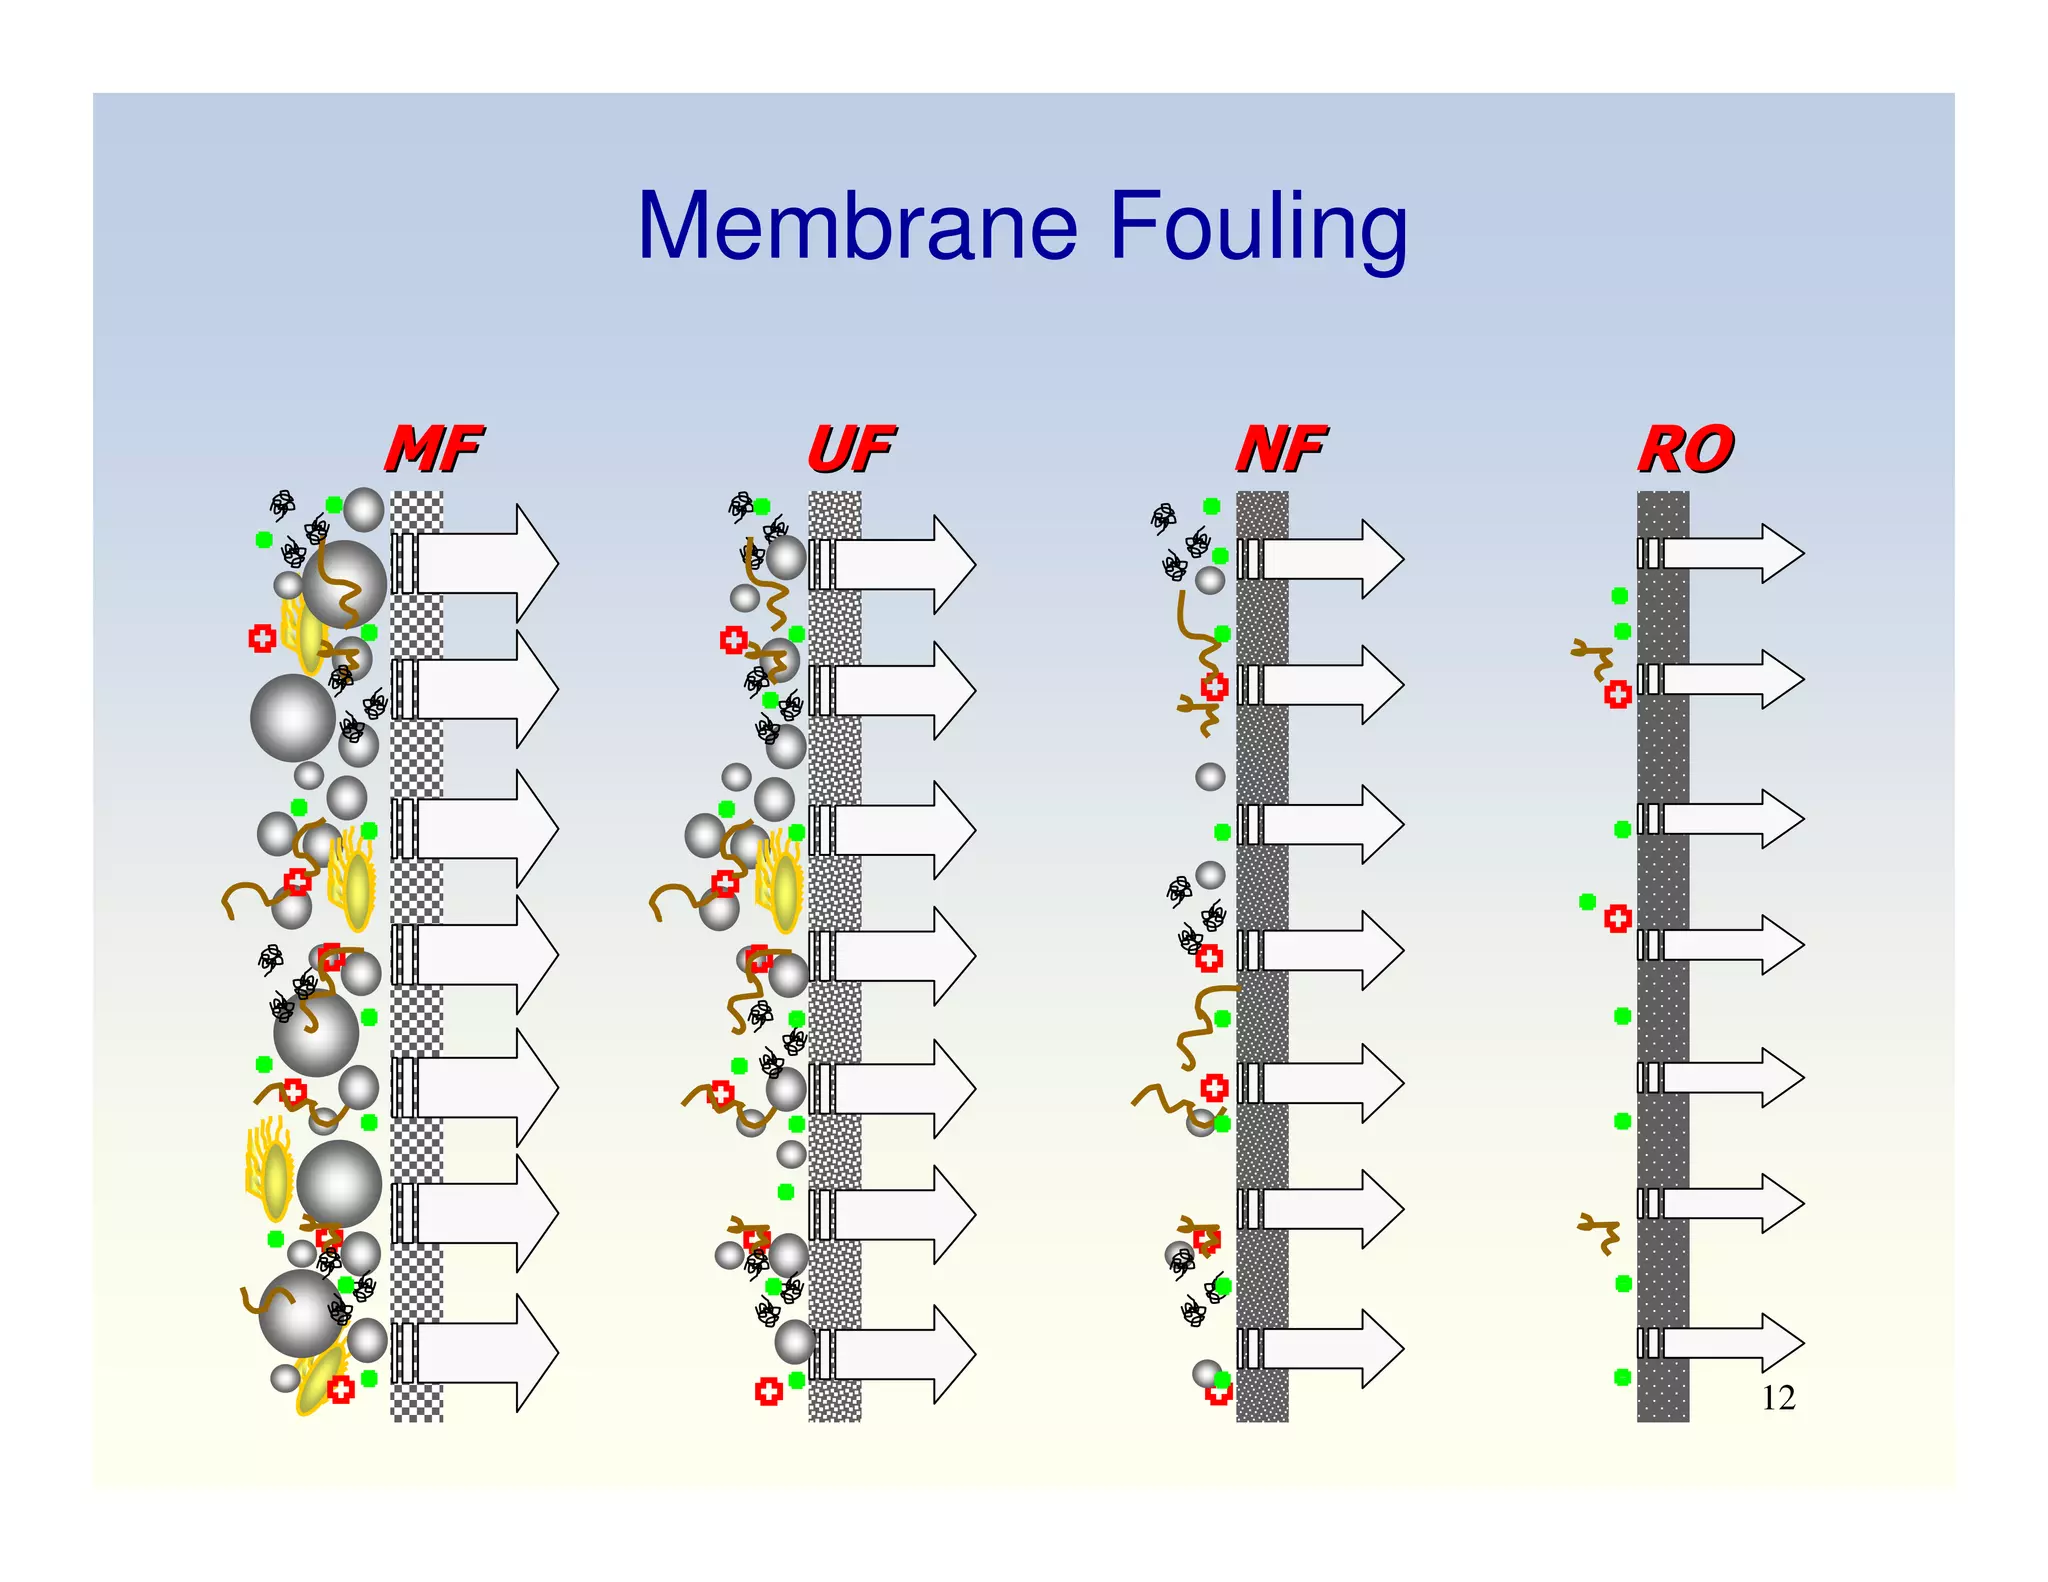
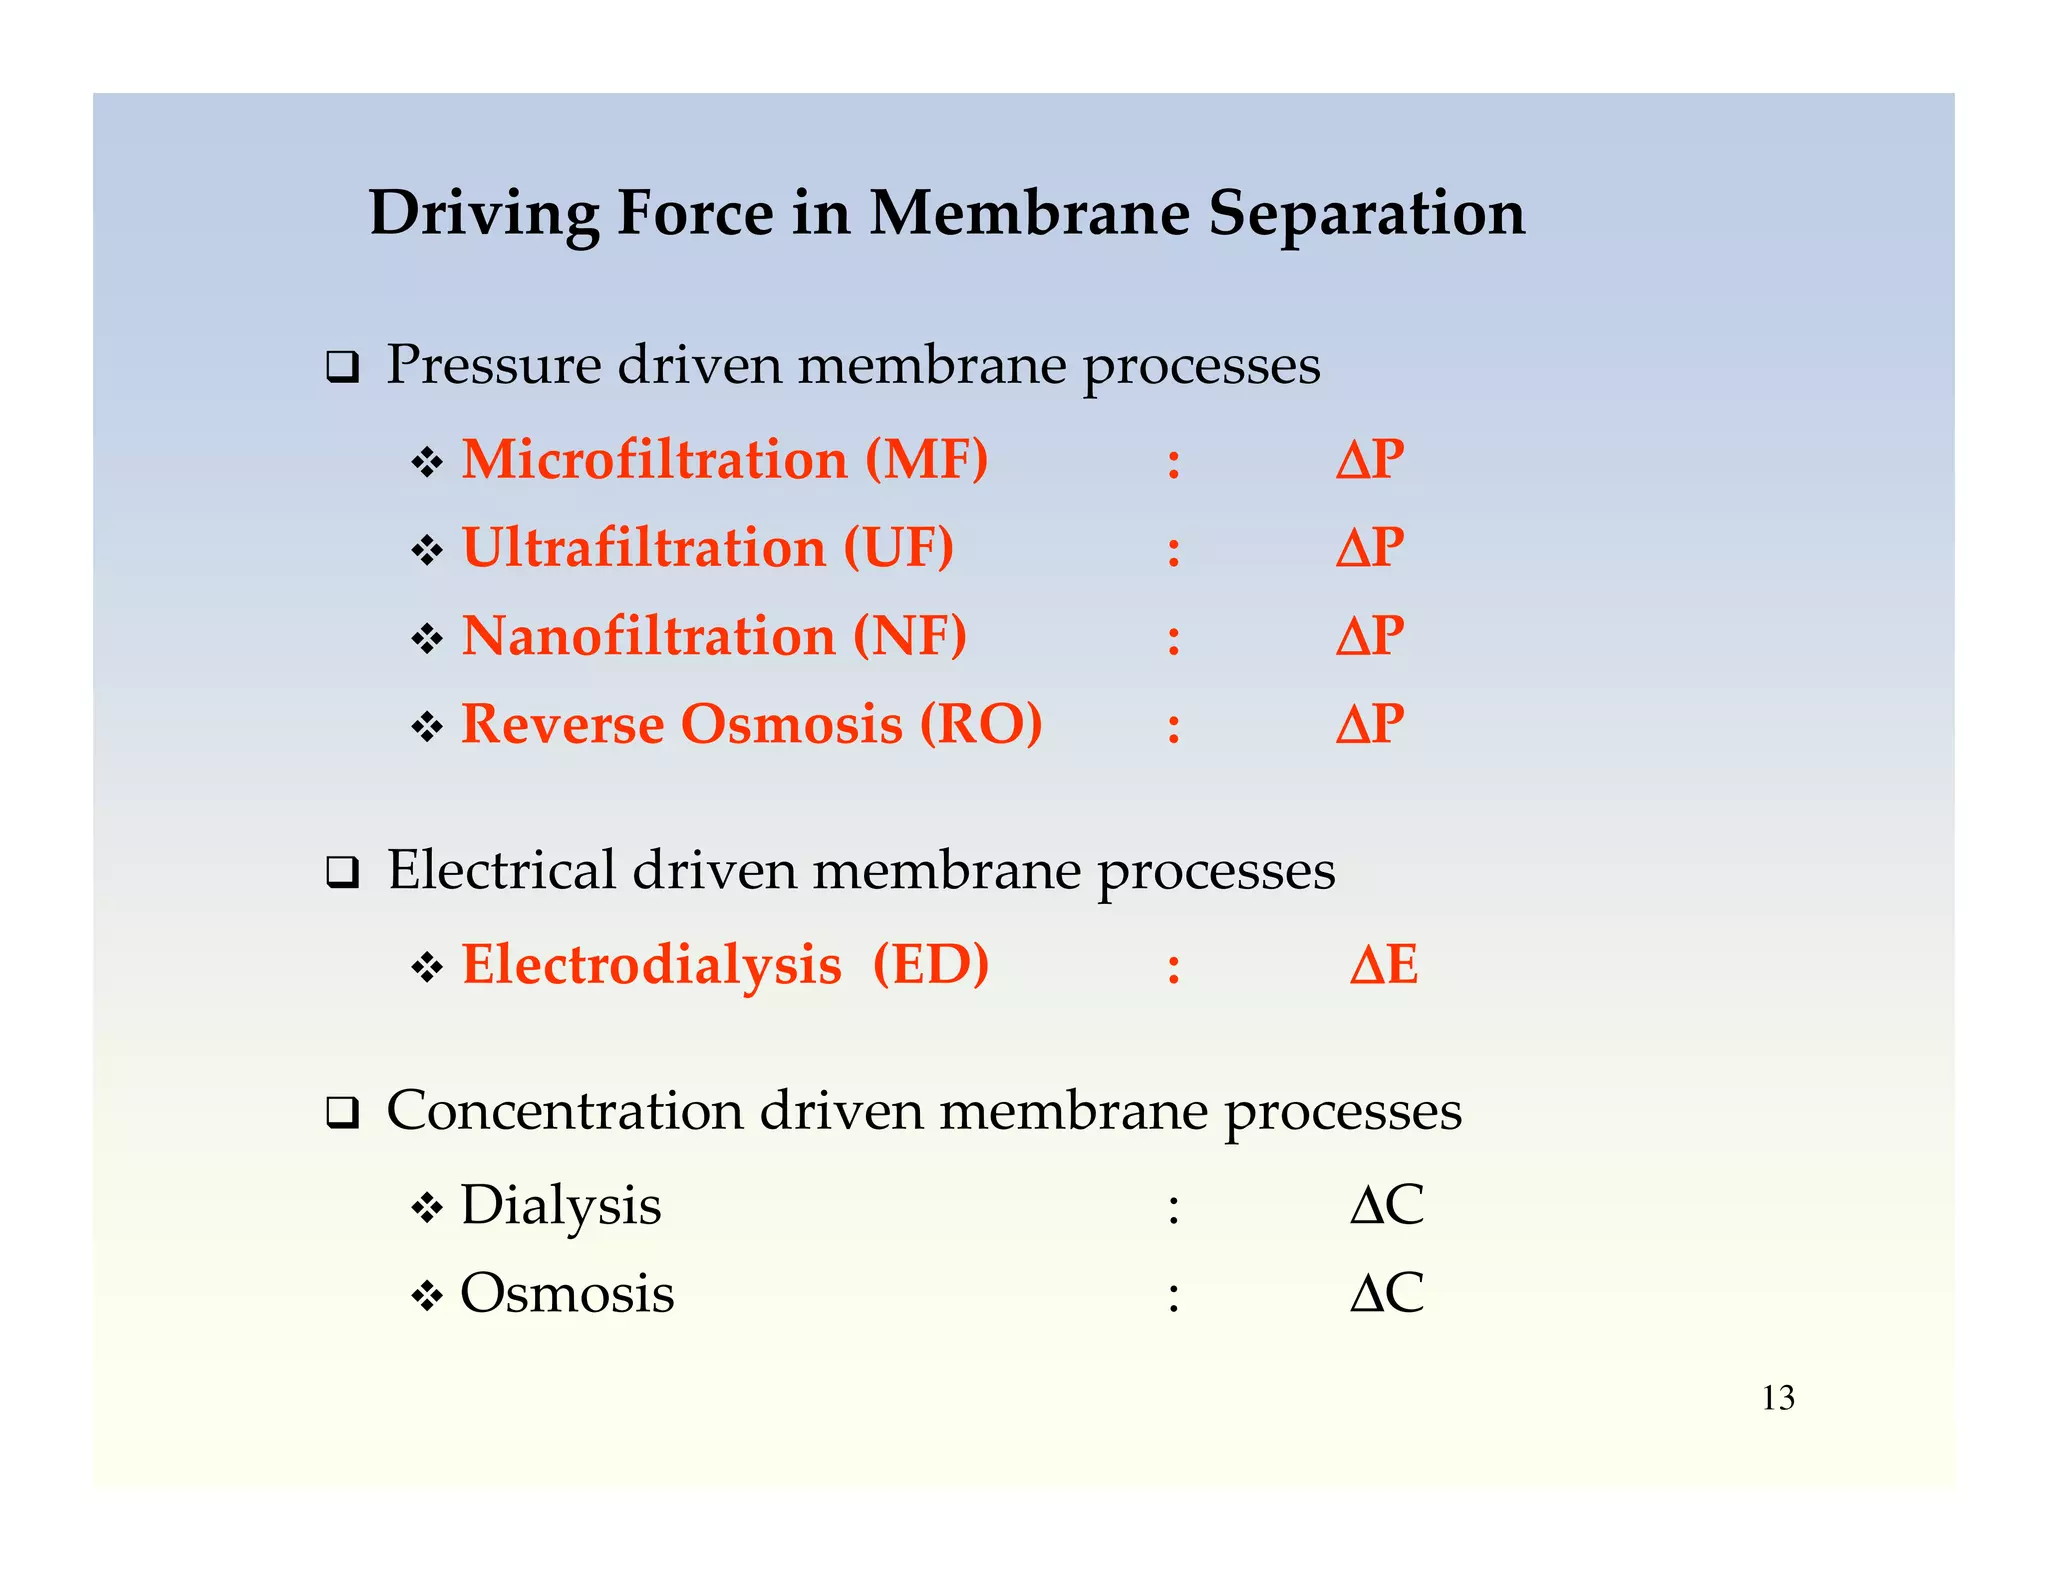
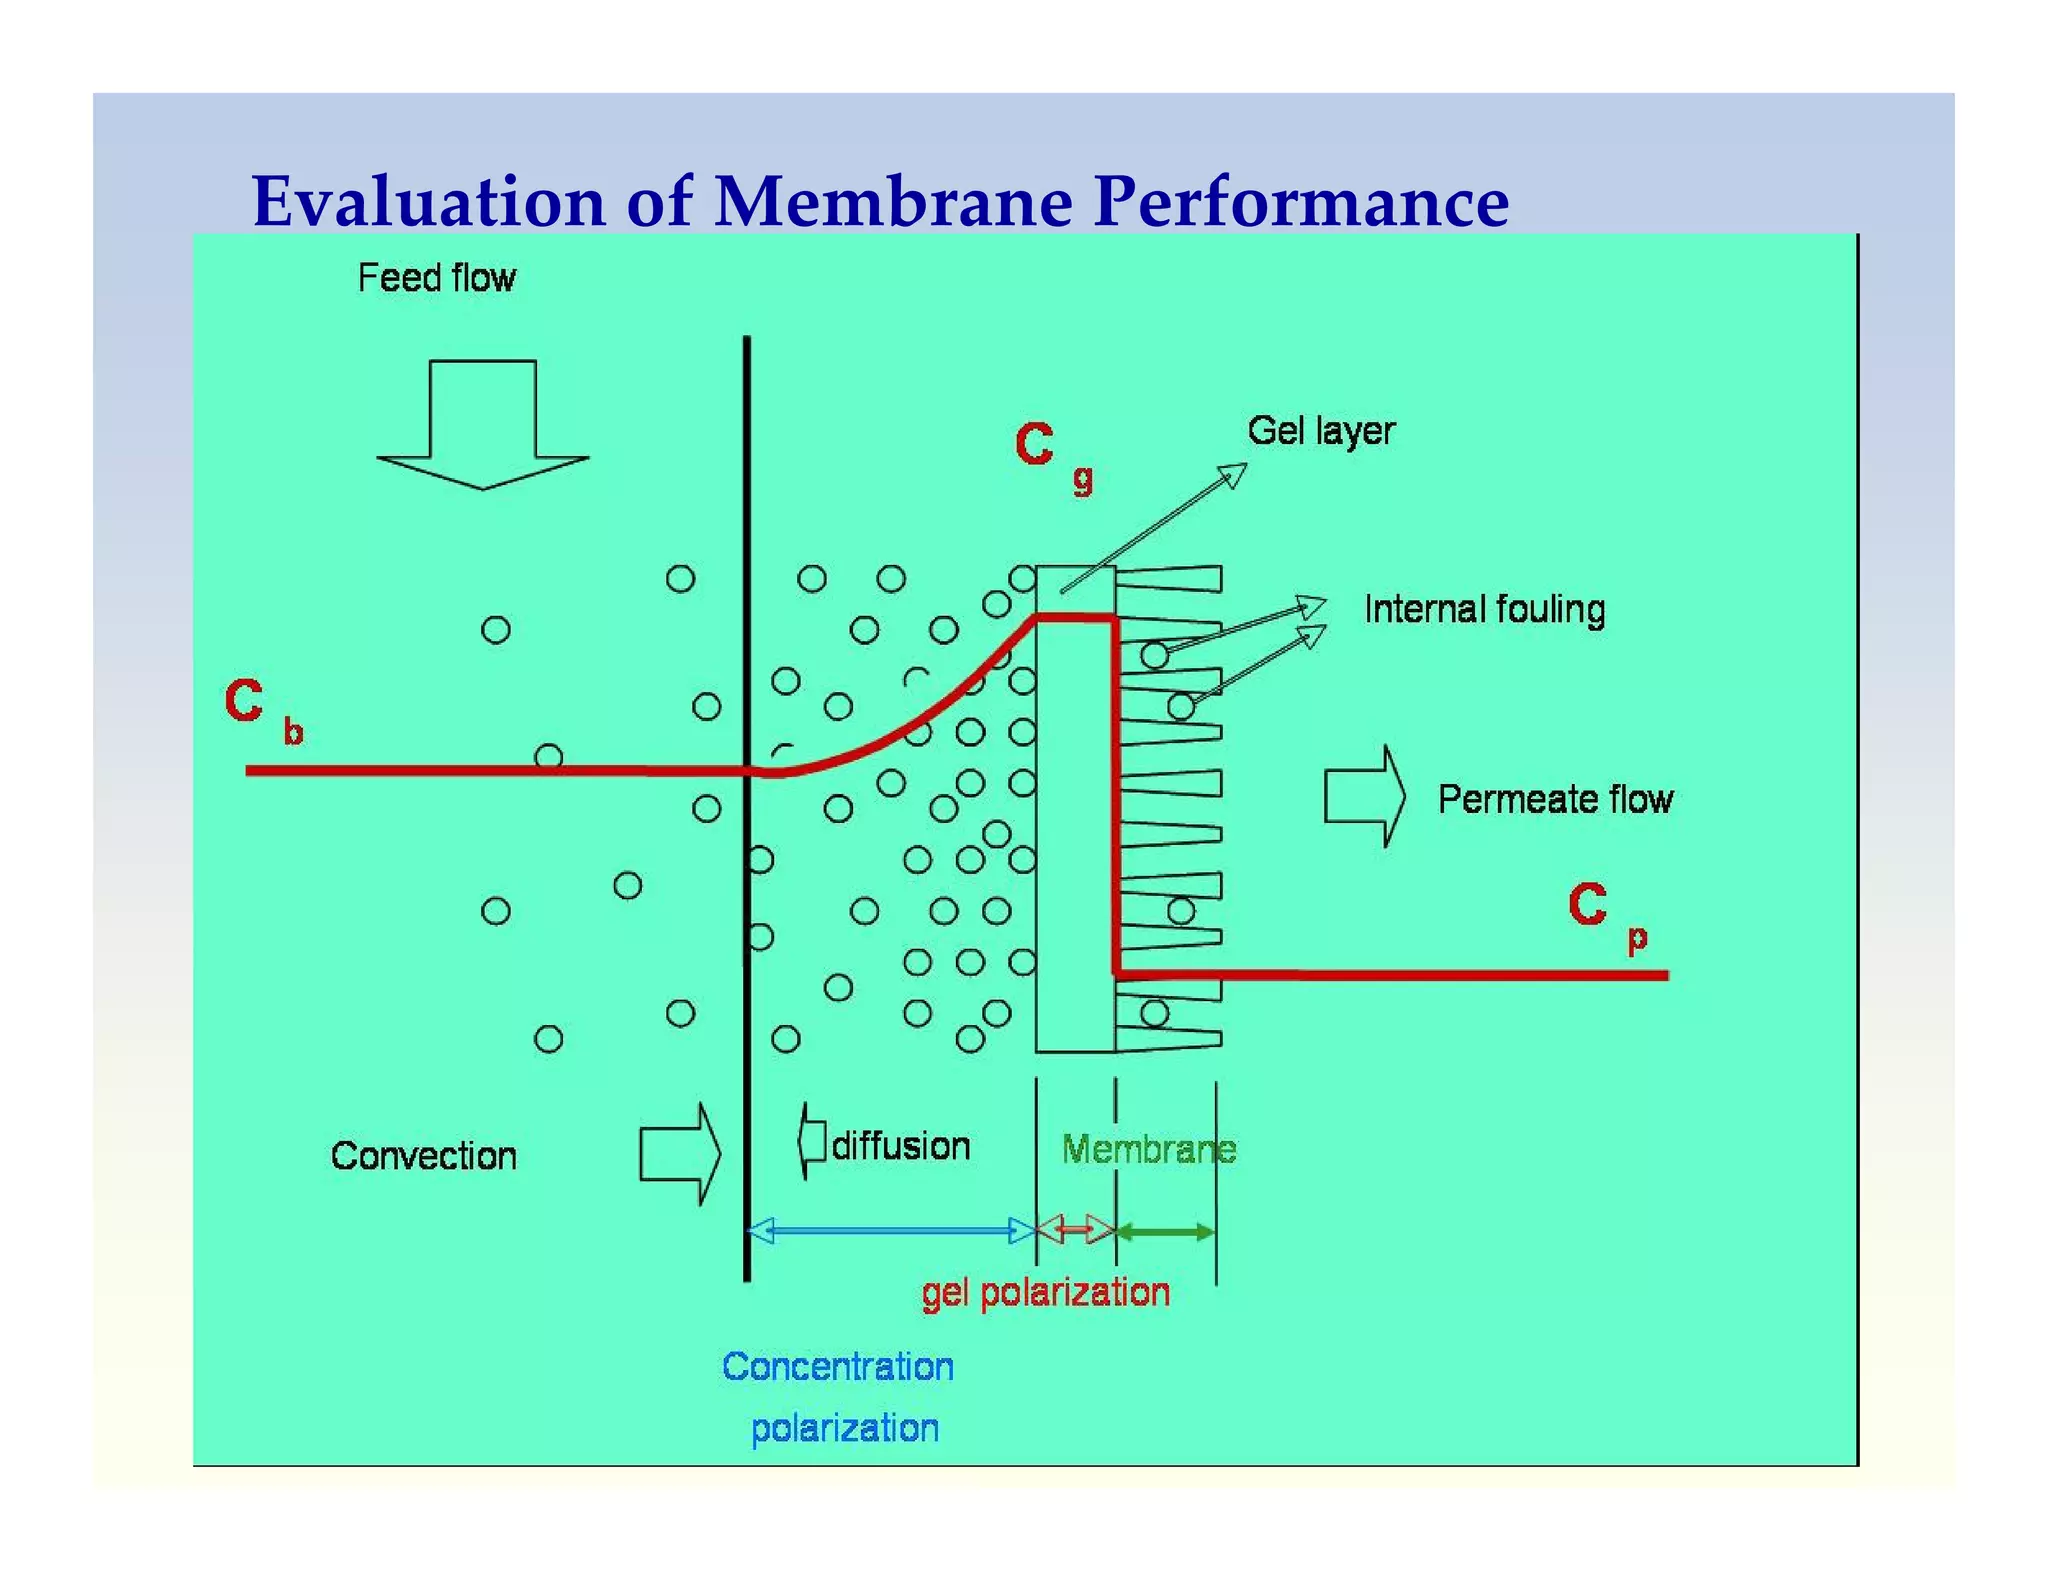
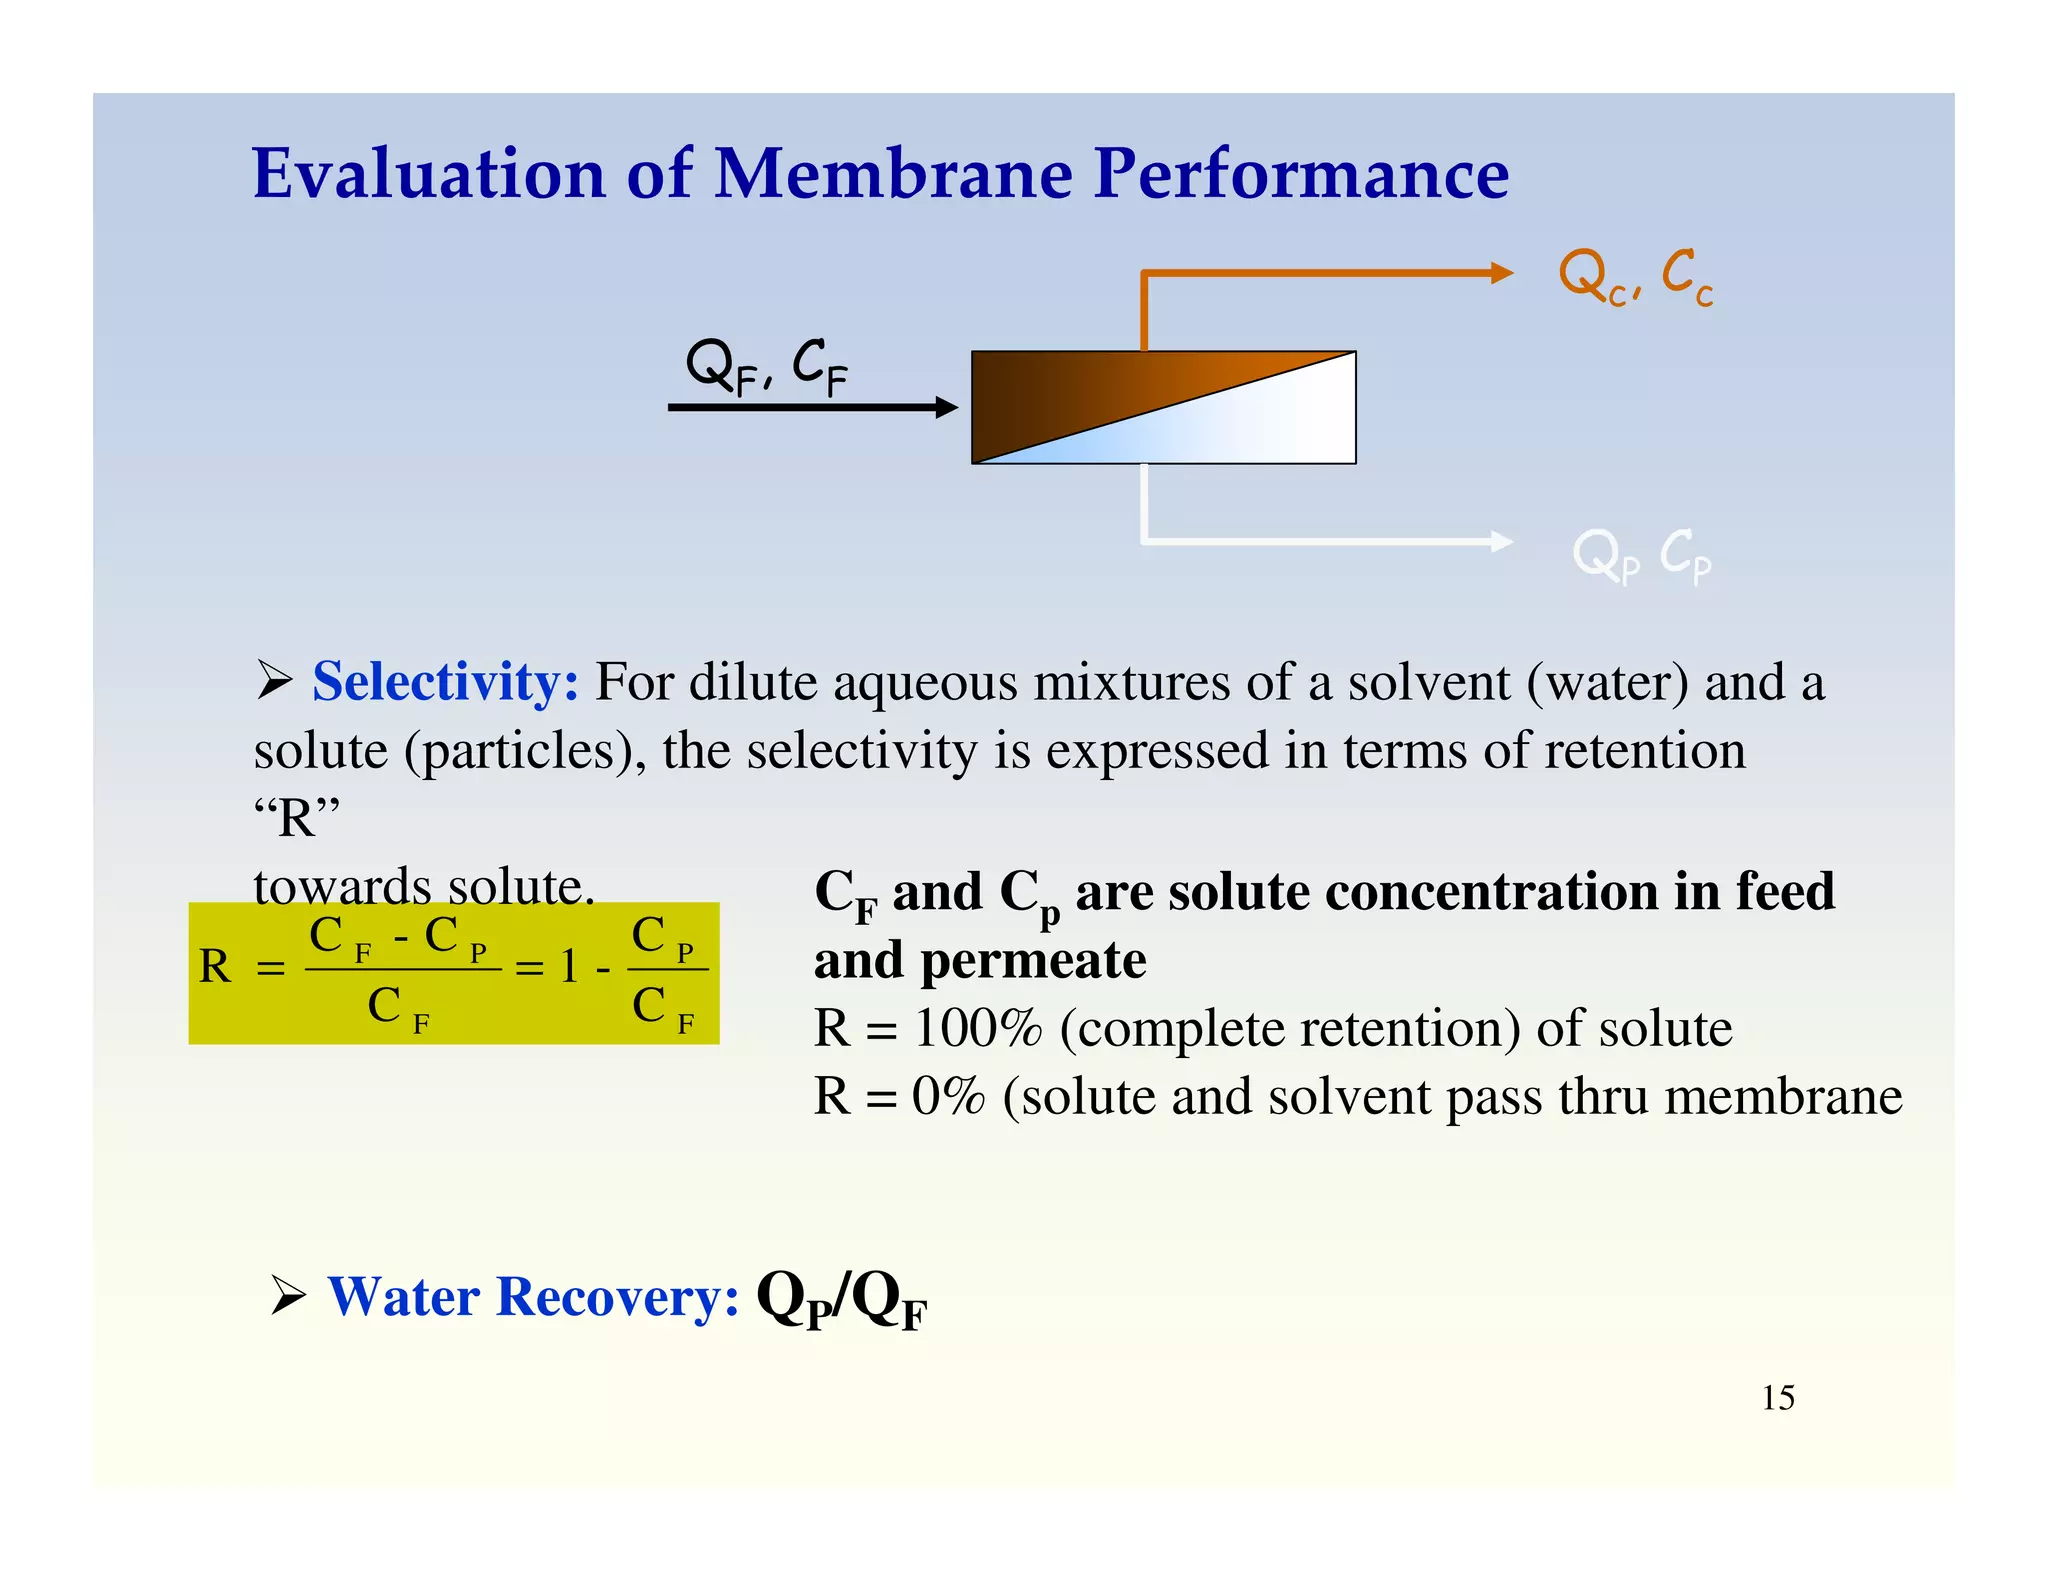
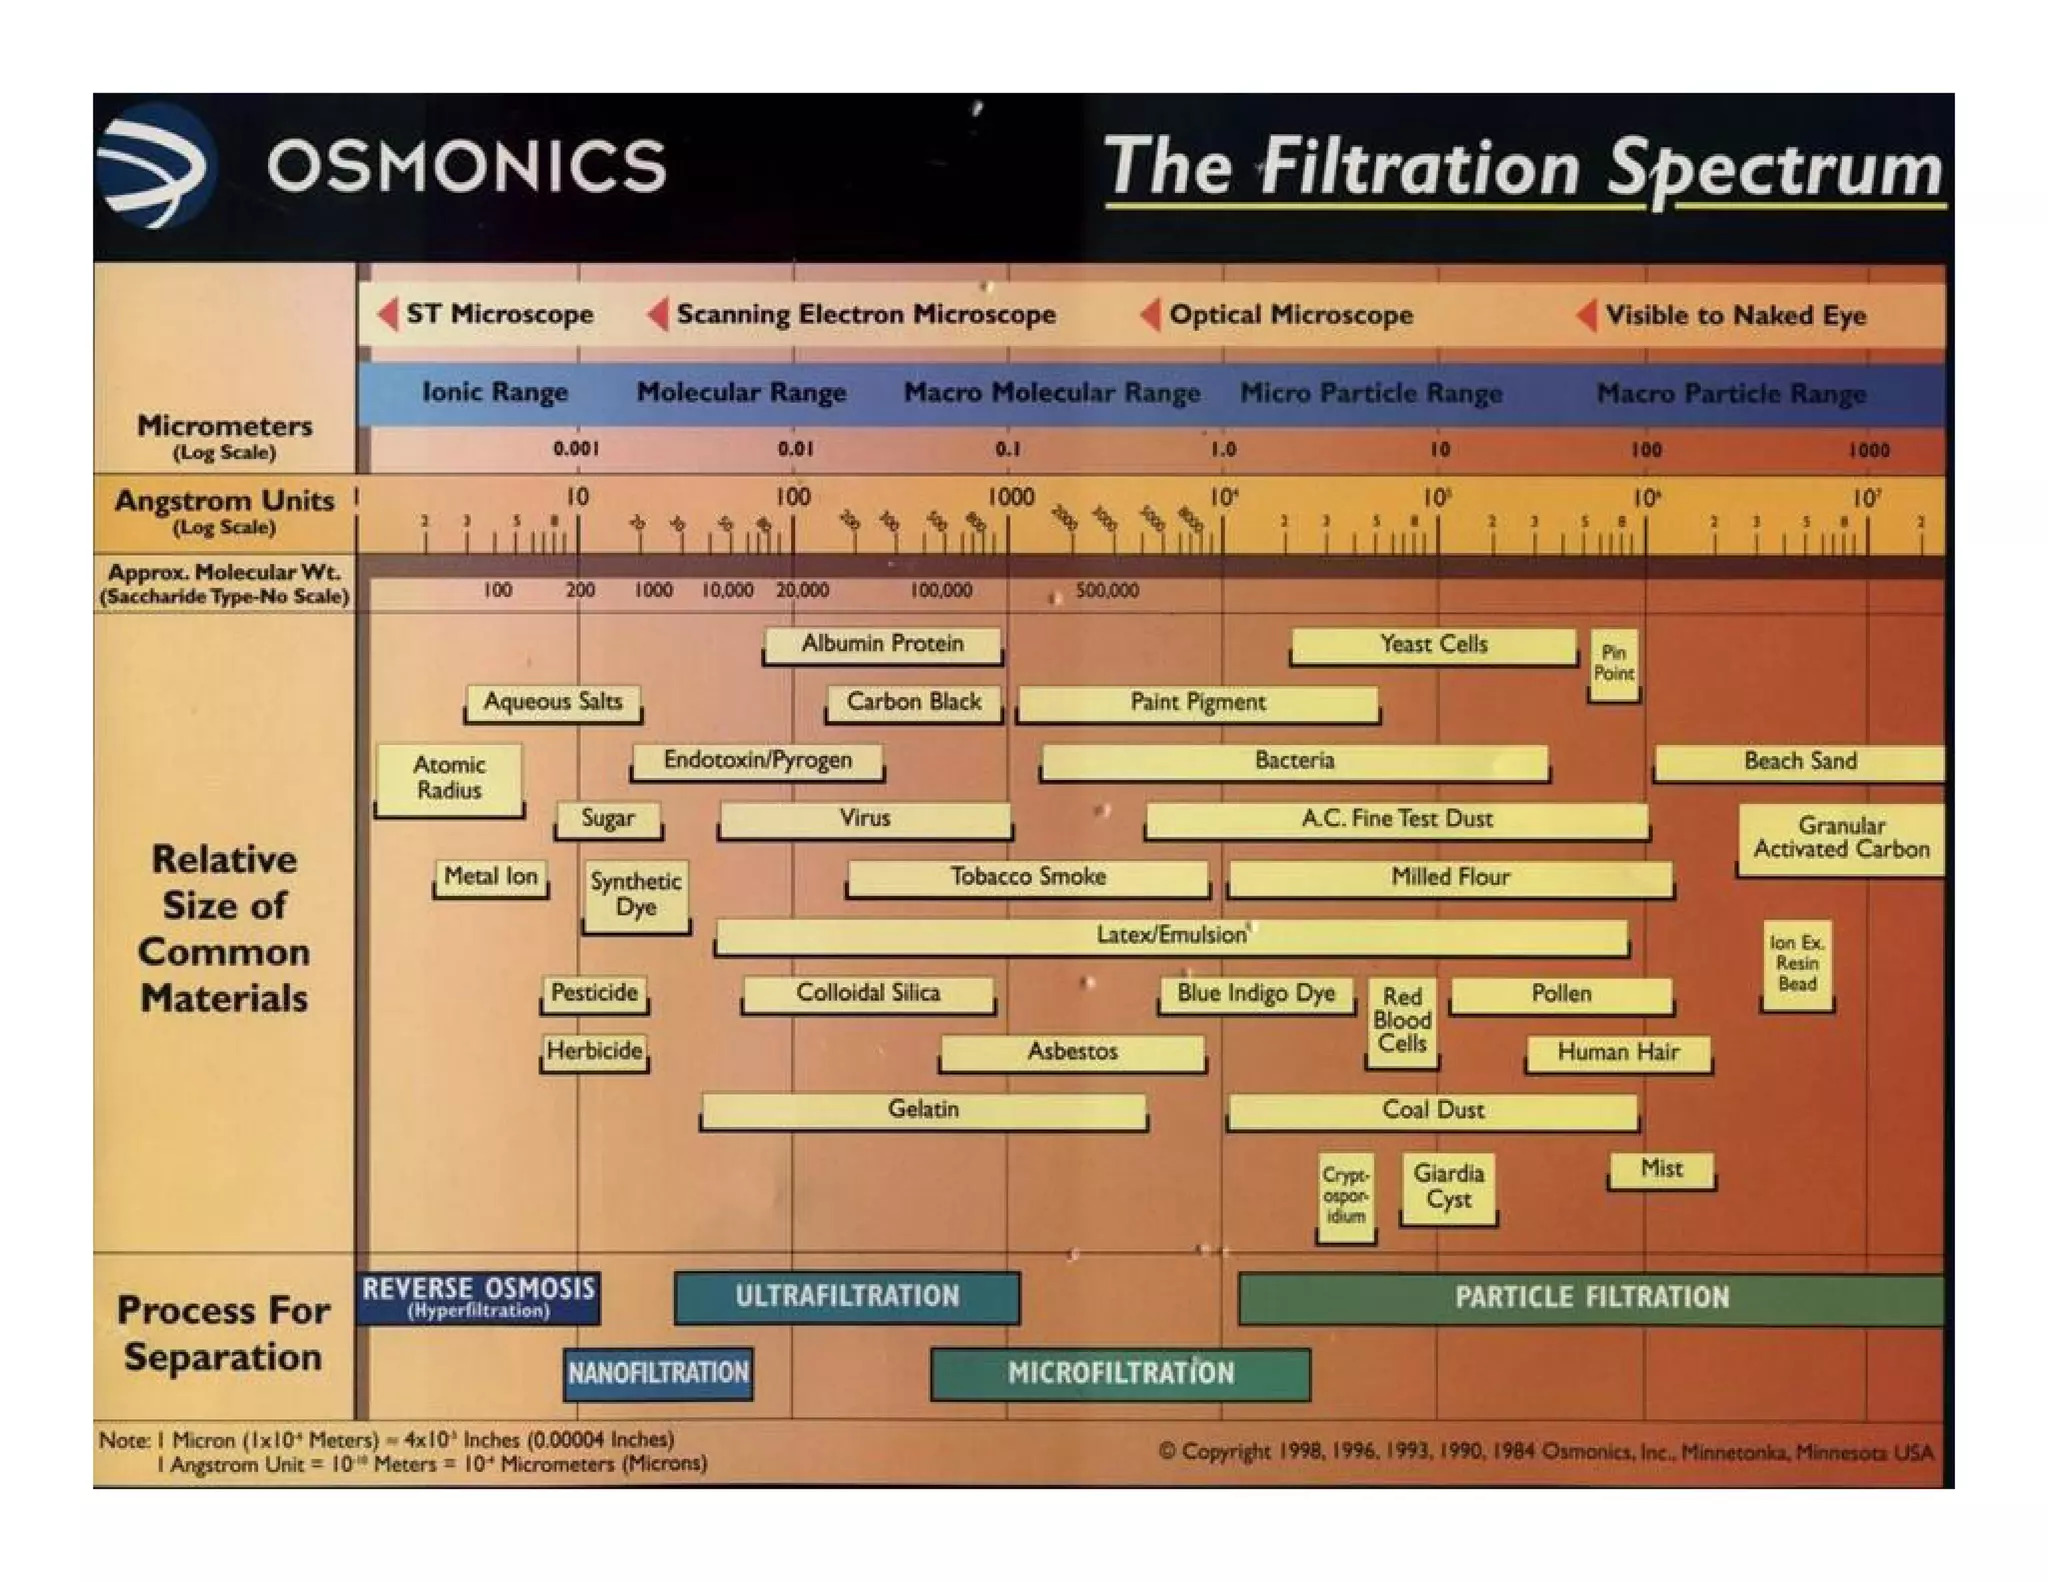
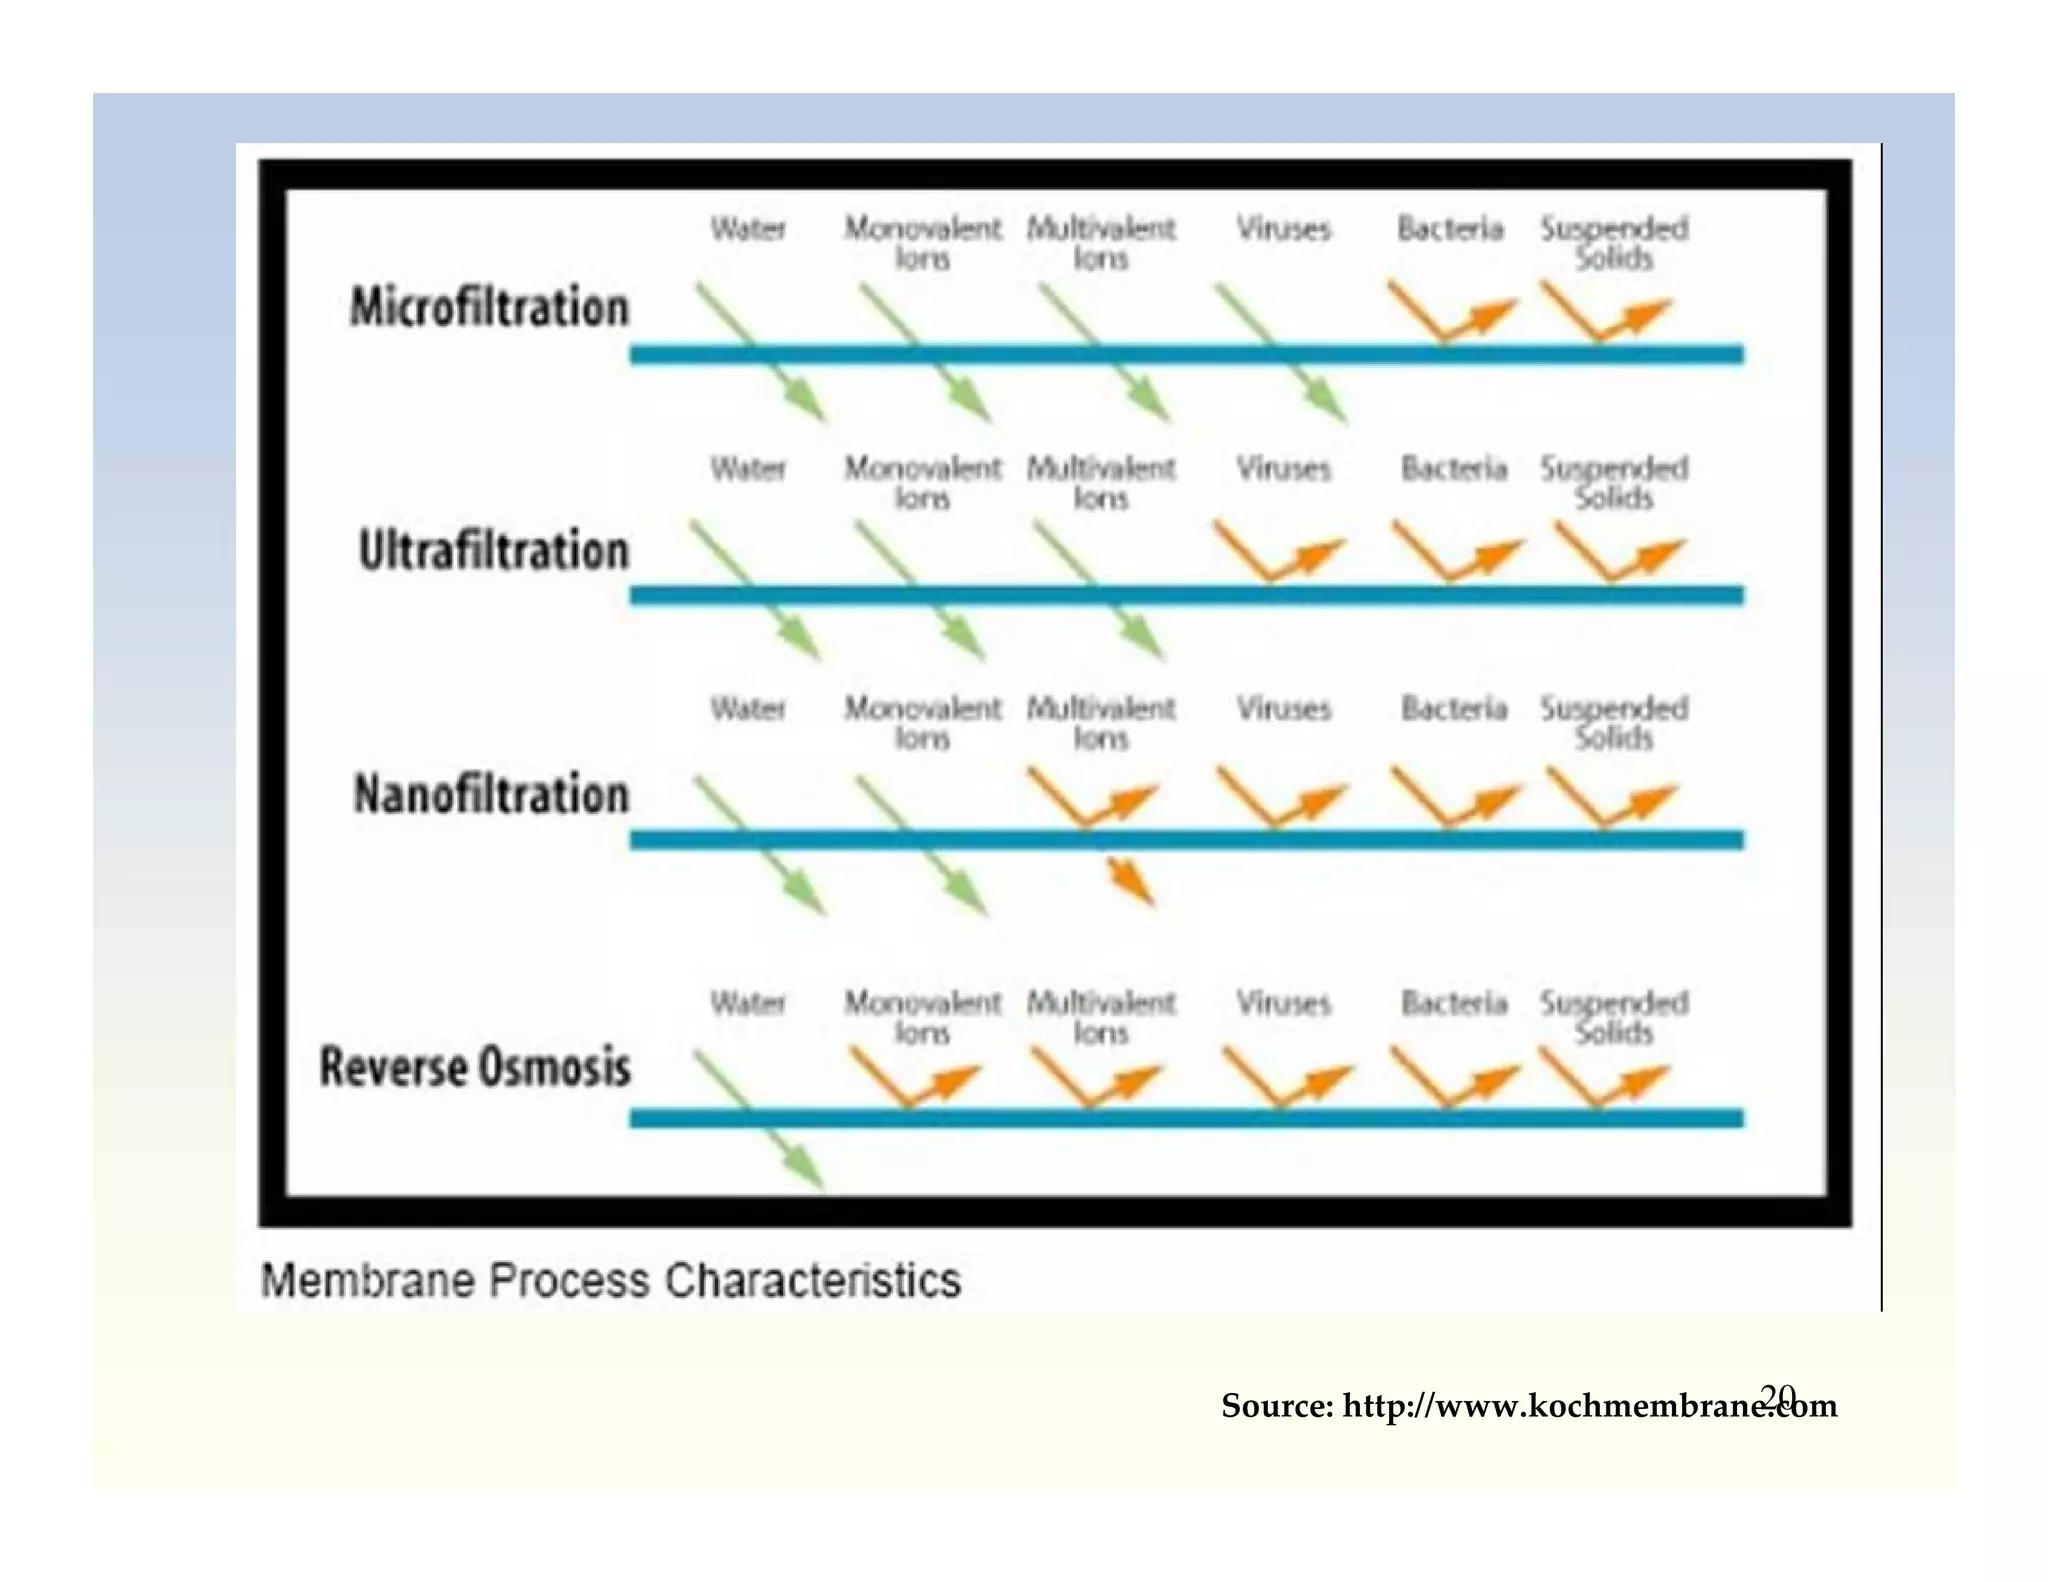
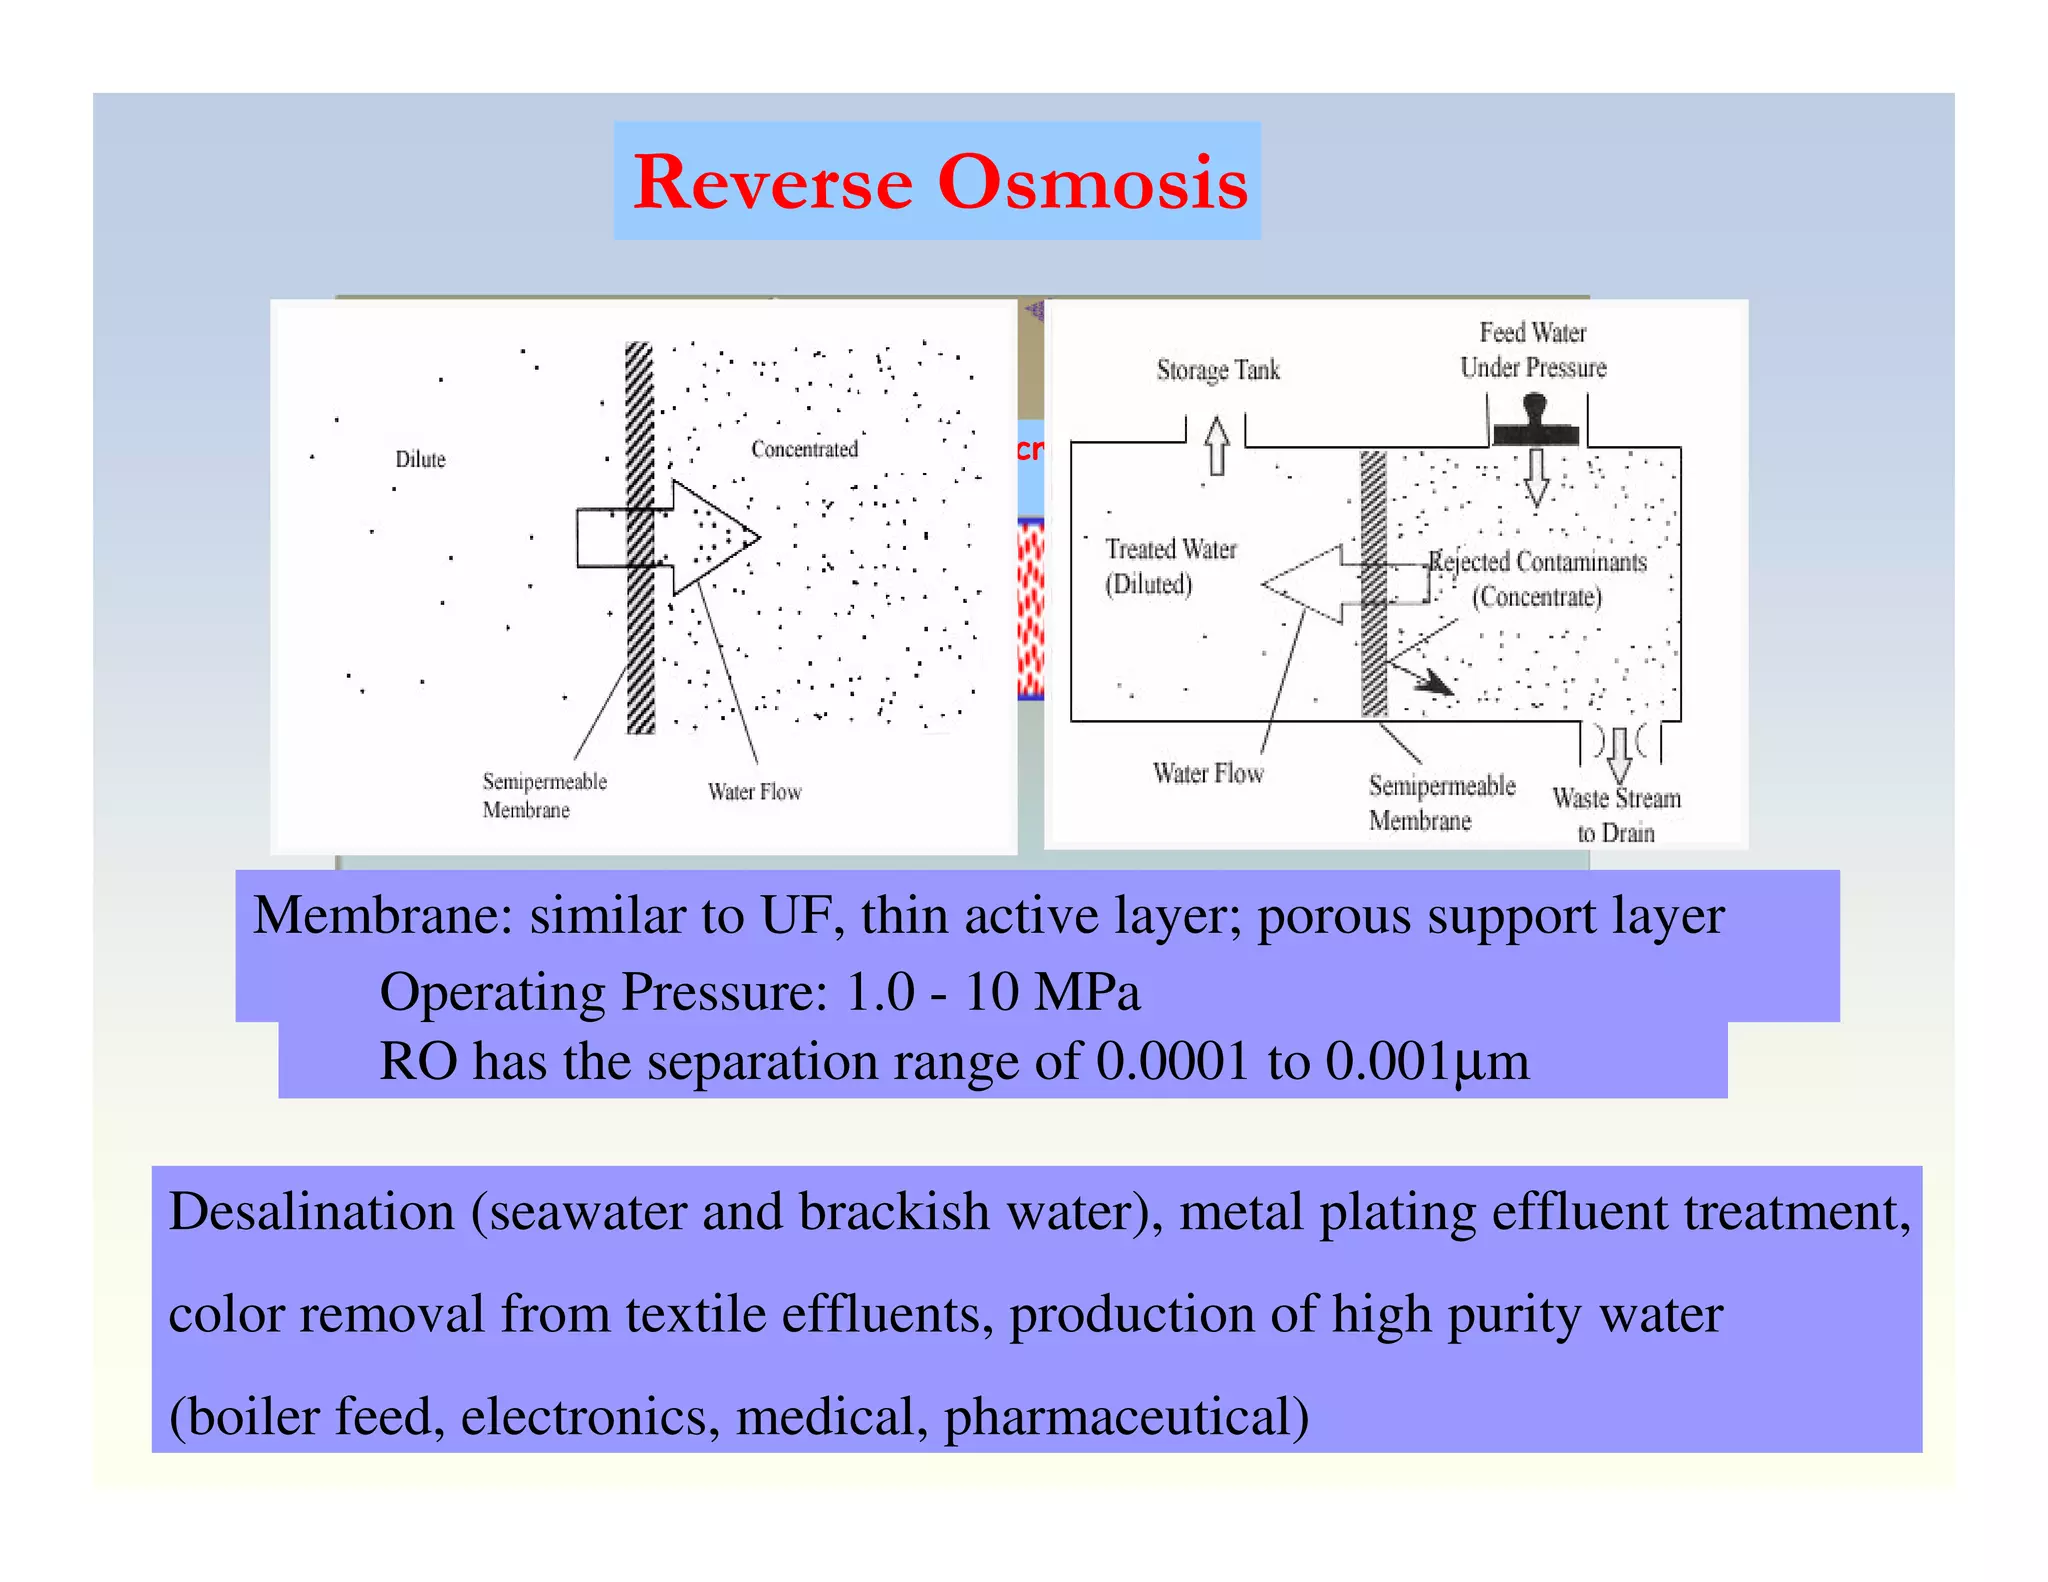
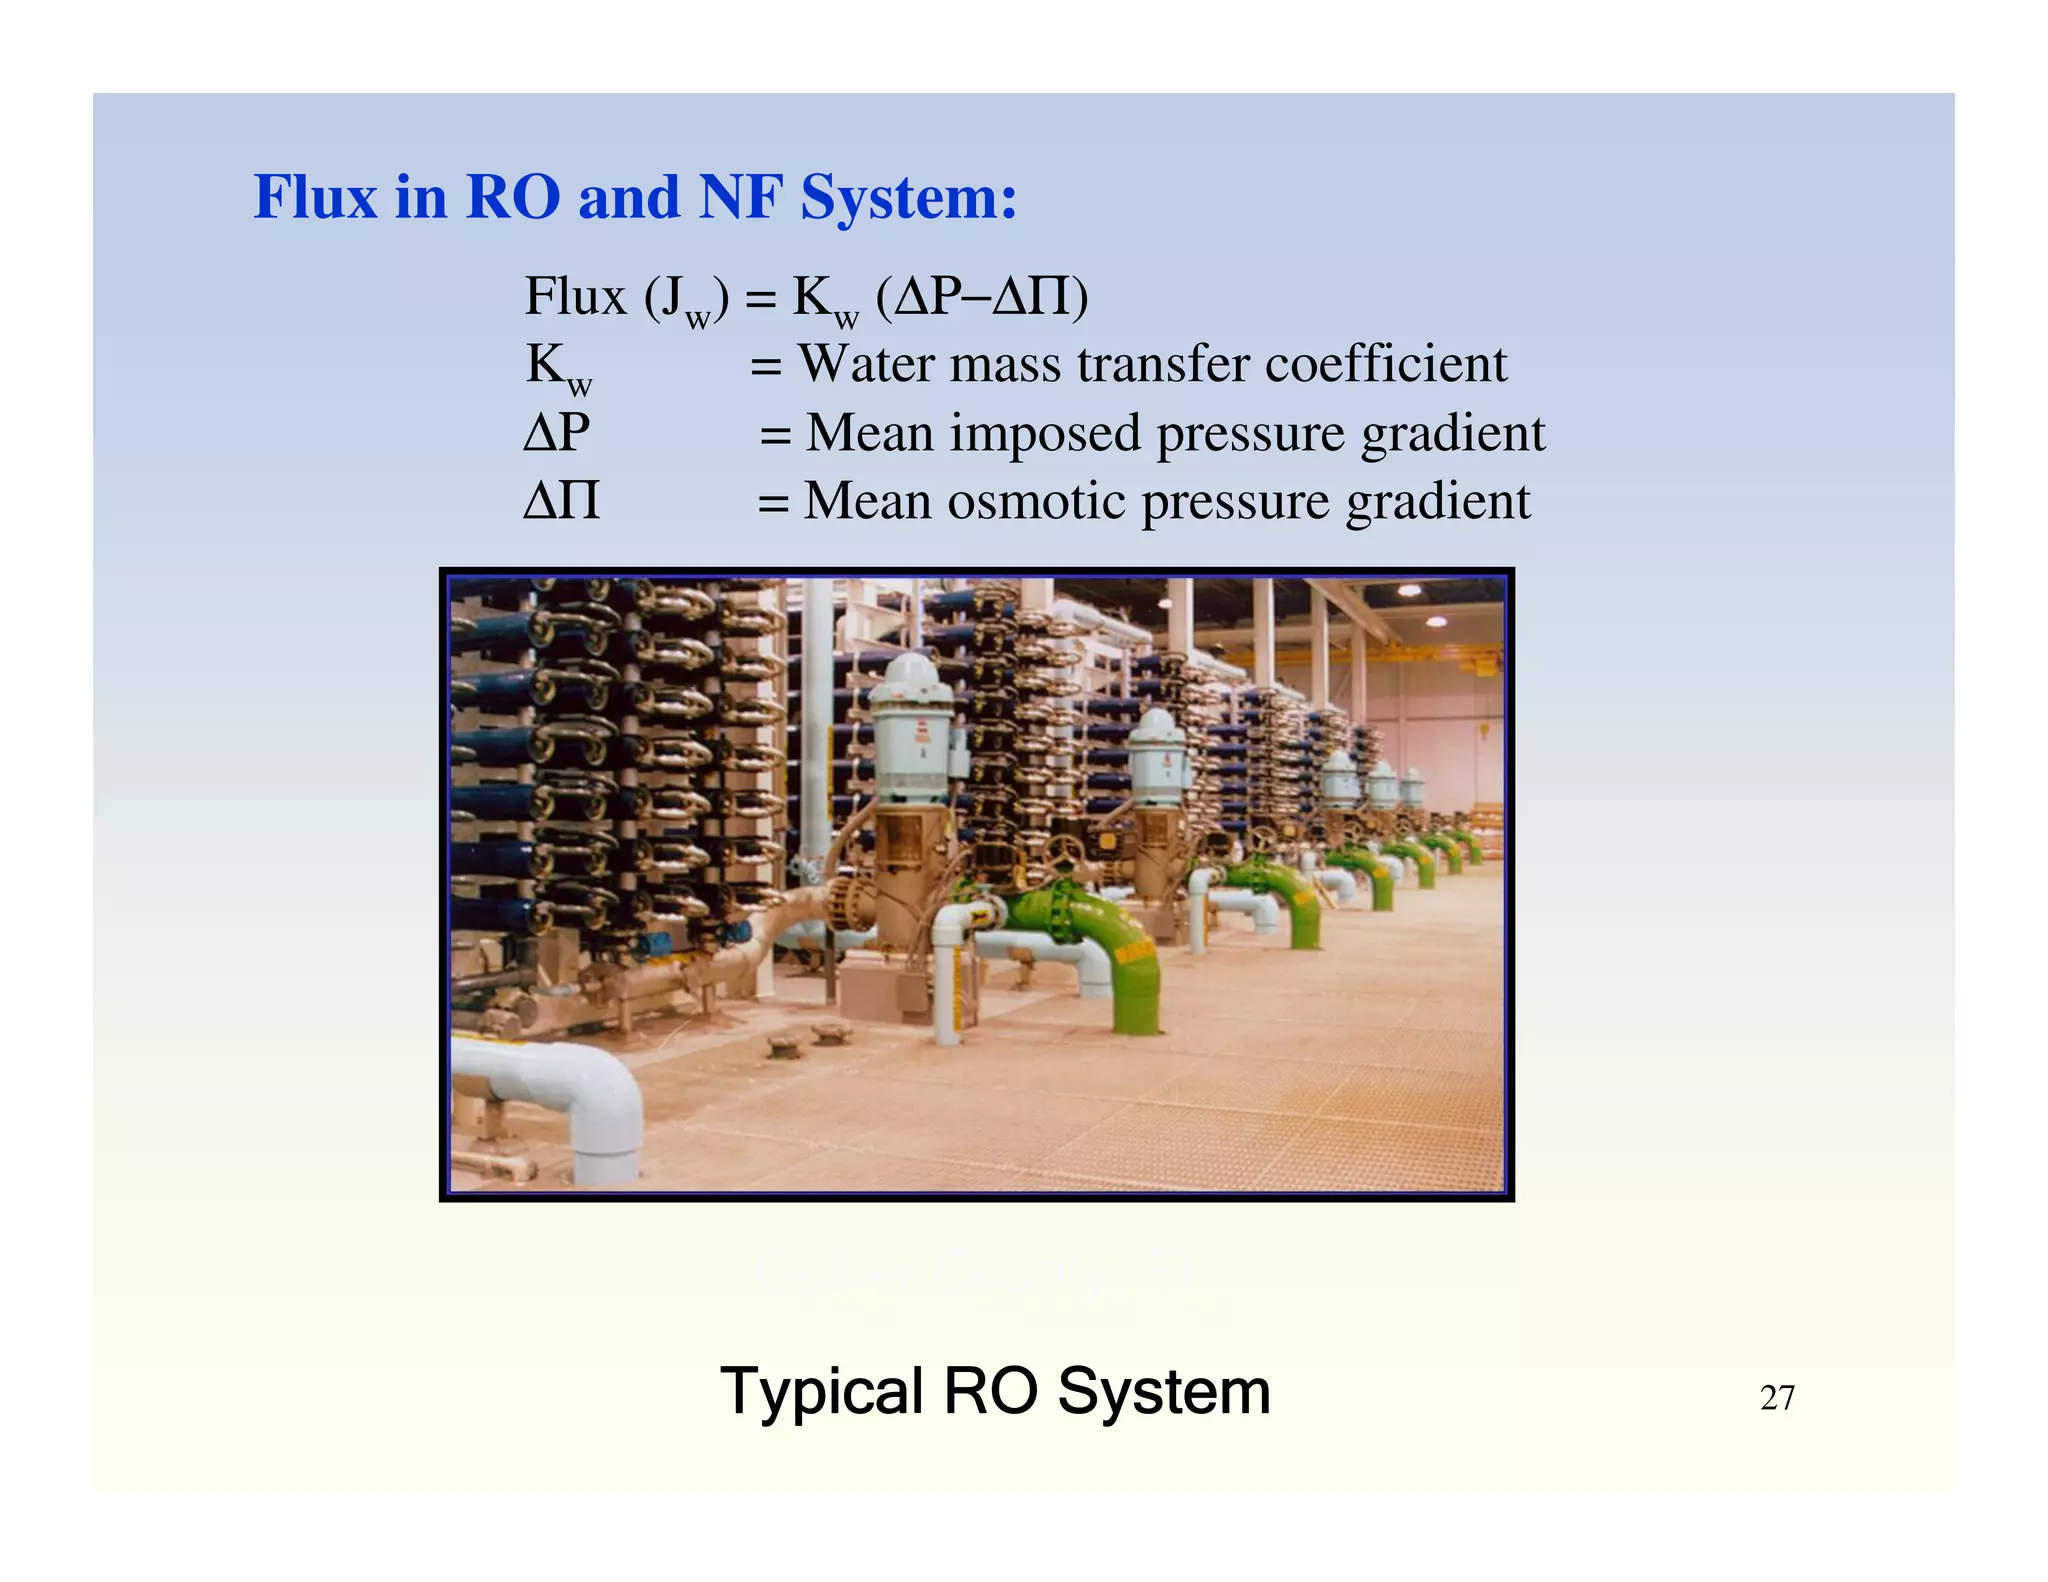

Membrane separation processes have been widely used for wastewater treatment due to their advantages over conventional processes. Key membrane processes for wastewater treatment include microfiltration, ultrafiltration, nanofiltration, reverse osmosis, and membrane bioreactors. These processes provide high quality treated water with low capital and operating costs due to their compact size and ability to automate. However, membrane fouling remains a challenge that can reduce membrane performance over time.


