Downloaded 105 times

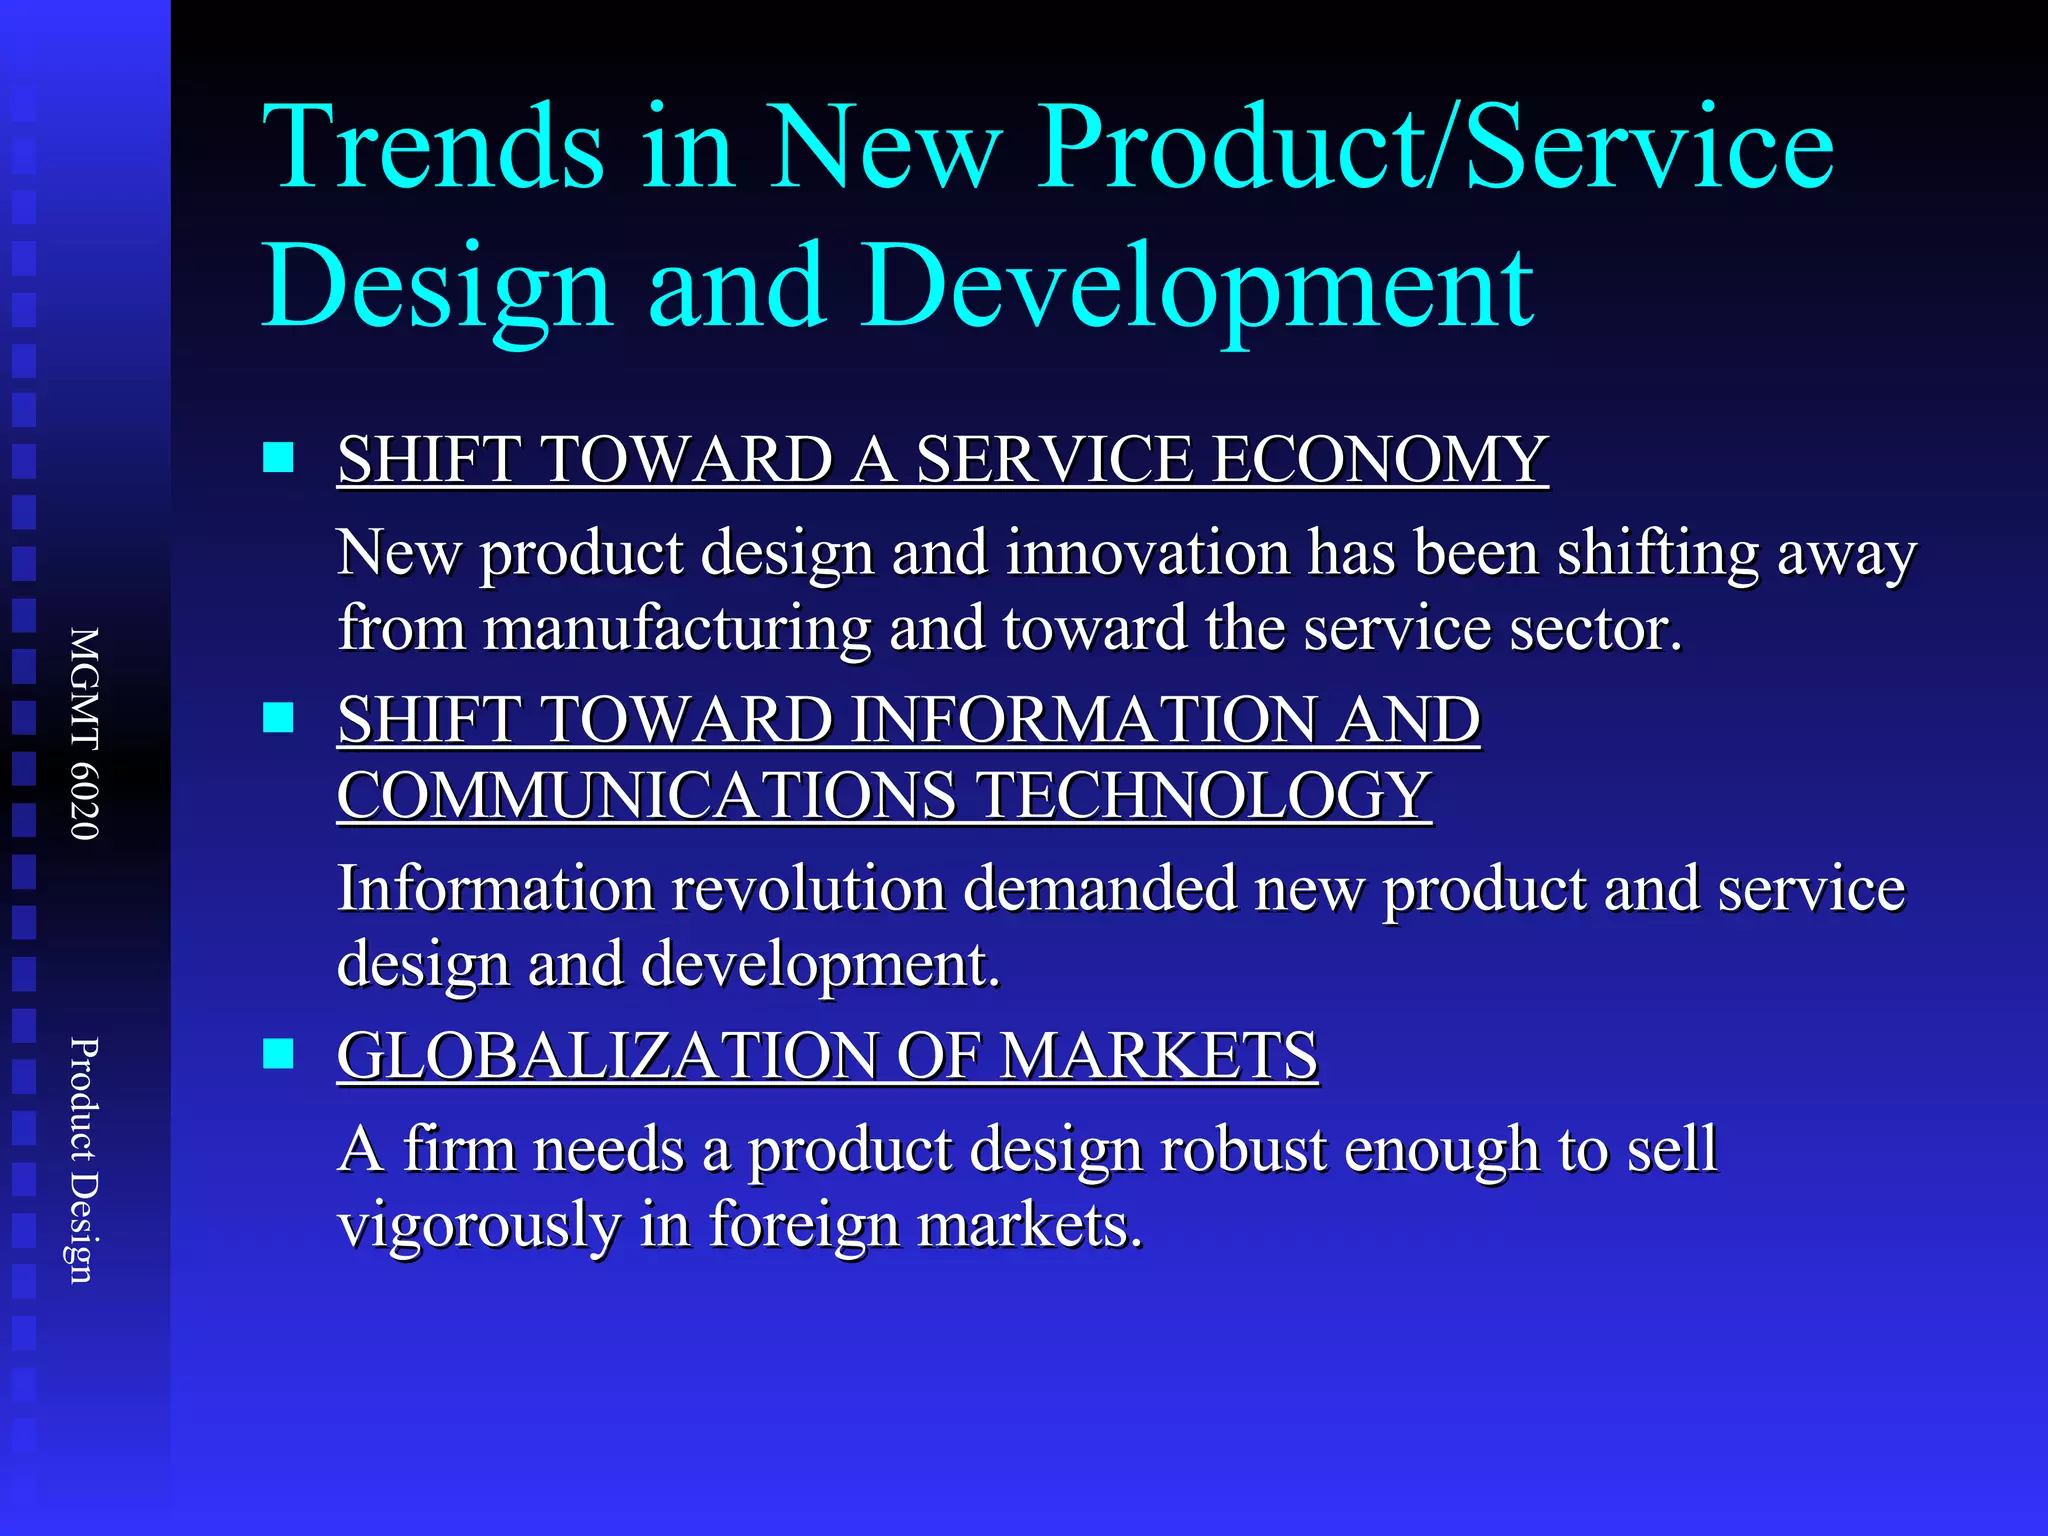


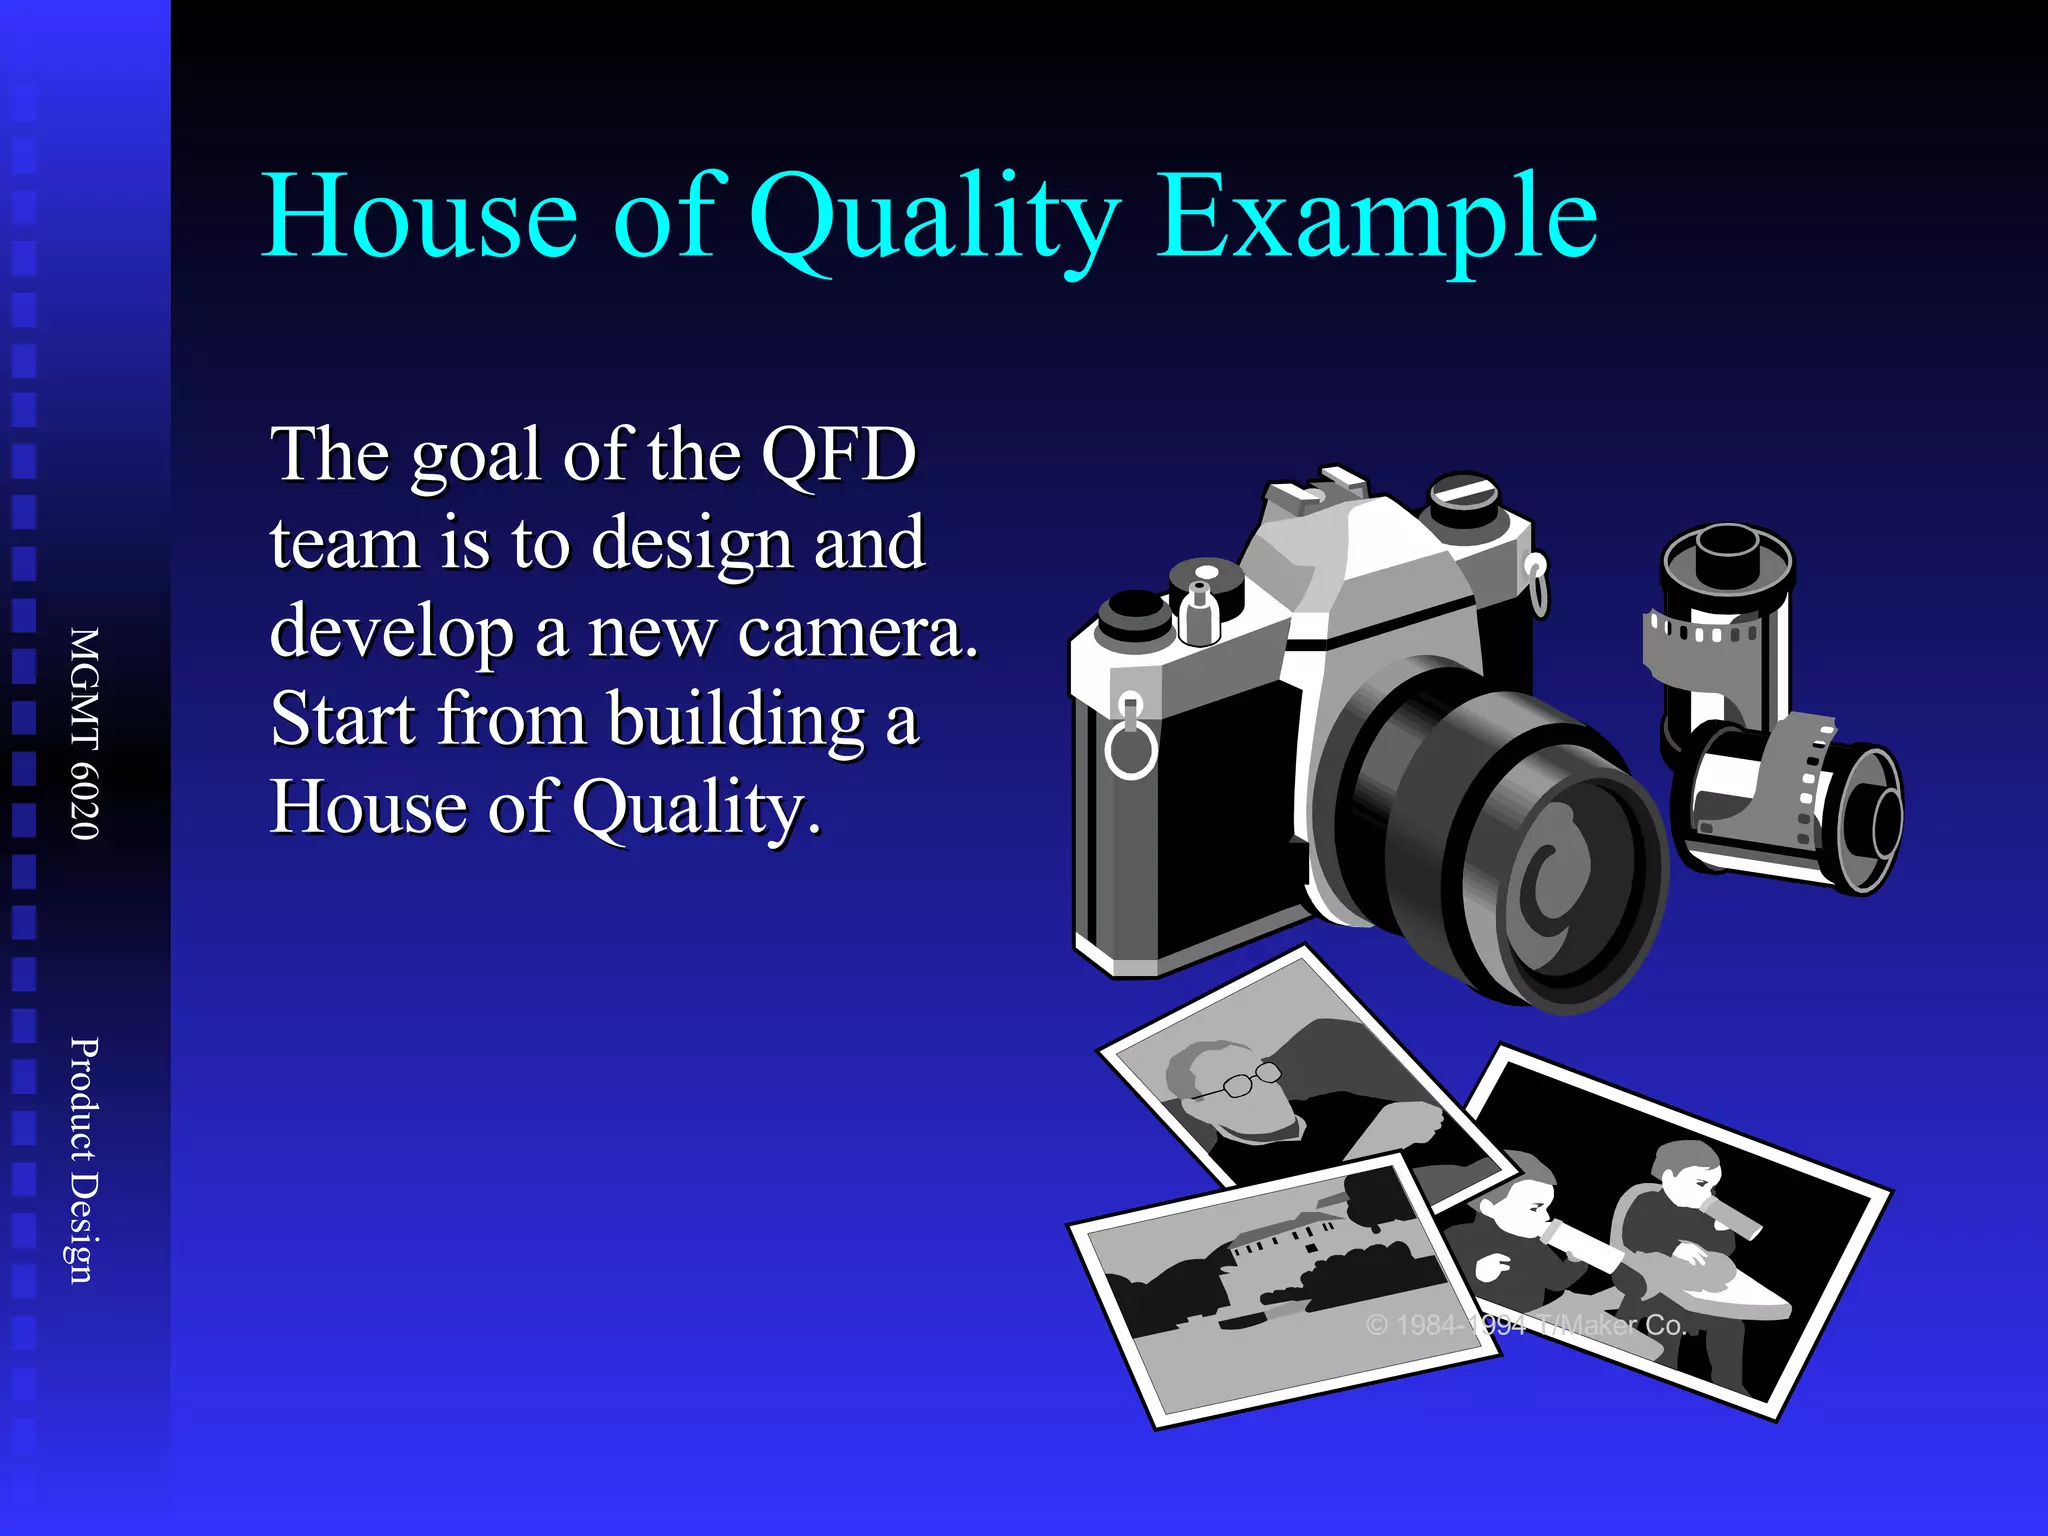


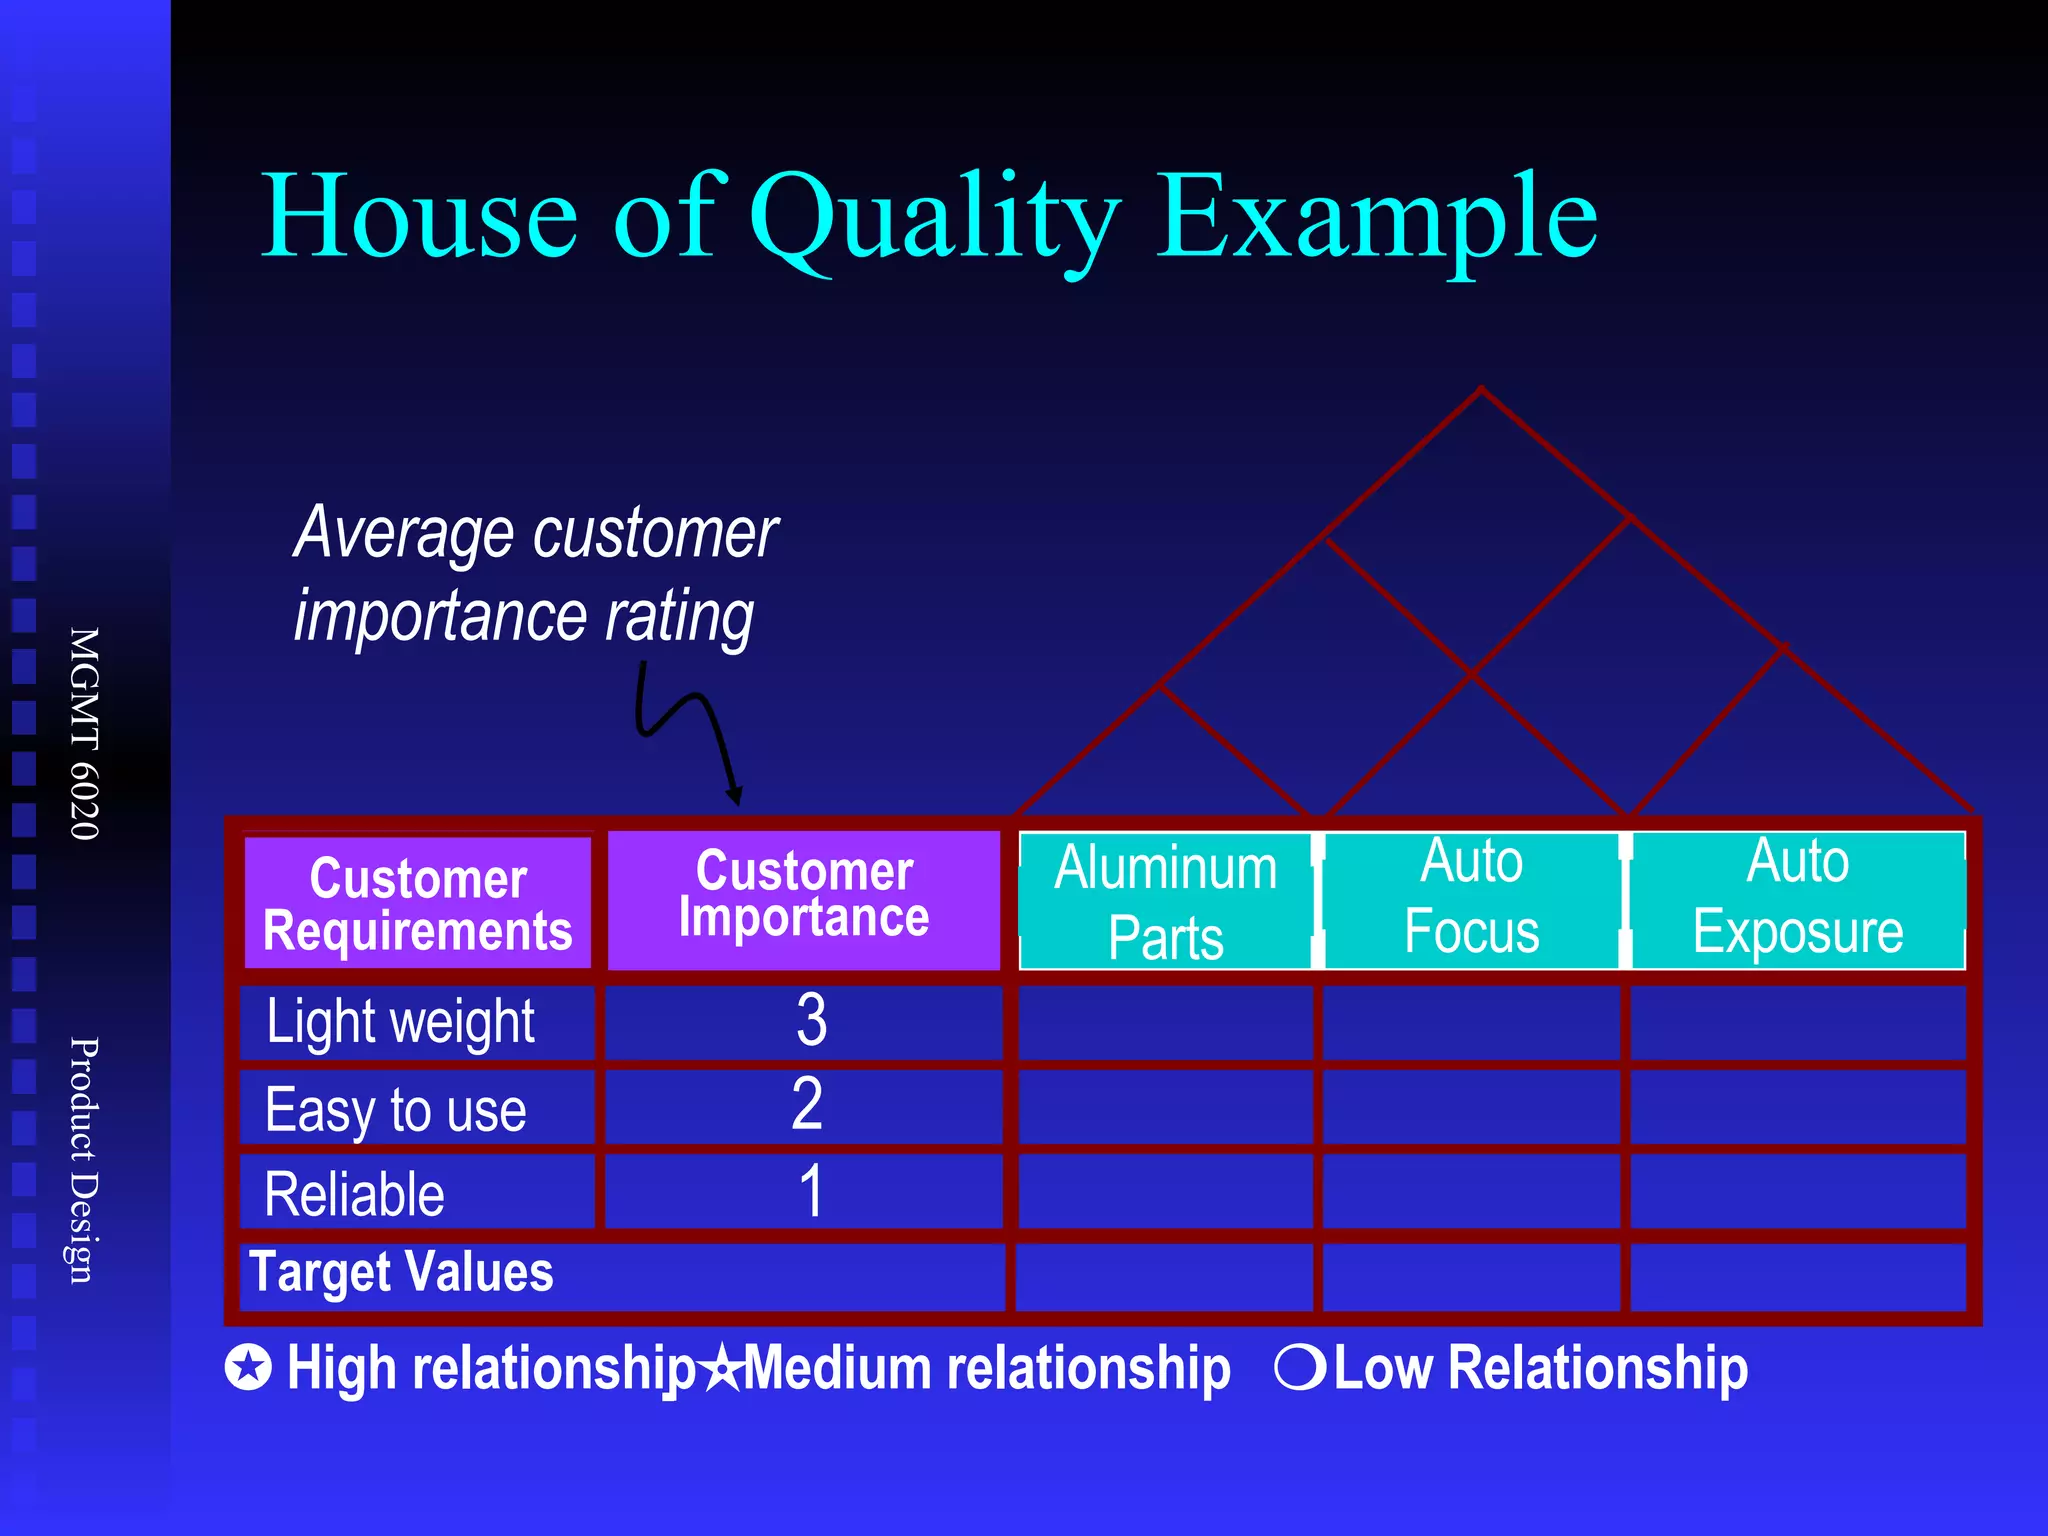

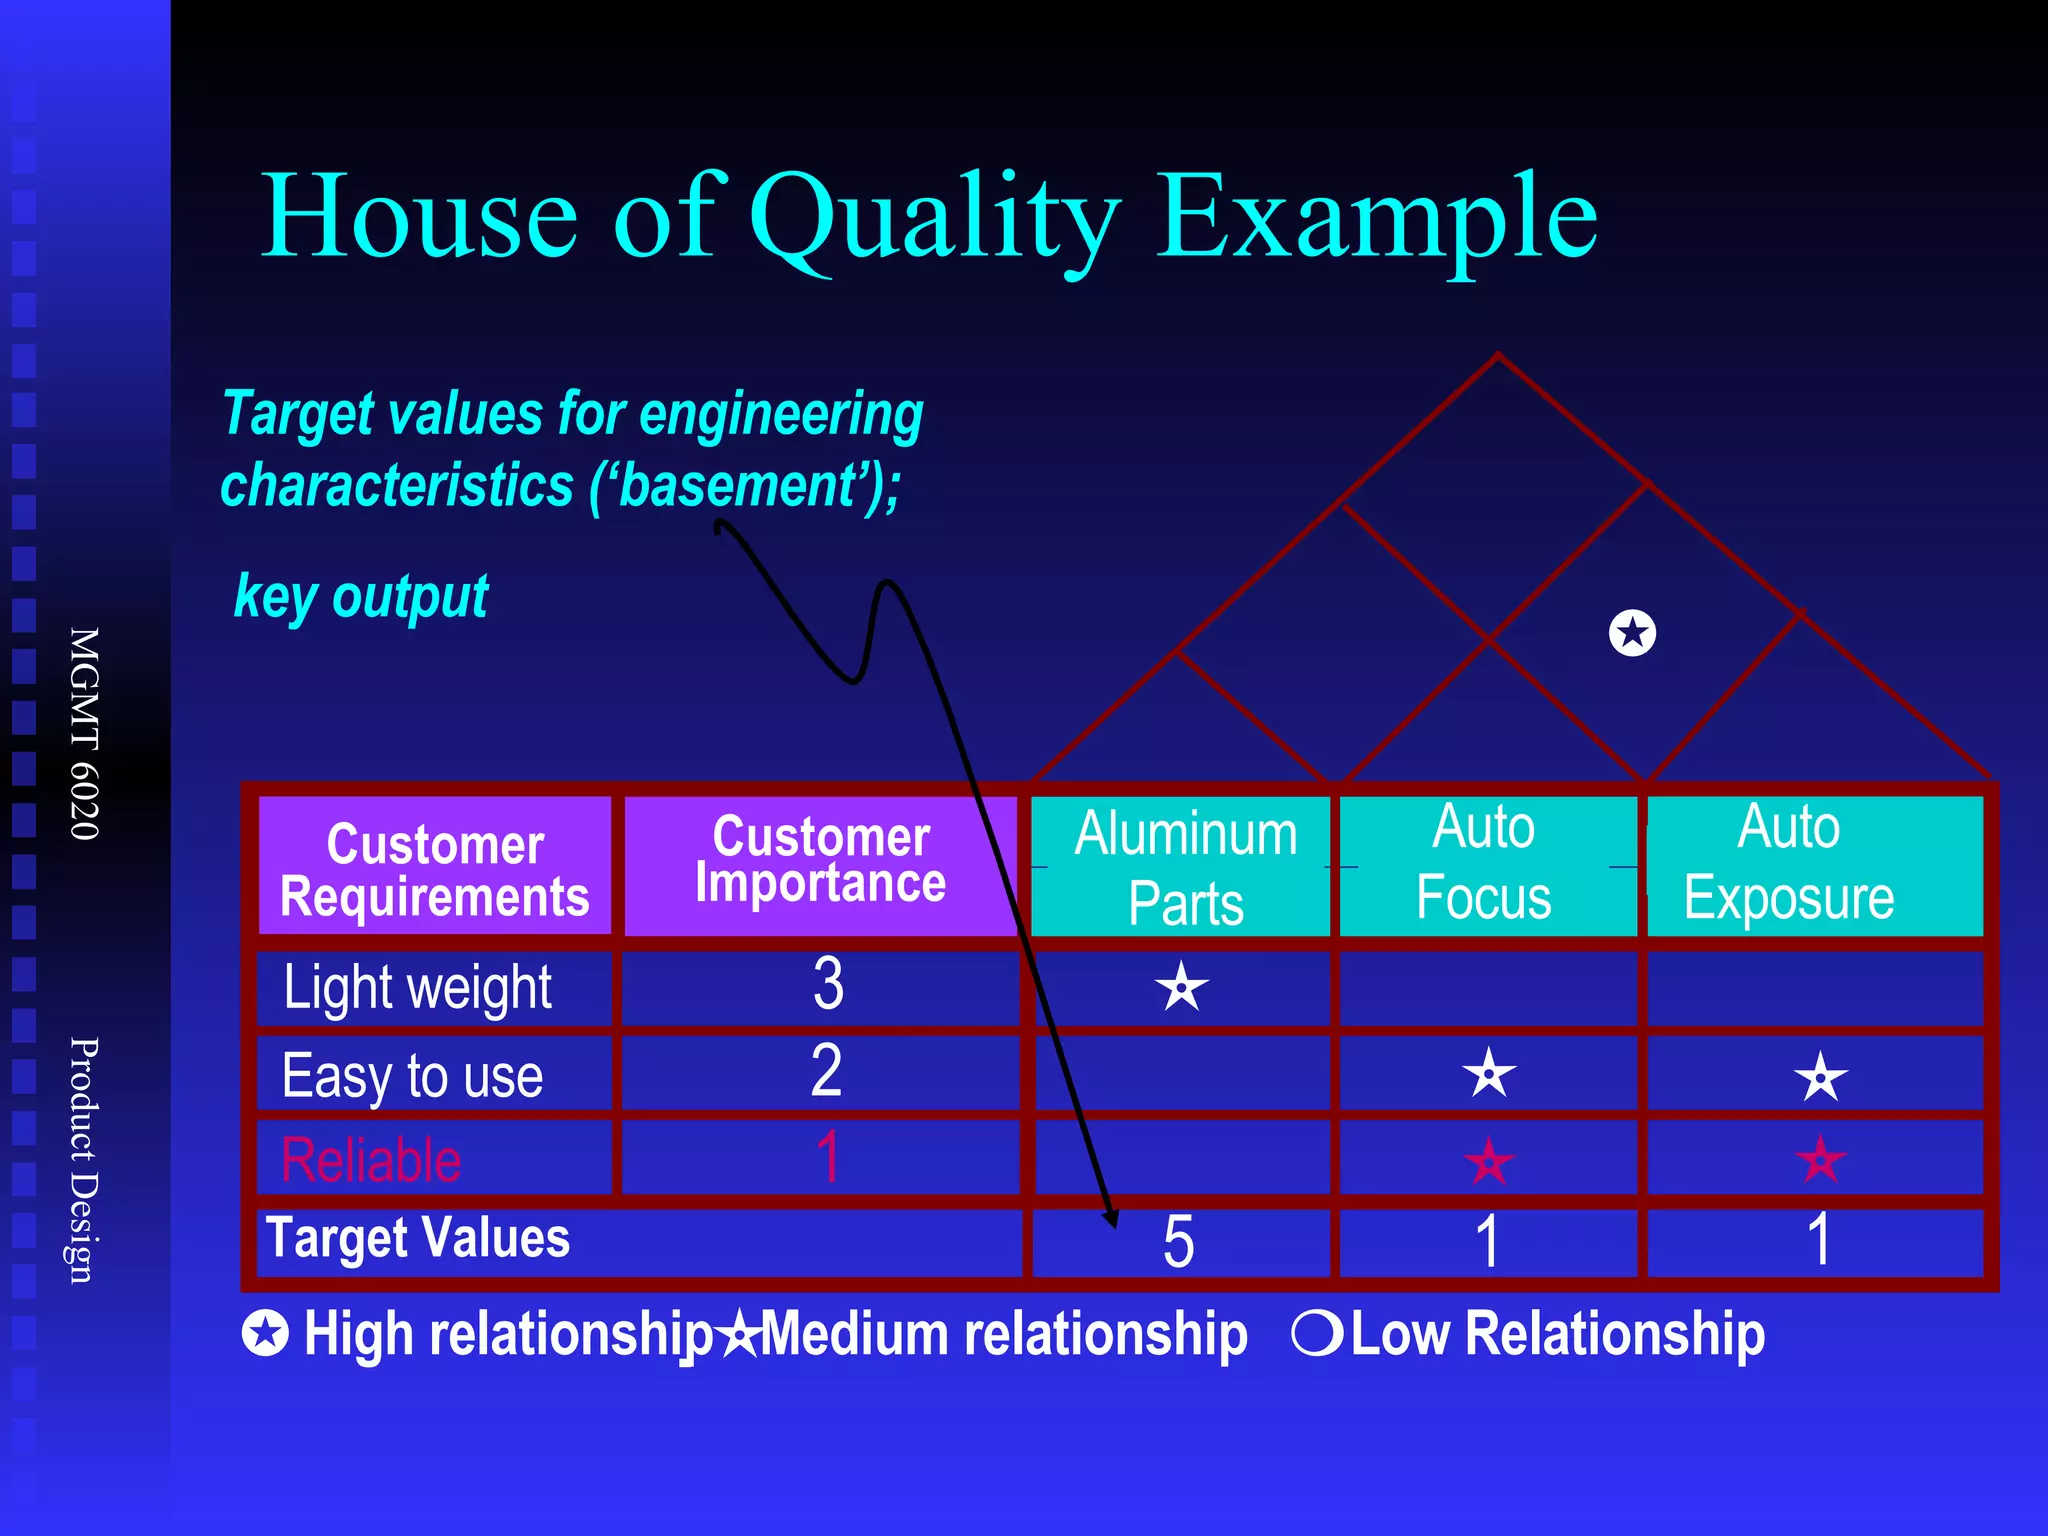


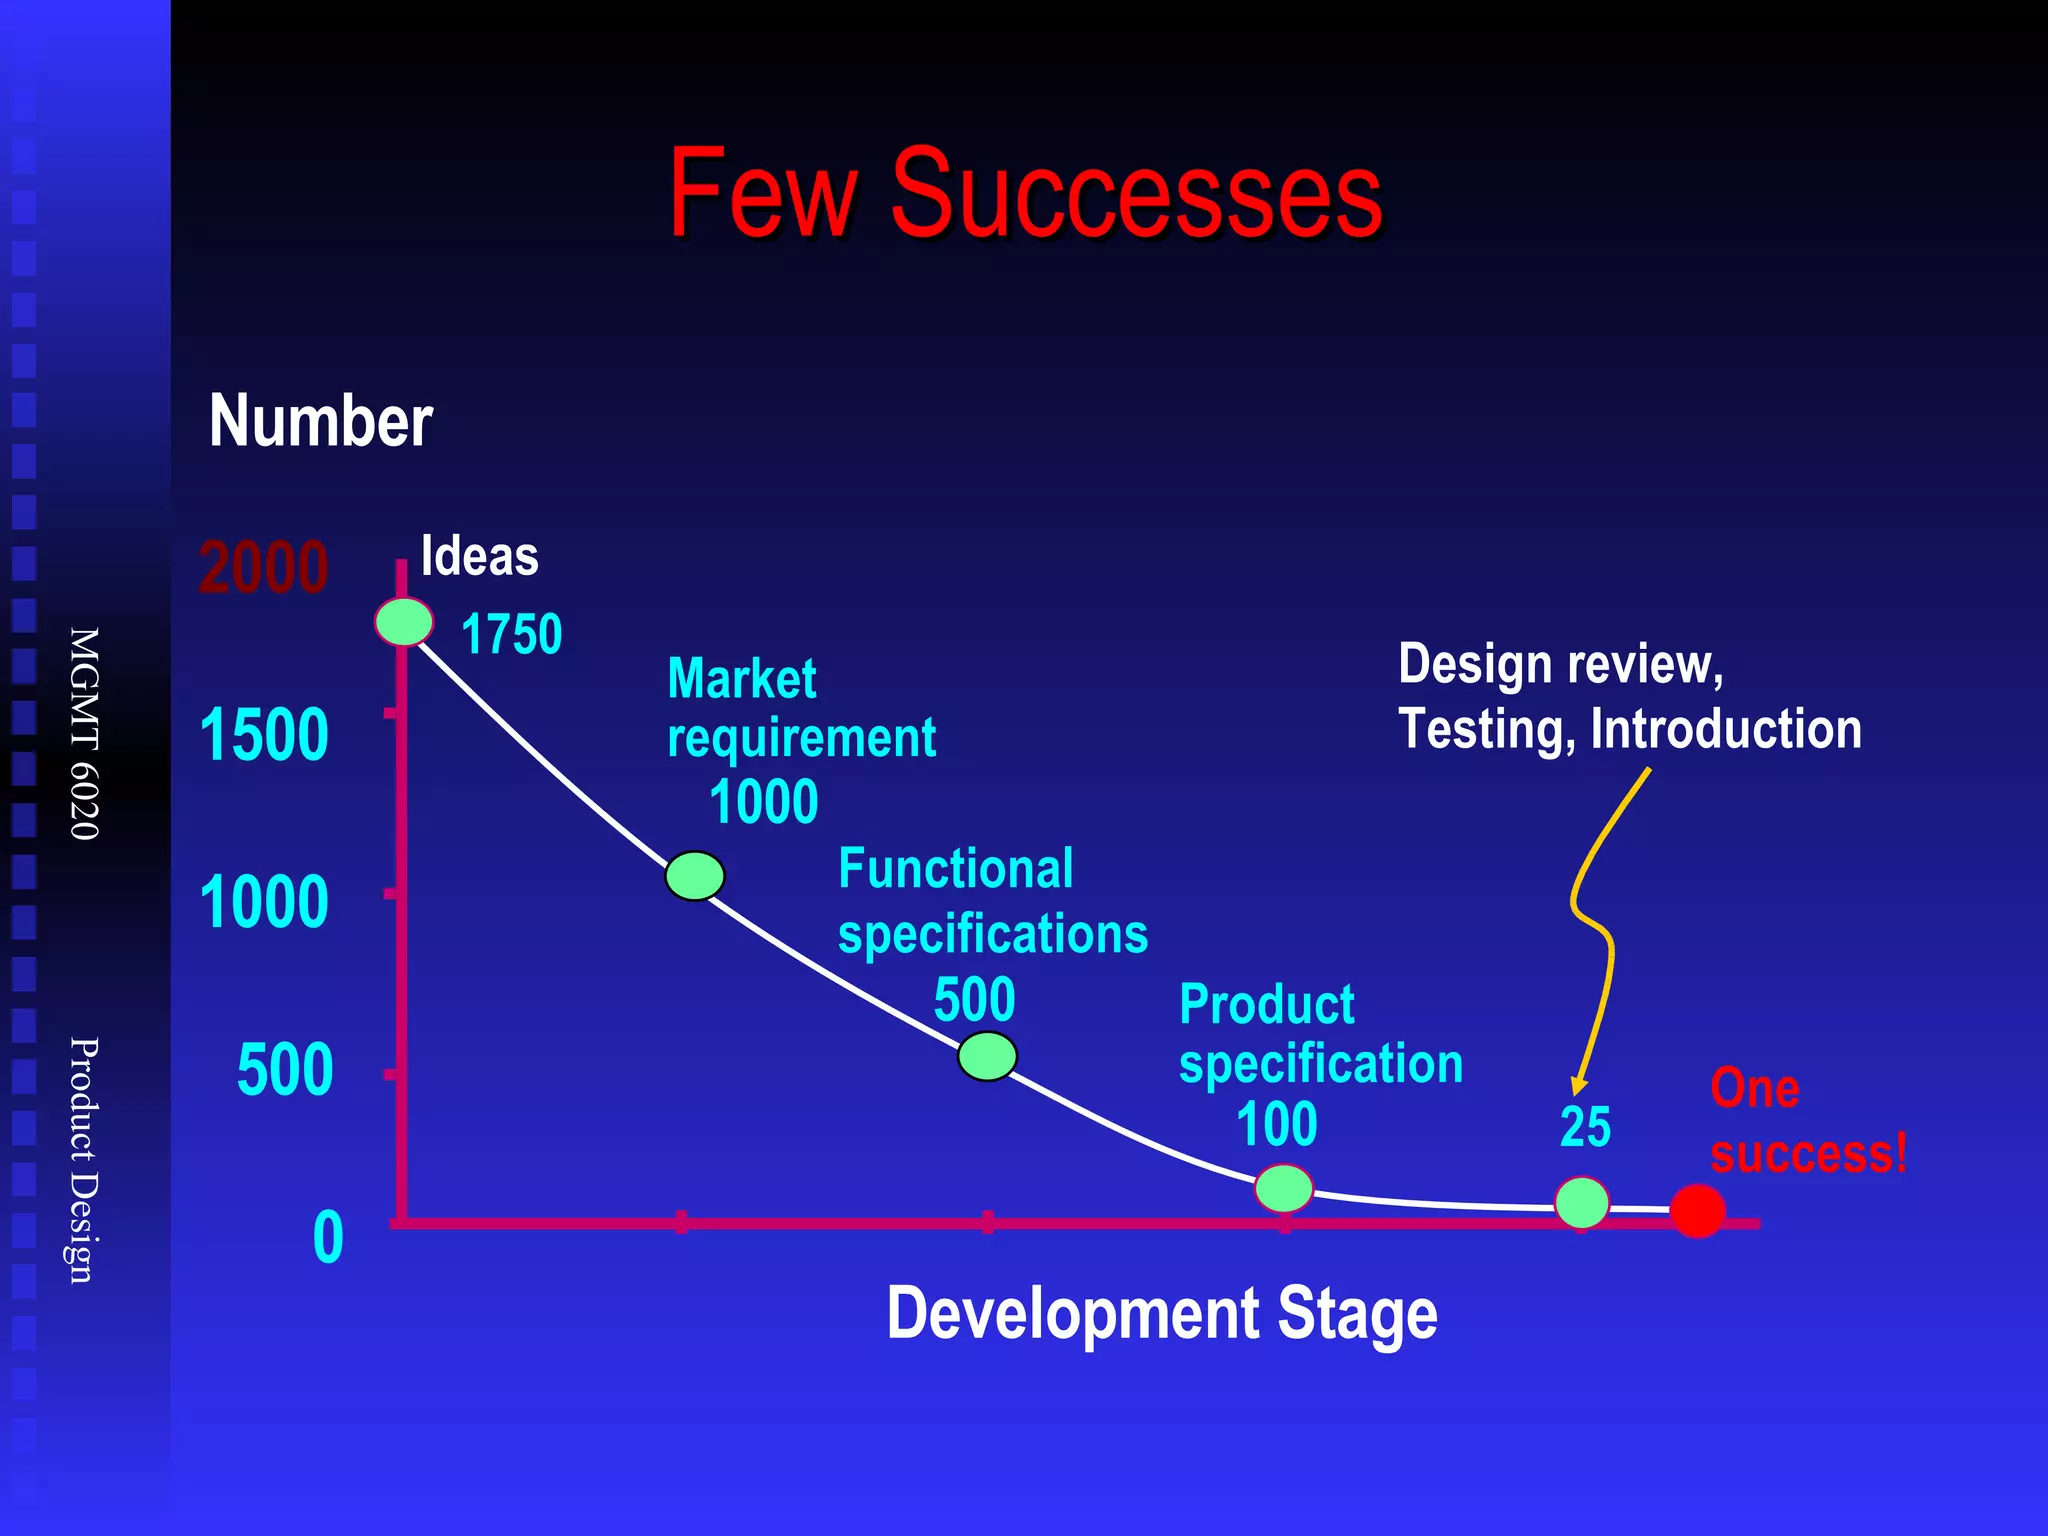


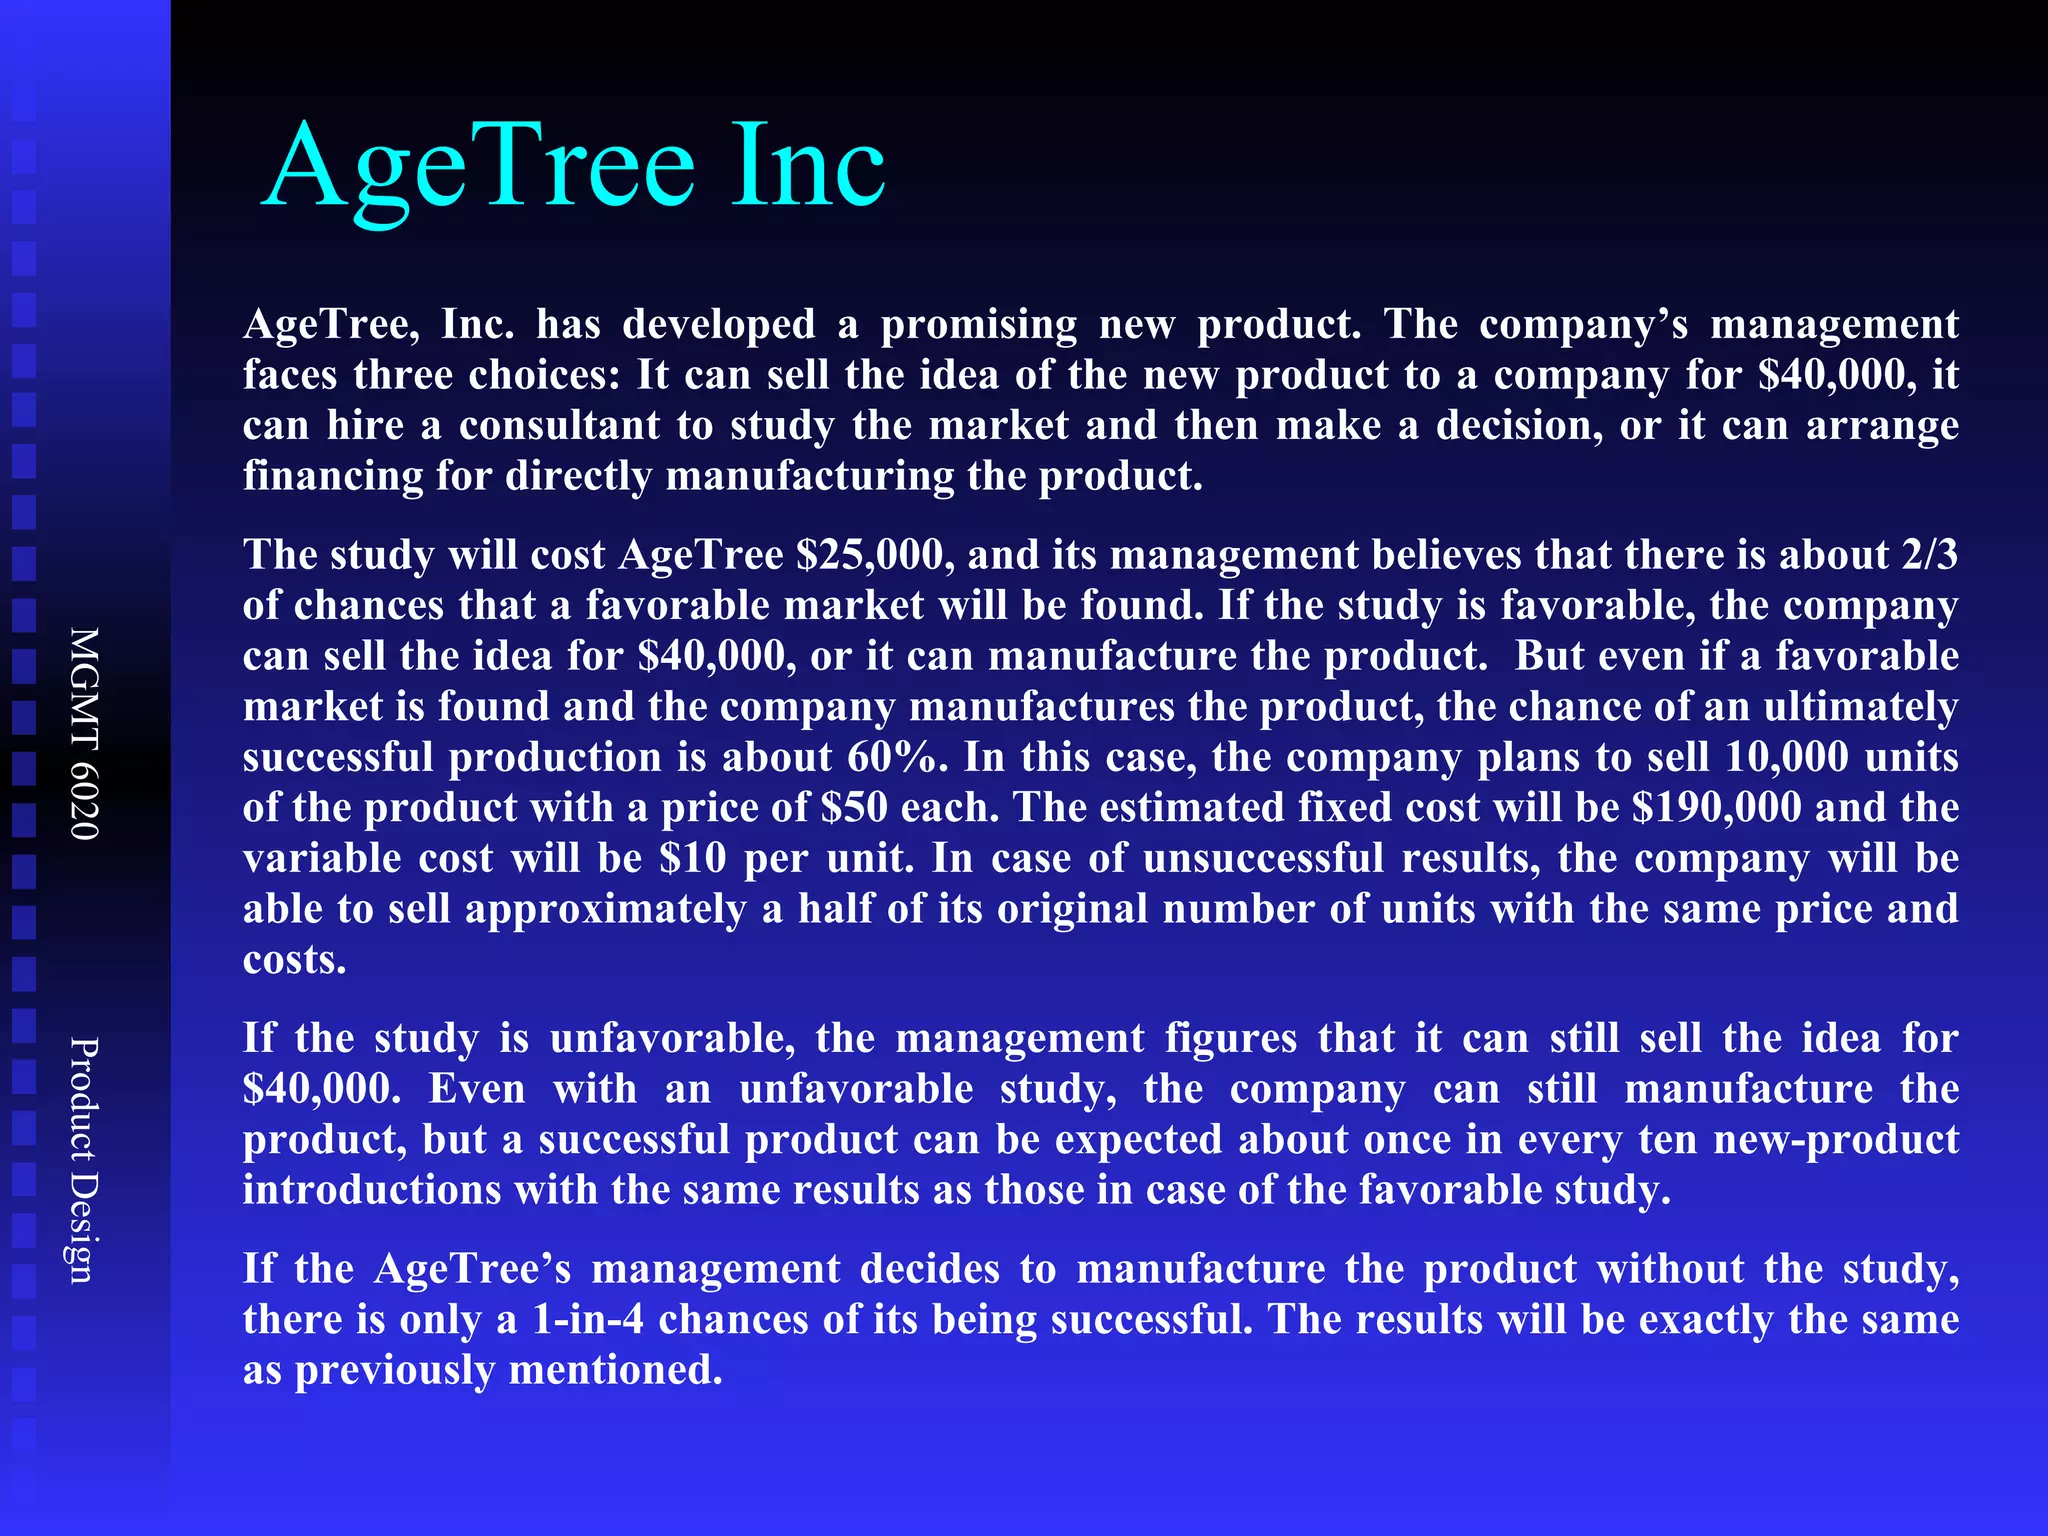


The document provides information about designing new products and services. It discusses trends in product design such as a shift toward services and information technology. It also covers product life cycles and strategies for different stages. The document presents methods for managing design processes, including concurrent engineering. It provides an example of quality function deployment to translate customer wants into product characteristics. Finally, it discusses tools for decision making in product design, including using a decision tree to analyze introducing a new product.