Probability Distribution
•Download as PPTX, PDF•
0 likes•64 views
Defining Probability Distribution, broad categories of Probability Distributions and observing three practical, real applications of Probability Distribution.
Report
Share
Report
Share

Recommended
Data analysis
This document discusses preliminary data analysis techniques. It begins by explaining that data analysis is done to make sense of collected data. The basic steps of preliminary analysis are editing, coding, and tabulating data. Editing involves checking for errors and inconsistencies. Coding transforms raw data into numerical codes for analysis. Tabulation involves counting how many cases fall into each coded category. Examples of tabulations like simple counts and cross-tabulations are provided to show relationships between variables. Preliminary analysis helps detect errors and develop hypotheses for further statistical testing.
Graphs (Biostatistics)
We have prepared a presentation on different types of graphs of Biostatistics and Research Methodology
Probability introduction for non-math people
Probability distributions describe the likelihood of different outcomes and how that likelihood may change based on various factors. Understanding basic probability concepts such as events, outcomes, and how to calculate probabilities is important for interpreting machine learning results, even without advanced math knowledge. Common probability distributions include the binomial, normal, and exponential distributions. The appropriate distribution depends on factors like whether outcomes are continuous or discrete, and whether trials are independent or related.
Types of variables and descriptive statistics
Beginner's Course for Biostatistics using SPSS and Excel
TamingStatistics
This document discusses using operators in APL to perform statistical analysis. It proposes defining operators that take statistical functions or distributions as left operands and relations as right operands. This reduces the number of functions needed compared to other languages. Examples of operators include probability, criticalValue, and hypothesis. Sample data can be represented as raw values, frequencies, or summary statistics, making them interchangeable for the operators. The TamingStatistics namespace implements this approach in APL.
Applications of statistics in daily life
Statistics is used to analyze and interpret collected data using measures like the mean, median, and mode. The mean is the average and is used by teachers to analyze student marks and by businesses to examine employee salaries and benefits. The median is the middle value and is used to analyze income distribution and player heights. The mode is the most frequent value and is used to study public transportation usage and the number of patients visiting hospitals. These statistical concepts have various applications in everyday life and business to understand data distributions and make comparisons.
Basic Statistics & Data Analysis
Statistics is the methodology used to interpret and draw conclusions from collected data. It provides methods for designing research studies, summarizing and exploring data, and making predictions about phenomena represented by the data. A population is the set of all individuals of interest, while a sample is a subset of individuals from the population used for measurements. Parameters describe characteristics of the entire population, while statistics describe characteristics of a sample and can be used to infer parameters. Basic descriptive statistics used to summarize samples include the mean, standard deviation, and variance, which measure central tendency, spread, and how far data points are from the mean, respectively. The goal of statistical data analysis is to gain understanding from data through defined steps.
Descriptive statistics
What are descriptive Statistics, Types of statistics and its implications.
graphs, tables, variation, mean mode median, central tendency,
Descriptive Statistics
This document discusses descriptive and inferential statistics. Descriptive statistics are used to analyze and represent previously collected data through measures like frequency, range, mean, mode, and standard deviation. Variables can be nominal, ordinal, or interval. Inferential statistics are used to draw conclusions and make predictions based on descriptive statistics. Key concepts in inferential statistics include experiments, probability, population, sampling, and hypothesis testing.
QUANTITAIVE DATA ANALYSIS
This document discusses quantitative data analysis and descriptive and inferential statistics. It provides the following key points:
- Quantitative data is measured numerically along a scale and reported as scores or other numeric values. Descriptive statistics summarize and describe quantitative data.
- Descriptive statistics include numerical summaries that measure central tendency and variability of data, as well as graphical summaries like histograms. They characterize data without generalizing beyond the sample.
- Inferential statistics allow inferences about populations based on samples. Methods include hypothesis testing, regression, and principle components analysis. Hypothesis testing involves stating and evaluating null and alternative hypotheses using sample data and test statistics.
- Descriptive statistics simply describe or characterize sample data, while inferential
Mann Whitney U Test | Statistics
The Mann Witney U Test in statistics is related to a testing without considering any assumption as to the parameters of frequently distributed of a valueless hypothesis. It is similar to the value selected randomly from one sample, can be higher than or lesser than a value selected randomly from a second sample. Copy the link given below and paste it in new browser window to get more information on Mann Whitney U Test:- http://www.transtutors.com/homework-help/statistics/mann-whitney-u-test.aspx
Introduction to Business Statistics
Here are some common sources of primary and secondary data:
Primary data sources:
- Surveys (questionnaires, interviews)
- Experiments
- Observations
- Focus groups
Secondary data sources:
- Government data (census data, vital statistics)
- Published research studies
- Organizational records and documents
- Media reports
- Commercial data providers
3.5 Exploratory Data Analysis
This document discusses exploratory data analysis techniques including boxplots and five-number summaries. It explains how to organize and graph data using histograms, frequency polygons, stem-and-leaf plots, and box-and-whisker plots. The five important values used in a boxplot are the minimum, first quartile, median, third quartile, and maximum. An example constructs a boxplot for a stockbroker's daily client numbers over 11 days.
Factor Analysis
Factor analysis is a technique used to summarize a large set of variables by identifying underlying factors that explain their interrelationships. It involves constructing a correlation matrix between variables and using statistical methods like principal component analysis or common factor analysis to determine the number of factors needed to account for the variance within the data. The factors are then rotated and interpreted based on which original variables have the highest loadings on each factor. Factor analysis can reduce variables, validate scales, and select subsets of important variables.
Descriptive & inferential statistics presentation 2
The document discusses descriptive and inferential statistics in the context of knowledge management. Descriptive statistics summarize and describe data, measuring central tendency, distribution, and variables. They are used in knowledge management for risk management, evaluation, and review. Inferential statistics make predictions and judgments about populations based on data samples, accounting for chance. They are used in knowledge management for decisions, predictions, assumptions, and forecasts. Together, descriptive and inferential statistics help evaluate knowledge management strategy implementation and reveal its value and return on investment.
Areas In Statistics
Information about these areas in statistics: descriptive statistics, inferential statistics and regression.
Statistics
Descriptive statistics are used to describe data, while inferential statistics allow inferences to be made about a population based on a sample. Descriptive statistics include measures of central tendency like the mean, median, and mode as well as measures of variability such as range, variance, and standard deviation. Inferential statistics comprise techniques like estimation, hypothesis testing, prediction, and regression. Estimation involves calculating point estimates and intervals to estimate unknown population parameters. Hypothesis testing structures a dilemma to test hypotheses against sample data. Prediction forecasts future observations based on past data. Regression models the relationship between variables as a linear function.
Statistics
Descriptive statistics are used to describe data, while inferential statistics allow inferences to be made about a population based on a sample. Descriptive statistics include measures of central tendency like the mean, median, and mode as well as measures of variability such as range, variance, and standard deviation. Inferential statistics comprise techniques like estimation, hypothesis testing, prediction, and regression. Estimation involves calculating point estimates and intervals to estimate unknown population parameters. Hypothesis testing structures hypotheses to test using statistical tests and significance levels. Prediction forecasts future observations based on past data, while regression models relationships between variables.
Statistical treatment of data
Frequency and percentage distributions organize raw data by counting observations within each data point or group. Weighted means calculate averages where some data points contribute more weight than others. Statistical treatment of data through methods like these is essential to appropriately analyze data and draw valid conclusions from experiments.
Chapter#9
This document discusses statistical quality control and descriptive statistics. It explains that statistical quality control uses statistical methods to assess product or process quality, and was an important tool for Japan's automobile industry success. Descriptive statistics involves organizing, summarizing, and presenting data, and has measures for central tendency (mean, median, mode) and variation (standard deviation, variance). Examples are provided to demonstrate calculating these descriptive statistics. Histograms and normal distributions are also covered.
Malimu descriptive statistics.
Descriptive statistics are used to summarize and describe characteristics of a data set. They include measures of central tendency like the mean, median, and mode as well as measures of variability such as range, standard deviation, and variance. Descriptive statistics help analyze and understand patterns in data through tables, charts, and summaries without drawing inferences about the underlying population.
Exploratory data analysis project
This document summarizes an exploratory data analysis project on a credit card application dataset. The analysis involved examining relationships between variables, identifying variables that best distinguish between positive and negative application outcomes, and calculating statistical metrics. Key variables like A2, A3, A8, and A14 showed differences in distributions between positive and negative classes. Correlation and R-squared analyses revealed that variables A2, A3, A8, and A11 explained the most variance in the classification variable. The analysis uncovered useful insights that will help build an effective predictive model.
Statistics for data science
The document provides an overview of statistics for data science. It introduces key concepts including descriptive versus inferential statistics, different types of variables and data, probability distributions, and statistical analysis methods. Descriptive statistics are used to describe data through measures of central tendency, variability, and visualization techniques. Inferential statistics enable drawing conclusions about populations from samples using hypothesis testing, confidence intervals, and regression analysis.
Business Statistics
This course introduces students to statistical techniques for business decision making. Students will learn to analyze and present business data using appropriate software and statistical tools. Topics covered include descriptive statistics, probability, sampling, hypothesis testing, regression analysis, and comparing means of two and three groups. Assessments include a midterm, project, and final exam. Statistics are used to organize and analyze information to make it more easily understood, allowing judgments about the world. Descriptive statistics describe characteristics of data sets, while inferential statistics allow inferences about populations from data samples.
Data analysis and Interpretation
This document discusses various statistical analysis techniques used in marketing research. It begins by explaining how to bring raw data into order through arrays, tabulations and establishing categories. It then discusses descriptive, inferential, differences, associative and predictive analysis. The document also covers univariate techniques like t-tests, z-tests, ANOVA, chi-square tests and multivariate techniques like regression, conjoint analysis and cluster analysis. It provides guidance on when to use specific statistical tests and covers statistics used in cross-tabulation like phi coefficient, contingency coefficient and Cramer's V.
Descriptive and Inferential Statistics
The two major areas of statistics are: descriptive statistics and inferential statistics. In this presentation, the difference between the two are shown including examples.
Basic probability theory and statistics
This presentation guide you through Basic Probability Theory and Statistics, those are Random Experiment, Sample Space, Random Variables, Probability, Conditional Probability, Variance, Probability Distribution, Joint Probability Distribution, Conditional Probability Distribution (CPD) and Factor.
For more topics stay tuned with Learnbay.
AP Statistic and Probability 6.1 (1).ppt
The document summarizes key concepts about discrete and continuous random variables from Chapter 6 of The Practice of Statistics textbook. It defines discrete and continuous random variables and their probability distributions. It also explains how to calculate the mean, standard deviation, and probabilities of events for both discrete and continuous random variables. For example, it shows how to find the probability that a randomly chosen woman is between 68 and 70 inches tall using the normal distribution.
Data science
Here are the key differences between supervised and unsupervised learning:
Supervised Learning:
- Uses labeled examples/data to learn. The labels provide correct answers for the learning algorithm.
- The goal is to build a model that maps inputs to outputs based on example input-output pairs.
- Common algorithms include linear/logistic regression, decision trees, k-nearest neighbors, SVM, neural networks.
- Used for classification and regression predictive problems.
Unsupervised Learning:
- Uses unlabeled data where there are no correct answers provided.
- The goal is to find hidden patterns or grouping in the data.
- Common algorithms include clustering, association rule learning, self-organizing maps.
-
More Related Content
What's hot
Descriptive Statistics
This document discusses descriptive and inferential statistics. Descriptive statistics are used to analyze and represent previously collected data through measures like frequency, range, mean, mode, and standard deviation. Variables can be nominal, ordinal, or interval. Inferential statistics are used to draw conclusions and make predictions based on descriptive statistics. Key concepts in inferential statistics include experiments, probability, population, sampling, and hypothesis testing.
QUANTITAIVE DATA ANALYSIS
This document discusses quantitative data analysis and descriptive and inferential statistics. It provides the following key points:
- Quantitative data is measured numerically along a scale and reported as scores or other numeric values. Descriptive statistics summarize and describe quantitative data.
- Descriptive statistics include numerical summaries that measure central tendency and variability of data, as well as graphical summaries like histograms. They characterize data without generalizing beyond the sample.
- Inferential statistics allow inferences about populations based on samples. Methods include hypothesis testing, regression, and principle components analysis. Hypothesis testing involves stating and evaluating null and alternative hypotheses using sample data and test statistics.
- Descriptive statistics simply describe or characterize sample data, while inferential
Mann Whitney U Test | Statistics
The Mann Witney U Test in statistics is related to a testing without considering any assumption as to the parameters of frequently distributed of a valueless hypothesis. It is similar to the value selected randomly from one sample, can be higher than or lesser than a value selected randomly from a second sample. Copy the link given below and paste it in new browser window to get more information on Mann Whitney U Test:- http://www.transtutors.com/homework-help/statistics/mann-whitney-u-test.aspx
Introduction to Business Statistics
Here are some common sources of primary and secondary data:
Primary data sources:
- Surveys (questionnaires, interviews)
- Experiments
- Observations
- Focus groups
Secondary data sources:
- Government data (census data, vital statistics)
- Published research studies
- Organizational records and documents
- Media reports
- Commercial data providers
3.5 Exploratory Data Analysis
This document discusses exploratory data analysis techniques including boxplots and five-number summaries. It explains how to organize and graph data using histograms, frequency polygons, stem-and-leaf plots, and box-and-whisker plots. The five important values used in a boxplot are the minimum, first quartile, median, third quartile, and maximum. An example constructs a boxplot for a stockbroker's daily client numbers over 11 days.
Factor Analysis
Factor analysis is a technique used to summarize a large set of variables by identifying underlying factors that explain their interrelationships. It involves constructing a correlation matrix between variables and using statistical methods like principal component analysis or common factor analysis to determine the number of factors needed to account for the variance within the data. The factors are then rotated and interpreted based on which original variables have the highest loadings on each factor. Factor analysis can reduce variables, validate scales, and select subsets of important variables.
Descriptive & inferential statistics presentation 2
The document discusses descriptive and inferential statistics in the context of knowledge management. Descriptive statistics summarize and describe data, measuring central tendency, distribution, and variables. They are used in knowledge management for risk management, evaluation, and review. Inferential statistics make predictions and judgments about populations based on data samples, accounting for chance. They are used in knowledge management for decisions, predictions, assumptions, and forecasts. Together, descriptive and inferential statistics help evaluate knowledge management strategy implementation and reveal its value and return on investment.
Areas In Statistics
Information about these areas in statistics: descriptive statistics, inferential statistics and regression.
Statistics
Descriptive statistics are used to describe data, while inferential statistics allow inferences to be made about a population based on a sample. Descriptive statistics include measures of central tendency like the mean, median, and mode as well as measures of variability such as range, variance, and standard deviation. Inferential statistics comprise techniques like estimation, hypothesis testing, prediction, and regression. Estimation involves calculating point estimates and intervals to estimate unknown population parameters. Hypothesis testing structures a dilemma to test hypotheses against sample data. Prediction forecasts future observations based on past data. Regression models the relationship between variables as a linear function.
Statistics
Descriptive statistics are used to describe data, while inferential statistics allow inferences to be made about a population based on a sample. Descriptive statistics include measures of central tendency like the mean, median, and mode as well as measures of variability such as range, variance, and standard deviation. Inferential statistics comprise techniques like estimation, hypothesis testing, prediction, and regression. Estimation involves calculating point estimates and intervals to estimate unknown population parameters. Hypothesis testing structures hypotheses to test using statistical tests and significance levels. Prediction forecasts future observations based on past data, while regression models relationships between variables.
Statistical treatment of data
Frequency and percentage distributions organize raw data by counting observations within each data point or group. Weighted means calculate averages where some data points contribute more weight than others. Statistical treatment of data through methods like these is essential to appropriately analyze data and draw valid conclusions from experiments.
Chapter#9
This document discusses statistical quality control and descriptive statistics. It explains that statistical quality control uses statistical methods to assess product or process quality, and was an important tool for Japan's automobile industry success. Descriptive statistics involves organizing, summarizing, and presenting data, and has measures for central tendency (mean, median, mode) and variation (standard deviation, variance). Examples are provided to demonstrate calculating these descriptive statistics. Histograms and normal distributions are also covered.
Malimu descriptive statistics.
Descriptive statistics are used to summarize and describe characteristics of a data set. They include measures of central tendency like the mean, median, and mode as well as measures of variability such as range, standard deviation, and variance. Descriptive statistics help analyze and understand patterns in data through tables, charts, and summaries without drawing inferences about the underlying population.
Exploratory data analysis project
This document summarizes an exploratory data analysis project on a credit card application dataset. The analysis involved examining relationships between variables, identifying variables that best distinguish between positive and negative application outcomes, and calculating statistical metrics. Key variables like A2, A3, A8, and A14 showed differences in distributions between positive and negative classes. Correlation and R-squared analyses revealed that variables A2, A3, A8, and A11 explained the most variance in the classification variable. The analysis uncovered useful insights that will help build an effective predictive model.
Statistics for data science
The document provides an overview of statistics for data science. It introduces key concepts including descriptive versus inferential statistics, different types of variables and data, probability distributions, and statistical analysis methods. Descriptive statistics are used to describe data through measures of central tendency, variability, and visualization techniques. Inferential statistics enable drawing conclusions about populations from samples using hypothesis testing, confidence intervals, and regression analysis.
Business Statistics
This course introduces students to statistical techniques for business decision making. Students will learn to analyze and present business data using appropriate software and statistical tools. Topics covered include descriptive statistics, probability, sampling, hypothesis testing, regression analysis, and comparing means of two and three groups. Assessments include a midterm, project, and final exam. Statistics are used to organize and analyze information to make it more easily understood, allowing judgments about the world. Descriptive statistics describe characteristics of data sets, while inferential statistics allow inferences about populations from data samples.
Data analysis and Interpretation
This document discusses various statistical analysis techniques used in marketing research. It begins by explaining how to bring raw data into order through arrays, tabulations and establishing categories. It then discusses descriptive, inferential, differences, associative and predictive analysis. The document also covers univariate techniques like t-tests, z-tests, ANOVA, chi-square tests and multivariate techniques like regression, conjoint analysis and cluster analysis. It provides guidance on when to use specific statistical tests and covers statistics used in cross-tabulation like phi coefficient, contingency coefficient and Cramer's V.
Descriptive and Inferential Statistics
The two major areas of statistics are: descriptive statistics and inferential statistics. In this presentation, the difference between the two are shown including examples.
What's hot (18)
Descriptive & inferential statistics presentation 2
Descriptive & inferential statistics presentation 2
Similar to Probability Distribution
Basic probability theory and statistics
This presentation guide you through Basic Probability Theory and Statistics, those are Random Experiment, Sample Space, Random Variables, Probability, Conditional Probability, Variance, Probability Distribution, Joint Probability Distribution, Conditional Probability Distribution (CPD) and Factor.
For more topics stay tuned with Learnbay.
AP Statistic and Probability 6.1 (1).ppt
The document summarizes key concepts about discrete and continuous random variables from Chapter 6 of The Practice of Statistics textbook. It defines discrete and continuous random variables and their probability distributions. It also explains how to calculate the mean, standard deviation, and probabilities of events for both discrete and continuous random variables. For example, it shows how to find the probability that a randomly chosen woman is between 68 and 70 inches tall using the normal distribution.
Data science
Here are the key differences between supervised and unsupervised learning:
Supervised Learning:
- Uses labeled examples/data to learn. The labels provide correct answers for the learning algorithm.
- The goal is to build a model that maps inputs to outputs based on example input-output pairs.
- Common algorithms include linear/logistic regression, decision trees, k-nearest neighbors, SVM, neural networks.
- Used for classification and regression predictive problems.
Unsupervised Learning:
- Uses unlabeled data where there are no correct answers provided.
- The goal is to find hidden patterns or grouping in the data.
- Common algorithms include clustering, association rule learning, self-organizing maps.
-
Chi2 Anova
The document discusses various statistical tests for analyzing relationships between variables, including tests for statistical independence, chi-square tests, and analysis of variance (ANOVA). It explains that statistical independence is when the probability of two variables occurring together equals the product of their individual probabilities. Chi-square tests compare observed and expected frequencies to test if variables are independent. ANOVA decomposes variance and can test if population means are equal. It distinguishes explained from unexplained variance.
BRM_Data Analysis, Interpretation and Reporting Part II.ppt
This document provides an overview of data analysis, interpretation, and reporting. It discusses descriptive and inferential analysis, and univariate, bivariate, and multivariate analysis. Specific quantitative analysis techniques covered include measures of central tendency, dispersion, frequency distributions, histograms, and tests of normality. Hypothesis testing procedures like t-tests, ANOVA, and non-parametric alternatives are also summarized. Steps in hypothesis testing include stating the null hypothesis, choosing a statistical test, specifying the significance level, and deciding whether to reject or fail to reject the null hypothesis based on findings.
Introduction to Statistics and Probability
This document provides an introduction to statistics and probability. It discusses key concepts in descriptive statistics including measures of central tendency (mean, median, mode), measures of dispersion (range, standard deviation), and measures of shape (skewness, kurtosis). It also covers correlation analysis, regression analysis, and foundational probability topics such as sample spaces, events, independent and dependent events, and theorems like the addition rule, multiplication rule, and total probability theorem.
CO Data Science - Workshop 1: Probability Distributions
This document provides an introduction to probability and probability distributions. It discusses key concepts in probability such as the fundamentals of probability, random variables, and types of probability distributions. It also covers discrete distributions like the binomial, geometric, and negative binomial distributions. Continuous distributions such as the exponential, normal, and uniform distributions are also discussed. Worked examples are provided to illustrate concepts like calculating probabilities and distribution parameters.
CO Data Science - Workshop 1: Probability Distributiions
As the first session in this four part series, the discussion will be aimed at getting everyone on the same page for later sessions.
We will look at mathematical notation, probability, expectation, variance, and end this session with common probability distributions and use cases.
Slides created by and workshop taught by:
Josh Bernard, Associate Data Science Instructor at Galvanize
DMV (1) (1).docx
This document provides an overview of random variables and probability distributions. It defines discrete and continuous random variables and gives examples of each. Discrete random variables take on countable values while continuous random variables can assume any value within a range. The document also covers key concepts like the mean, variance, and probability mass/density functions of random variables. Independence and covariance of random variables are explained. Independence means the occurrence of one event does not impact the probability of another, while covariance measures how two variables change together.
Probability distribution Function & Decision Trees in machine learning
A detailed explanation of PDF & Decision Trees with MatLab Code implementation and real-life examples.
Optimistic decision making using an
Min-based qualitative possibilistic networks are one of the effective tools for a compact representation of
decision problems under uncertainty. The exact approaches for computing decision based on possibilistic
networks are limited by the size of the possibility distributions. Generally, these approaches are based on
possibilistic propagation algorithms. An important step in the computation of the decision is the
transformation of the DAG (Direct Acyclic Graph) into a secondary structure, known as the junction trees
(JT). This transformation is known to be costly and represents a difficult problem. We propose in this paper
a new approximate approach for the computation of decision under uncertainty within possibilistic
networks. The computing of the optimal optimistic decision no longer goes through the junction tree
construction step. Instead, it is performed by calculating the degree of normalization in the moral graph
resulting from the merging of the possibilistic network codifying knowledge of the agent and that codifying
its preferences.
DL-unit-1.pptx
Linear algebra concepts such as vectors, matrices, and tensors are useful in machine learning because inputs and outputs are represented as vectors. Vectors are arrays of numbers that can represent things like images, sound, or other data. Matrices are 2D arrays that are used for operations like multiplying vectors and matrices. Tensors generalize matrices to higher dimensions. Other key concepts include linear dependence, eigendecomposition, singular value decomposition, and linear algebra operations. Probability and information theory concepts are also important, including random variables, probability distributions, expectation, variance, independence, Bayes' theorem, entropy, and structured probabilistic models.
Continuous probability Business Statistics, Management
This document discusses different types of continuous probability distributions including uniform, normal, and exponential distributions. It provides examples of how each distribution is used and defined mathematically. The normal distribution is described as the most important for describing continuous random variables. Real-world examples of when each distribution would be used are given, such as height, test scores, and time between events. Business applications like risk evaluation, sales forecasting, and manufacturing costs are also summarized. Finally, it emphasizes that probability is involved in many aspects of daily life beyond just academics.
01.IntroToProbability_Armidale.pdf
This document introduces key probability distributions including binomial, Poisson, and normal distributions. It explains that probability distributions are used to represent the variability and uncertainty in random variables and experimental data. Random variables can take discrete or continuous sets of possible values, and different types of distributions like probability mass functions and probability density functions are used to define the probabilities associated with each possible value. Parameters of distributions control their shape and can provide useful information about the data.
Application of Univariate, Bi-variate and Multivariate analysis Pooja k shetty
This document discusses different types of statistical analysis used to analyze data. Univariate analysis examines one variable at a time through methods like frequency distributions, histograms, and pie charts. Bivariate analysis considers the relationship between two variables, such as income and weight. Multivariate analysis studies three or more variables simultaneously, with applications in fields like social science, climatology, and medicine.
random variation 9473 by jaideep.ppt
This document discusses random variables and their probability distributions. It begins by defining a random variable as a variable whose values are numerical outcomes of a random experiment. Random variables can be discrete or continuous. A discrete random variable takes on a fixed set of possible values, while a continuous random variable takes values in an interval. The probability distribution of a random variable specifies its possible values and their probabilities. The mean and variance of a random variable are also discussed. The mean is a weighted average of the possible values, with weights given by each value's probability. The variance measures how spread out the values are from the mean. The law of large numbers states that as the sample size increases, the sample mean gets closer to the population mean.
Basic statistics
This document provides an overview of basic statistical concepts for bio science students. It defines measures of central tendency including mean, median, and mode. It also discusses measures of dispersion like range and standard deviation. Common probability distributions such as binomial, Poisson, and normal distributions are explained. Hypothesis testing concepts like p-values and types of statistical tests for different types of data like t-tests for continuous variables and chi-square tests for categorical data are summarized along with examples.
Important terminologies
This document is highly important for the learners of research methodology. A number of statistical terminologies are defined with examples for the simplicity of learners.
Basic Statistical Descriptions of Data.pptx
This document provides an overview of 7 basic statistical concepts for data science: 1) descriptive statistics such as mean, mode, median, and standard deviation, 2) measures of variability like variance and range, 3) correlation, 4) probability distributions, 5) regression, 6) normal distribution, and 7) types of bias. Descriptive statistics are used to summarize data, variability measures dispersion, correlation measures relationships between variables, and probability distributions specify likelihoods of events. Regression models relationships, normal distribution is often assumed, and biases can influence analyses.
Similar to Probability Distribution (20)
BRM_Data Analysis, Interpretation and Reporting Part II.ppt
BRM_Data Analysis, Interpretation and Reporting Part II.ppt
CO Data Science - Workshop 1: Probability Distributions
CO Data Science - Workshop 1: Probability Distributions
CO Data Science - Workshop 1: Probability Distributiions
CO Data Science - Workshop 1: Probability Distributiions
Probability distribution Function & Decision Trees in machine learning
Probability distribution Function & Decision Trees in machine learning
Continuous probability Business Statistics, Management
Continuous probability Business Statistics, Management
Application of Univariate, Bi-variate and Multivariate analysis Pooja k shetty
Application of Univariate, Bi-variate and Multivariate analysis Pooja k shetty
Recently uploaded
International Conference on NLP, Artificial Intelligence, Machine Learning an...
International Conference on NLP, Artificial Intelligence, Machine Learning and Applications (NLAIM 2024) offers a premier global platform for exchanging insights and findings in the theory, methodology, and applications of NLP, Artificial Intelligence, Machine Learning, and their applications. The conference seeks substantial contributions across all key domains of NLP, Artificial Intelligence, Machine Learning, and their practical applications, aiming to foster both theoretical advancements and real-world implementations. With a focus on facilitating collaboration between researchers and practitioners from academia and industry, the conference serves as a nexus for sharing the latest developments in the field.
A review on techniques and modelling methodologies used for checking electrom...
The proper function of the integrated circuit (IC) in an inhibiting electromagnetic environment has always been a serious concern throughout the decades of revolution in the world of electronics, from disjunct devices to today’s integrated circuit technology, where billions of transistors are combined on a single chip. The automotive industry and smart vehicles in particular, are confronting design issues such as being prone to electromagnetic interference (EMI). Electronic control devices calculate incorrect outputs because of EMI and sensors give misleading values which can prove fatal in case of automotives. In this paper, the authors have non exhaustively tried to review research work concerned with the investigation of EMI in ICs and prediction of this EMI using various modelling methodologies and measurement setups.
Optimizing Gradle Builds - Gradle DPE Tour Berlin 2024
Sinan from the Delivery Hero mobile infrastructure engineering team shares a deep dive into performance acceleration with Gradle build cache optimizations. Sinan shares their journey into solving complex build-cache problems that affect Gradle builds. By understanding the challenges and solutions found in our journey, we aim to demonstrate the possibilities for faster builds. The case study reveals how overlapping outputs and cache misconfigurations led to significant increases in build times, especially as the project scaled up with numerous modules using Paparazzi tests. The journey from diagnosing to defeating cache issues offers invaluable lessons on maintaining cache integrity without sacrificing functionality.
Harnessing WebAssembly for Real-time Stateless Streaming Pipelines
Traditionally, dealing with real-time data pipelines has involved significant overhead, even for straightforward tasks like data transformation or masking. However, in this talk, we’ll venture into the dynamic realm of WebAssembly (WASM) and discover how it can revolutionize the creation of stateless streaming pipelines within a Kafka (Redpanda) broker. These pipelines are adept at managing low-latency, high-data-volume scenarios.
Literature Review Basics and Understanding Reference Management.pptx
Three-day training on academic research focuses on analytical tools at United Technical College, supported by the University Grant Commission, Nepal. 24-26 May 2024
ACEP Magazine edition 4th launched on 05.06.2024
This document provides information about the third edition of the magazine "Sthapatya" published by the Association of Civil Engineers (Practicing) Aurangabad. It includes messages from current and past presidents of ACEP, memories and photos from past ACEP events, information on life time achievement awards given by ACEP, and a technical article on concrete maintenance, repairs and strengthening. The document highlights activities of ACEP and provides a technical educational article for members.
A SYSTEMATIC RISK ASSESSMENT APPROACH FOR SECURING THE SMART IRRIGATION SYSTEMS
The smart irrigation system represents an innovative approach to optimize water usage in agricultural and landscaping practices. The integration of cutting-edge technologies, including sensors, actuators, and data analysis, empowers this system to provide accurate monitoring and control of irrigation processes by leveraging real-time environmental conditions. The main objective of a smart irrigation system is to optimize water efficiency, minimize expenses, and foster the adoption of sustainable water management methods. This paper conducts a systematic risk assessment by exploring the key components/assets and their functionalities in the smart irrigation system. The crucial role of sensors in gathering data on soil moisture, weather patterns, and plant well-being is emphasized in this system. These sensors enable intelligent decision-making in irrigation scheduling and water distribution, leading to enhanced water efficiency and sustainable water management practices. Actuators enable automated control of irrigation devices, ensuring precise and targeted water delivery to plants. Additionally, the paper addresses the potential threat and vulnerabilities associated with smart irrigation systems. It discusses limitations of the system, such as power constraints and computational capabilities, and calculates the potential security risks. The paper suggests possible risk treatment methods for effective secure system operation. In conclusion, the paper emphasizes the significant benefits of implementing smart irrigation systems, including improved water conservation, increased crop yield, and reduced environmental impact. Additionally, based on the security analysis conducted, the paper recommends the implementation of countermeasures and security approaches to address vulnerabilities and ensure the integrity and reliability of the system. By incorporating these measures, smart irrigation technology can revolutionize water management practices in agriculture, promoting sustainability, resource efficiency, and safeguarding against potential security threats.
Unit-III-ELECTROCHEMICAL STORAGE DEVICES.ppt
Batteries -Introduction – Types of Batteries – discharging and charging of battery - characteristics of battery –battery rating- various tests on battery- – Primary battery: silver button cell- Secondary battery :Ni-Cd battery-modern battery: lithium ion battery-maintenance of batteries-choices of batteries for electric vehicle applications.
Fuel Cells: Introduction- importance and classification of fuel cells - description, principle, components, applications of fuel cells: H2-O2 fuel cell, alkaline fuel cell, molten carbonate fuel cell and direct methanol fuel cells.
哪里办理(csu毕业证书)查尔斯特大学毕业证硕士学历原版一模一样
原版一模一样【微信:741003700 】【(csu毕业证书)查尔斯特大学毕业证硕士学历】【微信:741003700 】学位证,留信认证(真实可查,永久存档)offer、雅思、外壳等材料/诚信可靠,可直接看成品样本,帮您解决无法毕业带来的各种难题!外壳,原版制作,诚信可靠,可直接看成品样本。行业标杆!精益求精,诚心合作,真诚制作!多年品质 ,按需精细制作,24小时接单,全套进口原装设备。十五年致力于帮助留学生解决难题,包您满意。
本公司拥有海外各大学样板无数,能完美还原海外各大学 Bachelor Diploma degree, Master Degree Diploma
1:1完美还原海外各大学毕业材料上的工艺:水印,阴影底纹,钢印LOGO烫金烫银,LOGO烫金烫银复合重叠。文字图案浮雕、激光镭射、紫外荧光、温感、复印防伪等防伪工艺。材料咨询办理、认证咨询办理请加学历顾问Q/微741003700
留信网认证的作用:
1:该专业认证可证明留学生真实身份
2:同时对留学生所学专业登记给予评定
3:国家专业人才认证中心颁发入库证书
4:这个认证书并且可以归档倒地方
5:凡事获得留信网入网的信息将会逐步更新到个人身份内,将在公安局网内查询个人身份证信息后,同步读取人才网入库信息
6:个人职称评审加20分
7:个人信誉贷款加10分
8:在国家人才网主办的国家网络招聘大会中纳入资料,供国家高端企业选择人才
Electric vehicle and photovoltaic advanced roles in enhancing the financial p...
Climate change's impact on the planet forced the United Nations and governments to promote green energies and electric transportation. The deployments of photovoltaic (PV) and electric vehicle (EV) systems gained stronger momentum due to their numerous advantages over fossil fuel types. The advantages go beyond sustainability to reach financial support and stability. The work in this paper introduces the hybrid system between PV and EV to support industrial and commercial plants. This paper covers the theoretical framework of the proposed hybrid system including the required equation to complete the cost analysis when PV and EV are present. In addition, the proposed design diagram which sets the priorities and requirements of the system is presented. The proposed approach allows setup to advance their power stability, especially during power outages. The presented information supports researchers and plant owners to complete the necessary analysis while promoting the deployment of clean energy. The result of a case study that represents a dairy milk farmer supports the theoretical works and highlights its advanced benefits to existing plants. The short return on investment of the proposed approach supports the paper's novelty approach for the sustainable electrical system. In addition, the proposed system allows for an isolated power setup without the need for a transmission line which enhances the safety of the electrical network
Iron and Steel Technology Roadmap - Towards more sustainable steelmaking.pdf
Iron and Steel Technology towards Sustainable Steelmaking
Redefining brain tumor segmentation: a cutting-edge convolutional neural netw...
Medical image analysis has witnessed significant advancements with deep learning techniques. In the domain of brain tumor segmentation, the ability to
precisely delineate tumor boundaries from magnetic resonance imaging (MRI)
scans holds profound implications for diagnosis. This study presents an ensemble convolutional neural network (CNN) with transfer learning, integrating
the state-of-the-art Deeplabv3+ architecture with the ResNet18 backbone. The
model is rigorously trained and evaluated, exhibiting remarkable performance
metrics, including an impressive global accuracy of 99.286%, a high-class accuracy of 82.191%, a mean intersection over union (IoU) of 79.900%, a weighted
IoU of 98.620%, and a Boundary F1 (BF) score of 83.303%. Notably, a detailed comparative analysis with existing methods showcases the superiority of
our proposed model. These findings underscore the model’s competence in precise brain tumor localization, underscoring its potential to revolutionize medical
image analysis and enhance healthcare outcomes. This research paves the way
for future exploration and optimization of advanced CNN models in medical
imaging, emphasizing addressing false positives and resource efficiency.
IEEE Aerospace and Electronic Systems Society as a Graduate Student Member
IEEE Aerospace and Electronic Systems Society as a Graduate Student Member
The Python for beginners. This is an advance computer language.
Python language is very important language at this time. we can easily understand this language by these notes.
Casting-Defect-inSlab continuous casting.pdf
Casting-Defect-inSlab continuous casting. Casting-Defect-inSlab continuous casting. Casting-Defect-inSlab continuous casting. Casting-Defect-inSlab continuous casting. Casting-Defect-inSlab continuous casting. Casting-Defect-inSlab continuous casting. Casting-Defect-inSlab continuous casting. Casting-Defect-inSlab continuous casting
Modelagem de um CSTR com reação endotermica.pdf
Modelagem em função de transferencia. CSTR não-linear.
Recently uploaded (20)
International Conference on NLP, Artificial Intelligence, Machine Learning an...
International Conference on NLP, Artificial Intelligence, Machine Learning an...
A review on techniques and modelling methodologies used for checking electrom...
A review on techniques and modelling methodologies used for checking electrom...
Optimizing Gradle Builds - Gradle DPE Tour Berlin 2024
Optimizing Gradle Builds - Gradle DPE Tour Berlin 2024
Harnessing WebAssembly for Real-time Stateless Streaming Pipelines
Harnessing WebAssembly for Real-time Stateless Streaming Pipelines
Literature Review Basics and Understanding Reference Management.pptx
Literature Review Basics and Understanding Reference Management.pptx
A SYSTEMATIC RISK ASSESSMENT APPROACH FOR SECURING THE SMART IRRIGATION SYSTEMS
A SYSTEMATIC RISK ASSESSMENT APPROACH FOR SECURING THE SMART IRRIGATION SYSTEMS
Generative AI leverages algorithms to create various forms of content
Generative AI leverages algorithms to create various forms of content
Electric vehicle and photovoltaic advanced roles in enhancing the financial p...
Electric vehicle and photovoltaic advanced roles in enhancing the financial p...
Iron and Steel Technology Roadmap - Towards more sustainable steelmaking.pdf
Iron and Steel Technology Roadmap - Towards more sustainable steelmaking.pdf
Redefining brain tumor segmentation: a cutting-edge convolutional neural netw...
Redefining brain tumor segmentation: a cutting-edge convolutional neural netw...
IEEE Aerospace and Electronic Systems Society as a Graduate Student Member
IEEE Aerospace and Electronic Systems Society as a Graduate Student Member
The Python for beginners. This is an advance computer language.
The Python for beginners. This is an advance computer language.
Probability Distribution
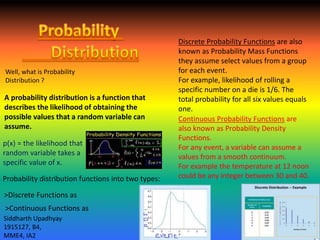
- 1. A probability distribution is a function that describes the likelihood of obtaining the possible values that a random variable can assume. p(x) = the likelihood that random variable takes a specific value of x. Probability distribution functions into two types: Discrete Probability Functions are also known as Probability Mass Functions they assume select values from a group for each event. For example, likelihood of rolling a specific number on a die is 1/6. The total probability for all six values equals one. Continuous Probability Functions are also known as Probability Density Functions. For any event, a variable can assume a values from a smooth continuum. For example the temperature at 12 noon could be any integer between 30 and 40. Well, what is Probability Distribution ? >Discrete Functions as >Continuous Functions as Siddharth Upadhyay 1915127, B4, MME4, IA2
- 2. Applications of Probability Distributions Elections Consumer Production Equities and investment >Data samples of electorates are collected and Probability Distribution functions are generated. >This helps in analysing the possible deviations of the universal group from the Political Party’s hypothesis in the sample. Siddharth Upadhyay 1915127, B4, MME4, IA2 Normal Distributions are laid out about various likes of population and the production is set targeting specific segments such probability distributions. The historical price, volume and days are noted and Probability distributions are crafted that help in analysing the price at a particular combination of events in future.