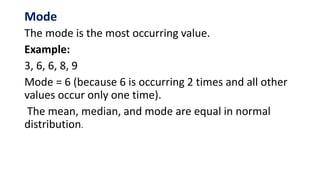
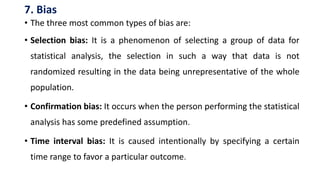
Basic Statistical Descriptions of Data
Dr.V.Anusuya
Associate Professor/IT
Ramco Institute of Technology
• Seven basic Statistics Concepts for Data Science.
1. Descriptive Statistics
• To describe the basic features of data that provide a summary of the
given data set which can either represent the entire population or a
sample of the population. It is derived from calculations that include:
• Mean: It is the central value which is commonly known as arithmetic
average.
• Mode: It refers to the value that appears most often in a data set.
• Median: It is the middle value of the ordered set that divides it in
exactly half.
Mean
Example:
To find the mean of 6, 18, and 24, you would first add them
together.
6 + 18 + 24 = 48
Then, divide by how many numbers in the list (3).
48 / 3 = 16
The mean is 16.
Mean for Grouped Data
• Mean () is defined for the grouped data as the sum of the product of
observations (xi) and their corresponding frequencies (fi) divided by the sum
of all the frequencies (fi).
• Example: If the values (xi) of the observations and their frequencies (fi) are
given as follows:
Xi 4 6 15 10 9
fi 5 10 8 7 10
Contd.,
= (4×5 + 6×10 + 15×8 + 10×7 + 9×10) ÷ (5 + 10 + 8 + 7 + 10)
⇒ = (20 + 60 + 120 + 70 + 90) ÷ 40
⇒ = 360 ÷ 40
⇒ = 9
Median
Median is the middle value among all values.
• Odd number of values
Example:
9, 8, 5, 6, 3
Arrange values in order
3, 5, 6, 8, 9
Median = 6
• An even number of values?
• Example:
9, 8, 5, 6, 3, 4
Arrange values in order
3, 4, 5, 6, 8, 9
Add 2 middle values and calculate their mean.
Median = 5+6/2
Median = 5.5
Median of Grouped Data
Class 10 – 20 20 – 30 30 – 40 40 – 50 50 – 60
Frequ
ency
5 10 12 8 5
Where,
l is the lower limit of median class,
N is the total number of observations,
cf is the cumulative frequency of the preceding class,
f is the frequency of each class, and
h is the class size.
Create the following table for the given data
Class Frequency Cumulative Frequency
10 – 20 5 5
20 – 30 10 15
30 – 40 12 27
40 – 50 8 35
50 – 60 5 40
Contd.,
As N = 40 and N/2 = 20,
Thus, 30 – 40 is the median class.
l = 30, cf = 15, f = 12, and h = 10
Putting the values in the formula
Median = 30 + (20 – 15)/12) × 10
⇒ Median = 30 + (5/12) × 10
⇒ Median = 30 + 4.17
⇒ Median = 34.17
So, the median value for this data set is 34.17
Mode
The mode is the most occurring value.
Example:
3, 6, 6, 8, 9
Mode = 6 (because 6 is occurring 2 times and all other
values occur only one time).
The mean, median, and mode are equal in normal
distribution.
2. Variability
• Variability includes the following parameters:
• Standard Deviation: It is a statistic that calculates the dispersion of a data set as
compared to its mean.
• Variance: It refers to a statistical measure of the spread between the numbers in a data
set. In general terms, it means the difference from the mean. A large variance indicates
that numbers are far apart from the mean or average value. Small variance indicates
that the numbers are closer to the average values. Zero variance indicates that the
values are identical to the given set.
• Range: This is defined as the difference between the largest and smallest value of a
dataset.
• Percentile: It refers to the measure used in statistics that indicates the value below
which the given percentage of observation in the dataset falls.
• Quartile: It is defined as the value that divides the data points into quarters.
• Interquartile Range: It measures the middle half of your data. In general terms, it is the
middle 50% of the dataset.
Contd.,
The formula to calculate the standard deviation is:
σ2 = Σ(x − μ)2/n, Where-
The symbol for standard deviation is σ
Σ stands for the sum of the data
x stands for the value of the dataset
μ stands for the mean of the data
σ2 stands for the variance
C
•RE
n
AT Ds
BYtK.
a
VIC
n
TOR
d
BAs
BU for the number of data points in the population
Contd.,
• Find the standard deviation of 4, 9, 11, 12, 17, 5, 8, 12, 14
• First work out the mean: 10.222
• Now, subtract the mean individually from each of the numbers given and
square the result. This is equivalent to the (x)² step. x refers to the values
given in the question.
Now add up these results (this is the 'sigma' in the formula): 139.55
-Divide by n. n is the number of values, so in this case is 9. This gives us:
15.51 Hence square root is: 3.94
Percentiles
• Percentiles are used in statistics to give you a number that
describes the value that a given percent of the values are
lower than.
3. Correlation
• It is one of the major statistical techniques that measure the relationship
between two variables. The correlation coefficient indicates the strength of
the linear relationship between two variables.
• A correlation coefficient that is more than zero indicates a positive
relationship.
• A correlation coefficient that is less than zero indicates a negative
relationship.
• Correlation coefficient zero indicates that there is no relationship between
the two variables.
4. Probability Distribution
• It specifies the likelihood of all possible events. In simple terms, an
event refers to the result of an experiment like tossing a coin. Events
are of two types dependent and independent.
Contd.,
• Independent event: The event is said to be an Independent event
when it is not affected by the earlier events.
• For example, tossing a coin, let us consider a coin is tossed the first
outcome is head when the coin is tossed again the outcome may be
head or tail. But this is entirely independent of the first trial.
Contd.,
• Dependent event: The event is said to be dependent when the
occurrence of the event is dependent on the earlier events.
• For example when a ball is drawn from a bag that contains red and blue
balls. If the first ball drawn is red, then the second ball may be red or blue;
this depends on the first trial.
• The probability of independent events is calculated by simply multiplying
the probability of each event and for a dependent event is calculated by
conditional probability.
5. Regression
• To determine the relationship between one or more independent
variables and a dependent variable. Regression is mainly of two types:
• Linear regression: It is used to fit the regression model that explains
the relationship between a numeric predictor variable and one or
more predictor variables.
• Logistic regression: It is used to fit a regression model that explains
the relationship between the binary response variable and one or
more predictor variables.
6. Normal Distribution
• Normal is used to define the probability density function for a
continuous random variable in a system.
• The standard normal distribution has two parameters – mean and
standard deviation.
• When the distribution of random variables is unknown, the normal
distribution is used. The central limit theorem justifies why normal
distribution is used in such cases.
7. Bias
• The three most common types of bias are:
• Selection bias: It is a phenomenon of selecting a group of data for
statistical analysis, the selection in such a way that data is not
randomized resulting in the data being unrepresentative of the whole
population.
• Confirmation bias: It occurs when the person performing the statistical
analysis has some predefined assumption.
• Time interval bias: It is caused intentionally by specifying a certain
time range to favor a particular outcome.

Basic Statistical Descriptions of Data.pptx

  • 1.
    Basic Statistical Descriptionsof Data Dr.V.Anusuya Associate Professor/IT Ramco Institute of Technology
  • 2.
    • Seven basicStatistics Concepts for Data Science.
  • 3.
    1. Descriptive Statistics •To describe the basic features of data that provide a summary of the given data set which can either represent the entire population or a sample of the population. It is derived from calculations that include: • Mean: It is the central value which is commonly known as arithmetic average. • Mode: It refers to the value that appears most often in a data set. • Median: It is the middle value of the ordered set that divides it in exactly half.
  • 4.
    Mean Example: To find themean of 6, 18, and 24, you would first add them together. 6 + 18 + 24 = 48 Then, divide by how many numbers in the list (3). 48 / 3 = 16 The mean is 16.
  • 5.
    Mean for GroupedData • Mean () is defined for the grouped data as the sum of the product of observations (xi) and their corresponding frequencies (fi) divided by the sum of all the frequencies (fi). • Example: If the values (xi) of the observations and their frequencies (fi) are given as follows: Xi 4 6 15 10 9 fi 5 10 8 7 10
  • 6.
    Contd., = (4×5 +6×10 + 15×8 + 10×7 + 9×10) ÷ (5 + 10 + 8 + 7 + 10) ⇒ = (20 + 60 + 120 + 70 + 90) ÷ 40 ⇒ = 360 ÷ 40 ⇒ = 9
  • 7.
    Median Median is themiddle value among all values. • Odd number of values Example: 9, 8, 5, 6, 3 Arrange values in order 3, 5, 6, 8, 9 Median = 6 • An even number of values? • Example: 9, 8, 5, 6, 3, 4 Arrange values in order 3, 4, 5, 6, 8, 9 Add 2 middle values and calculate their mean. Median = 5+6/2 Median = 5.5
  • 8.
    Median of GroupedData Class 10 – 20 20 – 30 30 – 40 40 – 50 50 – 60 Frequ ency 5 10 12 8 5 Where, l is the lower limit of median class, N is the total number of observations, cf is the cumulative frequency of the preceding class, f is the frequency of each class, and h is the class size.
  • 9.
    Create the followingtable for the given data Class Frequency Cumulative Frequency 10 – 20 5 5 20 – 30 10 15 30 – 40 12 27 40 – 50 8 35 50 – 60 5 40
  • 10.
    Contd., As N =40 and N/2 = 20, Thus, 30 – 40 is the median class. l = 30, cf = 15, f = 12, and h = 10 Putting the values in the formula Median = 30 + (20 – 15)/12) × 10 ⇒ Median = 30 + (5/12) × 10 ⇒ Median = 30 + 4.17 ⇒ Median = 34.17 So, the median value for this data set is 34.17
  • 11.
    Mode The mode isthe most occurring value. Example: 3, 6, 6, 8, 9 Mode = 6 (because 6 is occurring 2 times and all other values occur only one time). The mean, median, and mode are equal in normal distribution.
  • 12.
    2. Variability • Variabilityincludes the following parameters: • Standard Deviation: It is a statistic that calculates the dispersion of a data set as compared to its mean. • Variance: It refers to a statistical measure of the spread between the numbers in a data set. In general terms, it means the difference from the mean. A large variance indicates that numbers are far apart from the mean or average value. Small variance indicates that the numbers are closer to the average values. Zero variance indicates that the values are identical to the given set. • Range: This is defined as the difference between the largest and smallest value of a dataset. • Percentile: It refers to the measure used in statistics that indicates the value below which the given percentage of observation in the dataset falls. • Quartile: It is defined as the value that divides the data points into quarters. • Interquartile Range: It measures the middle half of your data. In general terms, it is the middle 50% of the dataset.
  • 13.
    Contd., The formula tocalculate the standard deviation is: σ2 = Σ(x − μ)2/n, Where- The symbol for standard deviation is σ Σ stands for the sum of the data x stands for the value of the dataset μ stands for the mean of the data σ2 stands for the variance C •RE n AT Ds BYtK. a VIC n TOR d BAs BU for the number of data points in the population
  • 14.
    Contd., • Find thestandard deviation of 4, 9, 11, 12, 17, 5, 8, 12, 14 • First work out the mean: 10.222 • Now, subtract the mean individually from each of the numbers given and square the result. This is equivalent to the (x)² step. x refers to the values given in the question. Now add up these results (this is the 'sigma' in the formula): 139.55 -Divide by n. n is the number of values, so in this case is 9. This gives us: 15.51 Hence square root is: 3.94
  • 15.
    Percentiles • Percentiles areused in statistics to give you a number that describes the value that a given percent of the values are lower than.
  • 16.
    3. Correlation • Itis one of the major statistical techniques that measure the relationship between two variables. The correlation coefficient indicates the strength of the linear relationship between two variables. • A correlation coefficient that is more than zero indicates a positive relationship. • A correlation coefficient that is less than zero indicates a negative relationship. • Correlation coefficient zero indicates that there is no relationship between the two variables.
  • 17.
    4. Probability Distribution •It specifies the likelihood of all possible events. In simple terms, an event refers to the result of an experiment like tossing a coin. Events are of two types dependent and independent.
  • 18.
    Contd., • Independent event:The event is said to be an Independent event when it is not affected by the earlier events. • For example, tossing a coin, let us consider a coin is tossed the first outcome is head when the coin is tossed again the outcome may be head or tail. But this is entirely independent of the first trial.
  • 19.
    Contd., • Dependent event:The event is said to be dependent when the occurrence of the event is dependent on the earlier events. • For example when a ball is drawn from a bag that contains red and blue balls. If the first ball drawn is red, then the second ball may be red or blue; this depends on the first trial. • The probability of independent events is calculated by simply multiplying the probability of each event and for a dependent event is calculated by conditional probability.
  • 20.
    5. Regression • Todetermine the relationship between one or more independent variables and a dependent variable. Regression is mainly of two types: • Linear regression: It is used to fit the regression model that explains the relationship between a numeric predictor variable and one or more predictor variables. • Logistic regression: It is used to fit a regression model that explains the relationship between the binary response variable and one or more predictor variables.
  • 21.
    6. Normal Distribution •Normal is used to define the probability density function for a continuous random variable in a system. • The standard normal distribution has two parameters – mean and standard deviation. • When the distribution of random variables is unknown, the normal distribution is used. The central limit theorem justifies why normal distribution is used in such cases.
  • 22.
    7. Bias • Thethree most common types of bias are: • Selection bias: It is a phenomenon of selecting a group of data for statistical analysis, the selection in such a way that data is not randomized resulting in the data being unrepresentative of the whole population. • Confirmation bias: It occurs when the person performing the statistical analysis has some predefined assumption. • Time interval bias: It is caused intentionally by specifying a certain time range to favor a particular outcome.